
My name is Robert Rector. I am Senior Research Fellow for Welfare and Family Issues at The Heritage Foundation. The views I express in this testimony are my own, and should not be construed as representing any official position of The Heritage Foundation.
Summary
This testimony provides a fiscal analysis of households headed by immigrants without a high school diploma. The testimony refers to these households as "low-skill immigrant households." My analysis, in particular, focuses on the harmful fiscal impact of low skill immigrants on state and local governments.
In FY 2004 there were around 4.5 million low-skill immigrant households in the U.S. containing 15.9 million persons. About 60 percent of these low-skill immigrant households were headed by legal immigrants and 40 percent by illegal immigrants. The analysis presented here measures the total benefits and services received by these "low- skill immigrant households" compared to the total taxes paid.
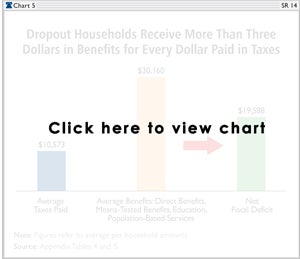
In FY 2004, the average low skill immigrant household received $30,160 in direct benefits, means-tested benefits, education, and population-based services from all levels of government. By contrast, low-skill immigrant households paid only $10,573 in taxes in FY 2004. A household's net fiscal deficit equals the cost of benefits and services received minus taxes paid. The average low-skill household had a fiscal deficit of $19,588 (expenditures of $30,160 minus $10,573 in taxes).
At the state and local level, the average low skill immigrant household received $14,145 in benefits and services and paid only $5,309 in taxes. The average low skill immigrant households imposed a net fiscal burden on state and local government of $8,836 per year.
The fiscal burden imposed by low skill immigrant households is slightly greater at the state and local level than at the federal level. The annual fiscal deficit for all 4.54 million low skill immigrant households at the state and local level in 2004 was $49.1 billion. Over the next ten years the state and local fiscal deficit caused by low skill immigrants on state and local governments will approach a half trillion dollars.
Current federal immigration policy permits a massive inflow of both legal and illegal low skill immigrants to enter and reside in the U.S. This imposes a massive unfunded mandate on state and local government which much bear the costs of that immigration flow.
Giving amnesty to illegal immigrants would increase the costs outlined in this testimony. Some 50 to 60 percent of illegal immigrants lack a high school degree. Granting amnesty or conditional amnesty to illegal immigrants would, overtime, increase their use of means-tested welfare, Social Security and Medicare. Fiscal costs would go up significantly in the short term but would go up dramatically after the amnesty recipient reached retirement. Based on my current research, I estimate that if all the current adult illegal immigrants in the U.S. were granted amnesty the net retirement costs to government (benefits minus taxes) could be over $2.5 trillion.
Recent proposed immigration legislation in the Senate and House will raise costs on the taxpayers at all levels of government. By granting amnesty to illegal immigrants (who are overwhelmingly low skilled) and creating massive new "guest worker" programs which would bring millions of additional low skill families into the nation, such legislation, if enacted, would impose massive costs on the U.S. taxpayer.
Types of Government Expenditure
To ascertain the distribution of government benefits and services, my analysis begins by dividing government expenditures into four categories: direct benefits; means-tested benefits; educational services; and population-based services.
Direct Benefits
Direct benefit programs involve either cash transfers or the purchase of specific services for an individual. Unlike means-tested programs (described below), direct benefit programs are not limited to low-income persons. By far, the largest direct benefit programs are Social Security and Medicare. At the state and local level, the major direct benefit programs are Unemployment Insurance and Workmen's Compensation. Overall, government spent $840 billion on direct benefits in FY 2004; of this $57.6 billion was state and local spending.
Means-Tested Benefits
Means-tested programs are typically termed welfare programs. Unlike direct benefits, means-tested programs are available only to households below specific income thresholds. Means-tested welfare programs provide cash, food, housing, medical care, and social services to poor and low-income persons.
The federal government operates over 60 means-tested aid programs.[1] The largest of these are Medicaid; the Earned Income Tax Credit (EITC); food stamps; Supplemental Security Income (SSI); Section 8 housing; public housing; Temporary Assistance to Needy Families (TANF); the school lunch and breakfast programs; the WIC (Women, Infants, and Children) nutrition program; and the Social Services Block Grant (SSBG). Many means-tested programs, such as SSI and the EITC, provide cash to recipients. Others, such as public housing or SSBG, pay for services that are provided to recipients. Overall, the U.S. spent $564 billion on means-tested aid in FY 2004.[2] Of this, $158.4 billion was state and local spending.
Public Education
Government provides primary, secondary, post-secondary, and vocational education to individuals. In most cases, the government pays directly for the cost of educational services provided. Education is the single largest component of state and local government spending, absorbing roughly a third of all state and local expenditures. The average per pupil cost of public primary and secondary education is now around $9,600 per year. Overall, federal, state, and local governments spent $590 billion on education in FY 2004. Of this $530.8 billion was state and local spending.
Population-Based Services
Whereas direct benefits, means-tested benefits, and education services provide discrete benefits and services to particular individuals, population-based programs generally provide services to a whole group or community. Population-based expenditures include police and fire protection, courts, parks, sanitation, and food safety and health inspections. Another important population-based expenditure is transportation, especially roads and highways.
A key feature of population-based expenditures is that such programs generally need to expand as the population of a community expands. (This quality separates them from pure public goods, described below.) For example, as the population of a community increases, the number of police and firemen will generally need to expand in proportion.
In its study of the fiscal costs of immigration, The New Americans, the National Academy of Sciences argued that if a service remains fixed while the population increases, a program will become "congested", and the quality of the service for users will deteriorate. Thus, the National Academy of Sciences uses the term "congestible goods" to describe population-based services.[3] Highways are an obvious example of this point. In general, the cost of population-based services can be allocated according to an individual's estimated utilization of the service or at a flat per capita cost across the relevant population. Government spent $662 billion on population-based services in FY 2004. Of this $481 billion was state and local spending.
Exclusion of Public Goods and Interest on Government Debt from Calculations
The four expenditure categories described above can be termed "immediate benefits and services". There are two additional spending categories, which are not relevant to immigrants. They are:
- Interest and other financial obligations resulting from prior government activity, including interest payments on government debt and other expenditures relating to the cost of government services provided in earlier years; and
- Pure public goods, which include national defense, international affairs and scientific research, and some environmental expenditures.
Unlike the first four spending categories, expenditures on public goods, debt and other financial obligations are fixed and are largely independent of the level or type of immigration flow into the U.S. The entry of legal or illegal immigrants into the U.S. will not cause expenditures in these two categories of expenditure to increase, therefore these two categories of expenditure are not included in the fiscal burden calculation for low-skill immigrants presented in this testimony.
The Declining Education Levels of Immigrants
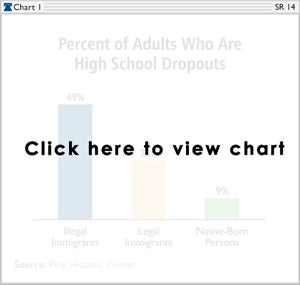
Current immigrants (both legal and illegal) have very low education levels relative to the non-immigrant U.S. population. As Chart 1 shows, some 50 percent, and perhaps as many as 60 percent, of illegal immigrant adults lack a high school degree.[4] Among legal immigrants the situation is better, but a quarter still lack a high school diploma. Overall, a third of immigrant households are headed by individuals without a high school degree. By contrast, only nine percent of non-immigrant adults lack a high school degree. The current immigrant population, thus, contains a disproportionate share of poorly educated individuals. These individuals will tend to have low wages, pay little in taxes and receive above average levels of government benefits and services.
There is a common misconception that the low education levels of recent immigrants is part of a permanent historical pattern, and that the U.S. has always brought in immigrants who were poorly educated relative to the native born population. Historically, this was not the case. For example, in 1960, recent immigrants were no more likely than were non-immigrants to lack a high school degree. By contrast, in 1998, recent immigrants were almost four times more likely to lack a high school degree than were non-immigrants.[5]
As the relative education level of immigrants fell so did their relative wage levels. In 1960, the average immigrant male in the U.S. actually earned more than the average non-immigrant man. As the relative education levels of subsequent waves of immigrants fell, so did relative wages. By 1998, the average immigrant earned 23 percent less than the average non-immigrant.[6]
Recent waves of immigrants are disproportionately low-skilled because of two factors. For years, the U.S. has had a permissive policy concerning illegal immigration: the 2000 mile border with Mexico has remained porous and the law prohibiting the hiring of illegal immigrants has not been enforced. This encourages a disproportionate flow of low-skill immigrants because few college educated workers are willing to undertake the risks and hardships associated with crossing the southwest U.S. deserts illegally. Second, the legal immigration system gives priority to "family reunification" and kinship ties rather than skills; this focus also significantly contributes to the inflow of low-skill immigrants into the U.S.
Fiscal Deficit at All Levels of Government
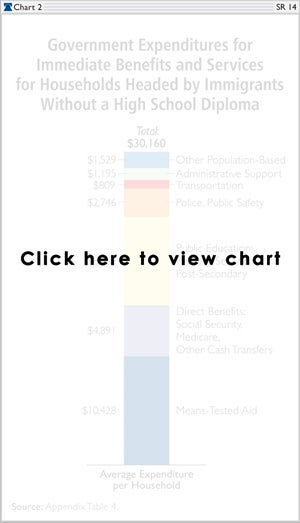
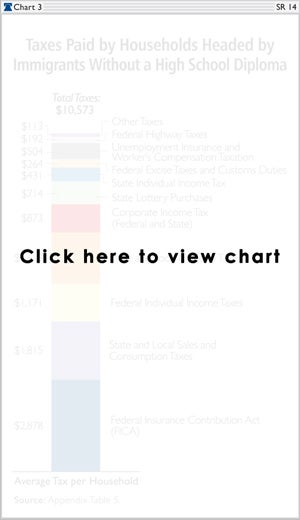
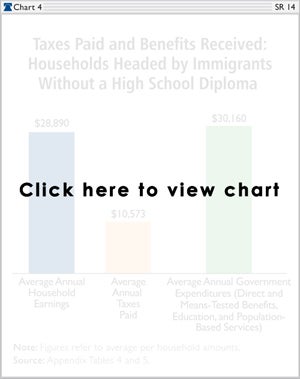
Looking at federal, state and local benefits combined, the average low skill immigrant household received $30,160 per household in direct benefits, means-tested benefits, education, and population-based services in FY 2004. By contrast, as Chart 2 shows, total federal, state, and local taxes paid by low-skill immigrant households came to $10,573 per household in 2004. The average fiscal deficit per low skill immigrant household was $19,588.
Age Distribution of Benefits and Taxes among Low-Skill Immigrants
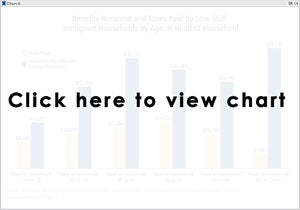
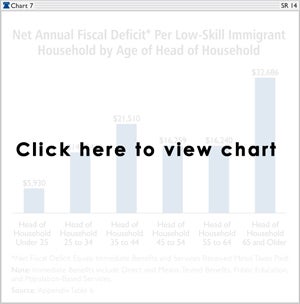
Chart 3 separates the 4.5 million low-skill immigrant households into six categories based on the age of the immigrant head of household. It shows benefits received and taxes paid at each age level. For each age category, the benefits received by low-skill immigrant households exceed the taxes paid.
These figures belie the notion that government can relieve financial strains in Social Security and other programs simply importing younger immigrant workers. The fiscal impact of an immigrant worker is determined far more by skill level than by age. Low-skill immigrant workers impose a net drain on government finance as soon as they enter the country and add significantly to those cost every year they remain. Actually, older low-skill immigrants are less costly to the U.S. taxpayer since they will be a burden on the fisc for a shorter period of time.
Fiscal Impact at the Federal Level
Low-skill immigrant households generate a fiscal deficit at both the federal level and the state and local level. As Chart 3 states, at the federal level, low-skill immigrant households receive, on average, $14,145 per year in benefits and pay $5,309 in taxes. This amounts to nearly three dollars in benefits for each dollar of taxes paid. The fiscal deficit (benefits received minus taxes paid) equaled $8,836 per household per year.
Fiscal Impact at the State and Local Level
The fiscal impact is actually somewhat larger at the state and local level than at the federal level. As Chart 4 shows the average low-skill immigrant household received $16,016 in state and local benefits while paying $5,263 in taxes. This amounts to over three dollars of benefits for each dollar of taxes paid. The state and local fiscal deficit (benefits received minus taxes paid) equaled $10,753 per household per year.
State and Local Benefits and Services
Chart 5 shows the state and local benefits received by the average low-skill immigrant household. Public education costs at $7,737 per household represent nearly half of these expenditures. The second largest expenditures is means-tested welfare. State and local governments run few of their own welfare programs, but they are required to financially contribute to many of the 60 different federal means-tested programs, such as Medicaid or the Temporary Assistance to Needy Families (TANF). The low-skill immigrant share of these expenditures came to $2,957 per household per year.
Police and fire protection was the third largest category of spending at $2,198 per household. Other state and local expenditures included transportation ($572 per household); unemployment insurances and worker's compensation ($488 per household); and sewer and utilities ($411 per household).
State and Local Taxes and Revenues
Chart 6 shows that low-skill immigrant households pay an average of $5,263 per household in state and local taxes. Sales and excise taxes ($1,706 per household) are the largest categories followed by property taxes ($1,618 per household). Annual lottery ticket purchases are estimated to be $714 per household. State individual income taxes are only a small portion of taxes paid ($431 per household).
Aggregate Annual Net Fiscal Costs
In 2004, there were 4.54 million low-skill immigrant households. The average net fiscal deficit per household for federal, state and local spending combined was $19,588. This means that the total annual fiscal deficit (total benefits received minus total taxes paid) for all 4.54 million low-skill immigrant households together equaled $89.1 billion.
Over half of this fiscal deficit occurs at the state and local level. The annual fiscal deficit for all low skill immigrant households at the state and local level in 2004 was $49.1 billion. Over the next ten years the state and local fiscal deficit will approach a half trillion dollars.

Estimation Methodology
The methodology used for the state and local fiscal estimates in this testimony is fully explained in my recent publication, The Fiscal Cost of Low Skill Households to the U.S. Taxpayer.[7] The analysis is based on three core methodological principles: comprehensiveness; fiscal accuracy; and transparency.
- Comprehensiveness - The analysis seeks to cover all government expenditures and all taxes and similar revenue sources for federal, state and local governments. Comprehensiveness helps to ensure balance in the analysis; if a study covers only a limited number of government spending programs or a portion of taxes, the omissions may bias the conclusions.
- Fiscal accuracy - A cardinal principle of the estimation procedure employed for each expenditure program or category in the analysis is that, if the procedure is replicated for the whole U.S. population, the resulting estimated expenditure will equal actual expenditures on the program according to official budgetary documents. The same principle is applied to each tax and revenue category. Altogether, the estimating procedures used in this paper, if applied to the entire U.S. population, will yield figures for total government spending and revenues that match the real life totals presented in budgetary sources.
- Transparency - Specific calculations were made for 30 separate tax and revenue categories and over 60 separate expenditure categories. Since conclusions can be influenced by the assumptions and procedures employed in any analysis, we have endeavored make the mechanics of the analysis as transparent as possible to interested readers by describing the details of each calculation in the monograph.[8]
Data on receipt of direct and means-tested benefits were taken from the U.S. Census Bureau's Current Population Survey (CPS). Data on attendance in public primary and secondary schools were also taken from the CPS; students attending public school were then assigned educational costs equal to the average per pupil expenditures in their state. Public post-secondary education costs were calculated in a similar manner.
Wherever possible, the cost of population-based services was based on the estimated utilization of the service by low-skill immigrant households. For example, the low-skill immigrant households' share of highway expenditures was assumed, in part, to equal their share of gasoline consumption as reported in the Bureau of Labor Statistics Consumer Expenditure Survey (CEX). When data on utilization of a service were not available, the estimated low-skill immigrant households' share of population-based services was assumed to equal their share of the total U.S. population.
Sales, excise, and property tax payments were based on consumption data from the Consumer Expenditure Survey (CEX). For example, if the CEX showed that low-skill immigrant households accounted for 10 percent of all tobacco product sales in the U.S., those households were assumed to pay 10 percent of all tobacco excise taxes.
Federal and state income taxes were calculated based on data from the CPS. Corporate income taxes were assumed to be borne partly by workers and partly by owners; the distribution of these taxes was estimated according to the distribution of earnings and property income in the CPS.
CPS data generally underreport both benefits received and taxes paid somewhat. Consequently, both benefits and tax data from the CPS had to be adjusted for underreporting. The key assumption in this adjustment process was that households headed by immigrants without a high school diploma (low-skill immigrant households) and the general population underreport benefits and taxes to a similar degree. Thus, if food stamp benefits were underreported by 10 percent in the CPS as a whole, then low-skill immigrant households were also assumed to underreport food stamp benefits by 10 percent. In the absence of data suggesting that low-skill and high-skill households underreport at different rates, this seemed to be a reasonable working assumption. The New Americans study of immigration by the National Academy of Sciences also adjusted for under-reporting in its fiscal analysis.
Estimating Taxes and Benefits for Illegal Immigrant Households
By most reports, there were some 11 million illegal immigrants in the U.S. in 2004. [9] About 9.3 million of these individuals were adults.[10] Roughly 50 to 60 percent of these illegal adult immigrants lacked a high school degree.[11] About ninety percent of illegal immigrants are reported in the CPS.[12] This testimony covers only those illegal immigrants reported in the CPS and does not address the remaining ten percent not counted by Census.
Of the 4.5 million low-skill immigrant households analyzed in this report an estimated 41 percent were headed by illegal immigrants.[13] Households headed by illegal immigrants differ from other immigrant households in certain key respects. Illegal immigrants themselves are not eligible for means-tested welfare benefits, but illegal immigrant households do contain some 3 million children who were born inside the U.S. to illegal immigrant parents; these children are U.S. citizens and are eligible for and do receive means-tested welfare.
Most of the tax and benefits estimates presented in this paper are unaffected by a low-skill immigrant household's legal status. For example, children in illegal immigrant households are eligible for, and do receive, public education. Similarly, nearly all the data on direct and means-tested government benefits in the CPS is based on a household's self report concerning receipt of each benefit by family members. Because eligibility for some benefits is limited for illegal immigrants, illegal immigrants will report lower benefit receipt in the CPS, thus, in most cases, this analysis automatically adjusts for the lower use of government and benefits by illegal immigrants.
In a few isolated cases, the CPS data does not rely on a households' self-report of receipt of benefits but imputes receipt to all households who are apparently eligible based on income level. The most notable example of this practice is the Earned Income tax Credit. Since illegal immigrant households are not eligible for the EITC, the CPS procedure assigns EITC benefits to illegal immigrant households which have not, in fact, been received by those households. To compensate for this mis-allocation of benefits, my analysis reduces the EITC benefits received by low-skill immigrant households by the portion of those households which are estimated to be illegal (roughly 40 percent).
Similarly, the CPS assumes all laborers work "on the books" and pay taxes owed. CPS therefore imputes federal and state income taxes and FICA taxes based on household earnings. But most analyses assume that some 45 percent of illegal immigrants work "off the books", paying neither individual income nor FICA taxes. [14] The present analysis adjusts the estimated income and FICA taxes paid by low-skill immigrant households downward slightly to adjust for the "off the books" labor of low-skill illegal immigrants.
The Net Retirement Costs of Amnesty to Illegal Immigrants
Giving amnesty to illegal immigrants would increase the costs outlined in this testimony. Some 50 to 60 percent of illegal immigrants lack a high school degree. Granting amnesty or conditional amnesty to illegal immigrants would, overtime, increase their use of means-tested welfare, Social Security and Medicare. Fiscal costs would go up significantly in the short term but would go up dramatically after the amnesty recipient reached retirement. Based on my current research, I estimate that if all the current adult illegal immigrants in the U.S. were granted amnesty the net retirement costs to government (benefits minus taxes) could be over $2.5 trillion.
The calculation of this figure is as follows. In March 2006, there were 9.3 million adult illegal immigrants in the U.S. Most illegal immigrants are low-skill. On average, each elderly low-skill immigrant creates a net cost (benefits minus taxes) for the taxpayer of about $17,000 per year. (This includes federal state and local government costs.) If the government gave amnesty to 9.3 million illegal immigrants, most of them would eventually become eligible for Social Security and Medicare benefits or Supplemental Security Income and Medicaid benefits.
However, not all of the 9.3 million adults given amnesty would survive till age 67. Normal mortality rates would probably reduce the population by roughly 15 percent before age 67. That would mean 7.9 million individuals would reach 67 and enter retirement.
Of those reaching 67, the average life expectancy would be around 18 years. The net governmental cost (benefits minus taxes) of these elderly individuals would be around $17,000 per year. Over eighteen years of expected life, costs would equal $306,000 per elderly amnesty recipient. A cost of $306,000 per amnesty recipient times 7.9 million amnesty recipients would be $2.4 trillion. These costs would hit the U.S. taxpayer at exactly the point that the Social Security system is expected to go into crisis.
This is a preliminary estimate based on my ongoing research. More research should be performed, but I believe policy makers should examine these potential costs carefully before rushing to grant amnesty, "Z visas" or "earned citizenship" to the current illegal immigrant population.
Amnesty proponents may argue that some of these individuals will go home without getting benefits, or before they reach retirement age. Though perhaps valid, that argument only emphasizes how expensive amnesty recipients would be; the longer they remain in the country the greater the cost to the taxpayer.
Potential Economic Gains and Losses from Low Skill Immigration
While the fiscal consequences of low skill immigration are strongly negative, it is possible that low skill immigrants create economic benefits that partially compensate for the net tax burdens they create. For example, it is frequently argued that low skill immigration is beneficial because low skill immigrants expand the economy of gross domestic product (GDP). While it is obviously true that low skill immigrants enlarge the GDP, the problem with this argument is that the immigrants themselves capture most of the gain from expanded production in their own wages. Metaphorically, while low skill immigrants make the American economic pie larger, they themselves consume most of the pie slice their labor adds.
This dilemma can be illustrated with the following example. Imagine a factory employing ten workers. One day, an eleventh worker is added and factory output goes up by 10 percent. The increase in factory output (equivalent to growth in GDP) appears quite beneficial, but from the perspective of the original ten factory workers, the relevant question is whether that extra output caused their wages to rise. The answer is probably no, in fact, in some circumstances their wages may fall. Merely adding extra workers to a factory or an economy does not magically cause the incomes of previous workers to go up.
If simply adding laborers to an economy would automatically raise everyone's standard of living within the economy, economic development would be a remarkably easy task. The nations with the fastest population growth would soon have the most affluent citizens. Unfortunately, high quality economic growth (economic growth that raises overall living standards) is far more difficult to achieve. Adding more laborers does not automatically increase the standard of living of the existing citizenry; to raise living standards it is necessary to raise the output of the average worker.
The central issue in the debate over the costs and benefits of low skill immigration is not whether such immigration makes the U.S. GDP larger (clearly it does), but whether low skill immigration raises the post tax income of the average non-immigrant American. Given the very large net tax burden that low skill immigrants impose on U.S. society, such immigrants would have to raise the incomes of non-immigrants to a remarkable degree to have a net beneficial effect. But there is little evidence to suggest that low skill immigrants increase the incomes of non-immigrants. The National Academy of Sciences, for example, estimated that all immigration produces a net economic gain of only $1 to $10 billion per year; this gain is the result of a reduction in consumer prices that is driven be a decline in wages for low skill non-immigrant workers.
Conclusion
Understanding of the fiscal consequences of low skill immigration is impeded by a lack of understanding of the scope of government financial redistribution within U.S. society. It is a common misperception that the only individuals who are fiscally dependent (receiving more in benefits than they pay in taxes) are welfare recipients who perform little or no work, and that as long as an individual works regularly he must be a net tax producer (paying more in taxes than his family receives in benefits).
In reality, the present welfare system is designed primarily to provide financial support to low income working families; moreover, welfare is only a modest part of the overall system of financial redistribution operated by the government. Current government policies provide extensive free or heavily subsidized aid to low skill families (both immigrant and non-immigrant) through welfare, Social Security, Medicare, public education and many other services. At the same time government requires these families to pay little in taxes. This very expensive assistance to the least advantaged American families has become accepted as our mutual responsibility for one another, but it is fiscally unsustainable to apply this system of lavish income redistribution to an inflow of millions of poorly educated immigrants.
It is sometimes argued that since higher-skill immigrants are a net fiscal plus for the U.S. taxpayers while low-skill immigrants are a net loss, the two cancel each other out and therefore no problem exists. This is like a stock broker advising a client to buy two stocks, one which will make money and another that will lose money. Obviously, it would be better to purchase only the stock that will be profitable and avoid the money losing stock entirely. Similarly, low-skill immigrants increase poverty in the U.S. and impose a burden on taxpayers that should be avoided.
Current immigration practices, both legal and illegal, operate like a system of trans-national welfare outreach bringing millions of fiscally dependent individuals into the U.S. This policy needs to be changed. U.S. immigration policy should encourage high-skill immigration and strictly limit low-skill immigration. In general, government policy should limit immigration to those who will be net fiscal contributors, avoiding those who will increase poverty and impose new costs on overburdened U.S. taxpayers.
Recent proposed legislation in the Senate and House will do exactly the opposite. By granting amnesty to illegal immigrants (who are overwhelmingly low skilled) and creating massive new "guest worker" programs which would bring millions of additional low skill families into the nation, such legislation, if enacted, would impose massive costs on the U.S. taxpayer.
The Heritage Foundation is a public policy, research, and educational organization recognized as exempt under section 501(c)(3) of the Internal Revenue Code. It is privately supported and receives no funds from any government at any level, nor does it perform any government or other contract work.
The Heritage Foundation is the most broadly supported think tank in the United States. During 2013, it had nearly 600,000 individual, foundation, and corporate supporters representing every state in the U.S. Its 2013 income came from the following sources:
Individuals 80%
Foundations 17%
Corporations 3%
The top five corporate givers provided The Heritage Foundation with 2% of its 2013 income. The Heritage Foundation’s books are audited annually by the national accounting firm of McGladrey, LLP.
Members of The Heritage Foundation staff testify as individuals discussing their own independent research. The views expressed are their own and do not reflect an institutional position for The Heritage Foundation or its board of trustees.
Endnotes
[1] Congressional Research Service, Cash and Noncash Benefits for Persons with Limited Income: Eligibility Rules, Recipient and Expenditure Data, FY2002-FY 2004, March 27, 2006. The value of Medicaid benefits is usually counted in a manner similar to Medicare benefits. Government does not attempt to itemize the specific medical services given to an individual; instead, it computes an average per capita cost of services to individuals in different beneficiary categories such as children, elderly persons, and disabled adults. (The average per capita cost for a particular group is determined by dividing the total expenditures on the group by the total number of beneficiaries in the group.)
[2] This spending figure excludes means-tested veterans programs and most means-tested education programs.
[3] National Research Council, The New Americans: Economic, Demographic, and Fiscal Effects of Immigration,National Academy Press, Washington, D.C., 1997, p.303
[4] Jeffrey S. Passel, The Size and Characteristics of the Unauthorized Migrant Population in the U.S.: Estimates Based on the March 2005 Current Population Survey, Pew Hispanic Center, March 7, 2006. See also Jeffrey S. Passel, Unauthorized Migrants: Numbers and Characteristics, Pew Hispanic Center, June 14, 2005. Steven S. Camarota, The High Cost of Cheap Labor: The Impact of Illegal Immigration on the Federal Budget, Center for Immigration Studies, August, 2004.
[5] George J. Borjas, Heaven's Door: Immigration Policy and the American Economy, Princeton New Jersey, Princeton University Press, 1999, p. 27.
[6] Ibid., p. 8
[7] Robert Rector, Christine Kim, Shanea Watkins, The Fiscal Cost of Low-Skill Households to the U.S. Taxpayer, Heritage Special Report, Sr-12, The Heritage Foundation, Washington, D.C. April 4, 2007.
[8] Robert Rector, The Fiscal Cost of Low-Skill Households to the U.S. Taxpayer, op. cit.
[9] Passel, 2005, op. cit., p. 2.
[10] Ibid., p 6.
[11] Passel, 2004, p.23
[12] Passel, 2004, p. 4.
[13] Information provided by Steven A. Camarota of the Center for Immigration Studies
[14] Randy Capp, Everett Henderson, Jeffry S. Passel, and Michael Fix, Civic contributions Taxes Paid by Immigrant in the Washington, DC Metro Area ,The Urban Institute, May 2006, footnote 3 on page 6.
/static/reportimages/1FD860F5F360109EDF6918B1D56EAFB8.pdf; Jeffrey S. Passel, Rebecca L. Clark, Immigrants in New York: Their Legal Status, Income and Taxes, Urban Institute, 1998, http://www.urban.org/publications/407432.html. Steve Camarota, The High Cost of Low Skill Labor, Center for Immigration Studies, op.cit.