The Congressional Budget Office (CBO) has released its periodic report on the distribution of household income and federal taxes, extending the data series on these figures from 2012 to 2013.[1] This latest edition of the CBO report shows how the enactment of the American Taxpayer Relief Act of 2012 (ATRA) and its accompanying tax increases affected taxpayer bills and behavior during 2012–2013.
Tax Increases in the American Taxpayer Relief Act of 2012
On January 1, 2013, Congress and the President passed the American Taxpayer Relief Act of 2012, which extended an array of 2001 and 2003 tax cuts[2] while allowing several of the tax reductions (mostly for higher income earners) in those laws to expire.[3]
ATRA had the following effects:
- Reverted the top income tax rate back to its pre-2001 level of 39.6 percent from 35 percent, before accounting for payroll taxes and Obamacare surtaxes (which did not exist when the 2001 tax cuts were enacted);
- Revived the personal exemption phase out (PEP) and itemized deduction phase out (Pease) for high earners;
- Increased the tax rate on capital gains and dividends from 15 percent to 23.8 percent, an almost 60 percent increase in the tax rate on income from investments.
- Increased taxes by more than $600 billion over 10 years relative to prior tax policy.[4]
In addition, ATRA allowed the payroll tax holiday to expire. The holiday, which emerged as an alternative to the Make Work Pay Credit in the 2009 stimulus, had included a 2 percentage point reduction of workers’ Social Security payroll tax rate since 2011. The holiday raised taxes by $1.6 trillion over 10 years—an increase that primarily affected middle- and low-income families.
Widespread Impact from 2013 Tax Increases
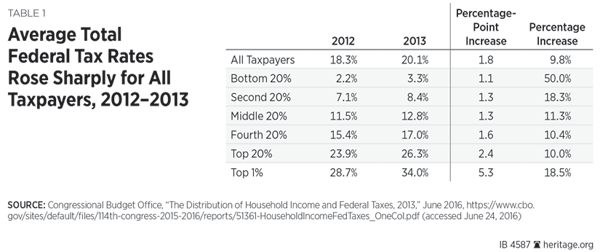
The CBO data reveal the changes brought about by ATRA’s tax hikes. The data show that the total average federal tax rate for all Americans rose from 18.3 percent in 2012 to 20.1 percent in 2013, a 10 percent increase.
All income groups felt the pinch brought on by these increases, as indicated by the changes in effective tax rates.
- The effective tax rate for the bottom 20 percent of income earners increased from 2.2 percent to 3.3 percent, a 50 percent increase.
- The effective tax rate of the top 1 percent had the largest increase (as measured by a percentage point change). It increased from 28.7 percent to 34 percent, an 18 percent increase.
ATRA Tax Hikes Increased Before-Tax Incomes in 2012
According to the CBO report, ATRA tax increases likely caused changes in taxpayer behavior, especially in higher income groups. Expectation of lower taxes caused many taxpayers to shift income into 2012 and reduce work effort and investment in 2013.
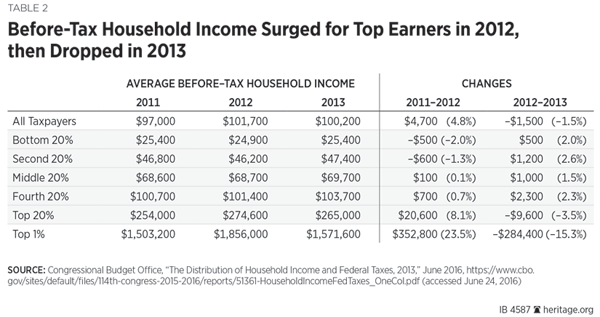
From 2011–2012, before-tax incomes increased by an average of $4,700, nearly 5 percent. However, the top 20 percent of income earners saw incomes increase by $20,600, over 8 percent. The top 1 percent of income earners saw incomes increase by about $353,000, or almost 24 percent.
From 2012 to 2013, before-tax incomes decreased by an average of $1,500, a 1.5 percent decrease. Before-tax income for the 20 percent of earners decreased by $9,600 or 3.5 percent. For the top 1 percent of earners, before-tax income decreased by more than $284,000, over 15 percent.
Tax increases are the likely culprit in these large fluctuations in incomes for high earners. Earners with higher income can change the timing and composition of their income more easily than those with lower incomes, hence the fluctuation in income among high earners compared to low earners.
For instance, earners with higher incomes tend to earn a larger percentage of their income from investments through capital gains and dividends. Such income allows for more control over when income is received compared to labor income. High-income earners can determine when it is most advantageous for them to realize capital gains they have accrued and sell an asset. Indeed, some high-income earners have the power to influence when businesses pay dividends and the size of those dividends.
Because of the 60 percent hike in the capital gains and dividends income that was looming in 2013, high earners likely realized more capital gains and dividend income in 2012 than was normal, accounting for the increase in their incomes in 2012 and for the decrease in 2013.
In addition, the reduction of income was likely caused, in part, by high earners working and investing less. The ATRA tax increases raised marginal effective tax rates substantially for high earners, making work and investment less appealing. Similar to how high-earners can alter their investment income, they can also alter their labor income more easily than those with lower incomes, by:
- Working less,
- Taking income in less-taxed forms like employer-provided health insurance or other fringe benefits, or
- Taking income as business-ownership income rather than labor income.
Less work results in reduced income across the economy, and less investment results in reduced growth in productive capacity. Both factors hurt Americans at all income levels. More research and data will be necessary to definitely prove it was the tax hikes that caused income reductions, but the CBO data strongly point to it being a factor.
Raising Taxes on the Rich Fails to Reduce Income Inequality
Raising taxes on the rich is a popular policy for those seeking to reduce income inequality. However, the shares of federal taxes paid by the various income groups shows that increased taxes for the rich have little effect on income equality.
The Top 20 Percent.
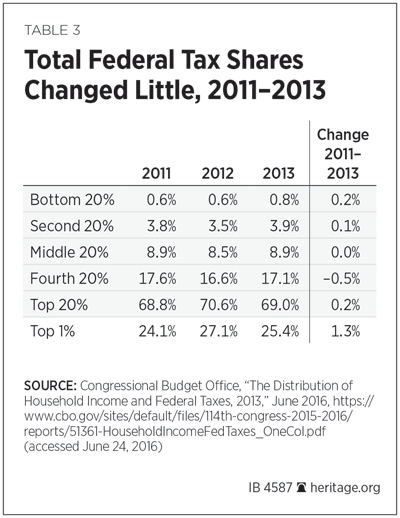
- In 2011, the top 20 percent of income earners paid 68.8 percent of all federal taxes.
- In 2012 the top 20 percent of income earners paid 70.6 percent of all federal taxes.
- In 2013, the top 20 percent of income earners paid 69 percent of all federal taxes, close to what they paid in 2011 before the tax hikes.
The Top 1 Percent.
- In 2011, the top 1 percent of income earners paid 24.1 percent of all federal taxes.
- In 2012, the top 1 percent of income earners paid 27 percent of all federal taxes.
- In 2013, the top 1 percent of income earners paid 25.4 percent of all federal taxes, not much more than before taxes rose.
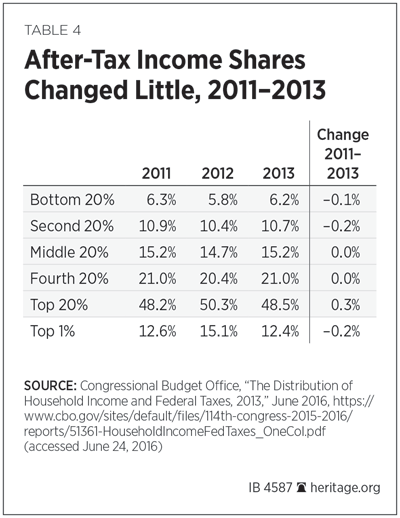
The surge in 2012 and the return to norm in 2013 is likely attributable to income shifting and changes in working and investment. The shares of after-tax incomes changed little as well.
The Top 1 Percent.
- In 2011, the top 1 percent earned 12.6 percent of after-tax income.
- In 2012, the top 1 percent earned 15.1 percent of after-tax income (likely as a result of the group shifting income to avoid higher rates in future years).
- In 2013, following shifting and reduction in work and investments, the top 1 percent earned 12.4 percent of after-tax income, only marginally less than they earned in 2011.
Lower Income Groups.
- From 2011 to 2013, the after-tax shares of the bottom 20 percent and the next 20 percent fell slightly.
- From 2011 to 2013, the middle 20 percent and the fourth 20 percent saw no change in their after-tax shares.
- The before-tax income shares showed similarly little movement between 2011 and 2013.
Data Show that Taxes Matter
The changes in the CBO income and tax data from 2011 through 2013 demonstrate that taxes matter because they change the behaviors of taxpayers. When taxes increase, taxpayers react in predictable ways that slow economic growth. This contradicts those in Congress who claim we can raise taxes with little economic impact.
Policymakers on the left and right are clearly aware that taxes change behaviors: They seek to raise taxes on cigarettes to curb smoking, on oil and gas to reduce their use, and on carbon to cut emissions. These positions are all consistent with the fact that taxes raise relative prices and affect behavior, but when it comes to taxes on income and production, these same policymakers seem unable to make the connection.
The CBO data show that those who bore the brunt of ATRA tax hikes in 2013, high earners, changed their behavior significantly in ways that probably reduced the size of the economy, mainly by reducing their work effort and cutting back on investments.
President Obama did not end his tax agenda after the 2013 tax hikes. If the next President follows his example and continues to raise taxes, all Americans will feel the adverse effects. High earners will shift their incomes to reduce the impact of the tax hikes and reduce their productive activities in ways that will reduce the size of the economy and hurt earners and taxpayers at all income levels.
—Curtis S. Dubay is Research Fellow in Tax and Economic Policy in the Thomas A. Roe Institute for Economic Policy Studies, of the Institute for Economic Freedom and Opportunity, at The Heritage Foundation.


