
The most widely accepted measure of hunger is the very low food security (VLFS) measure within the USDA’s annual household food security survey. According to the USDA, in households with VLFS, the “eating patterns of one or more household members were disrupted and their food intake reduced, at least some time during the year, because they couldn’t afford enough food.” At times, these households worried that food would run out, ate unbalanced meals, and relied on cheaper foods. In addition, adults usually cut back the size of their meals or skipped meals to save money. In a majority of these households, adults reported feeling hungry at times but not eating due to a lack of food.
Very low food security is almost always an intermittent and episodic problem for families rather than a chronic condition. In the United States in a typical month in 2013:
- One adult in 30 experienced very low food security.
- One adult in 35 was hungry for at least one day because there was not enough money for food in the household.
- One adult in 100 did not eat for a whole day because of a lack of money for food.
Children rarely experience hunger or very low food security as individuals. Faced by food constraints, parents will normally cut back their own food intake or go without eating in order to ensure that their children continue to have a stable food supply. In the typical month in 2013:
- One child in 165 experienced very low food security.
- One child in 125 went hungry for at least one day because of a lack of money for food.
- One child in 250 skipped at least one meal due to a lack of food resources.
- One child in 1,000 did not eat for an entire day because there was not enough money for food.
Overall, very low food security occurs predominantly among non-elderly adults. In 2013, only 4 percent of individuals with VLFS were children; 7 percent were elderly. Nearly nine out of 10 (89 percent) of persons experiencing VLFS were non-elderly adults.
Food insecurity has only a modest impact on diet quality. The average diets of VLFS adults and fully food-secure adults are the same in caloric intake, energy density, saturated fat, sodium, and macro-nutrients. Measured by the government’s Healthy Eating Index, adults with very low food security score an average of 1.8 points below fully food-secure adults on a scale of 0 to 100.
Contrary to conventional wisdom, healthy foods are not more expensive than unhealthy foods. In particular, junk foods are not a cheap source of food energy. According to a recent study from the USDA, “When measured on the basis of edible weight or average portion size, grains, vegetables, fruit, and dairy foods are less expensive than most protein foods and [unhealthy] foods high in saturated fat, added sugars, and/or sodium.” In many cases, an increase in consumption of grains, beans, fruits, and vegetables and a decrease in consumption of fast and convenience foods high in saturated fat, sugar, and salt would actually lower diet costs while improving quality.
Food banks, which provide free food to low-income persons, can play a strong role in reducing hunger. Surprisingly, only a third of VLFS households report using food banks to obtain extra food. Nearly two-thirds report that they do not have access to a food bank. This is perplexing, since there are over 30,000 food banks and food pantries nationwide. That amounts to one food bank for every general zip code in the country, or 10 for each county.
Most poor families should have access to food banks in their area. Three-quarters of poor household own cars; others are likely to have relatives and friends with cars, raising the possibility of pooled trips to obtain free food. Finally, urban food banks are likely to be located near public transit routes. It is possible that many of these households have food banks nearby but are unaware of them. If this is so, then VLFS problems could be reduced by having Supplemental Nutrition Assistance Program (SNAP) offices provide clearer information on the location and availability of food banks in the area.
Treating food security as a stand-alone nutrition issue, independent of the behaviors that cause it, will lead to unwise public policy. Regrettably, most discussions of hunger simply ignore the behaviors that strongly contribute to the problem.
Costly and inefficient food expenditures are a major factor. Households with very low food security spend a quarter of their food dollars in fast food restaurants and vending machines. Contrary to conventional wisdom, fast food is a very expensive food source. Adults with VLFS also drink nearly two cans of soda per day. Given this unhealthy and wasteful spending, it should be no great surprise if these individuals run short of money for food toward the end of the month.
Smoking is another major factor contributing to hunger or very low food security in the U.S. Over 40 percent of adults with VLFS regularly smoke cigarettes. Consuming an average of 19 packs of cigarettes per month, these individuals spend an estimated $112 each month on tobacco. For these individuals, spending on cigarettes equals nearly two-thirds of the expected food costs for low-income persons. Since money spent on cigarettes cannot be spent on food, regular smoking in many cases leads directly to very low food security and hunger.
The best way to reduce intermittent hunger among VLFS households would be through modest alterations in their food purchasing and consumption habits. Food assistance programs should make clear that low-income households can reduce food insecurity by purchasing food more healthfully and efficiently and allocating food consumption more evenly throughout a month.
Households at risk of VLFS should reduce expenditures on fast food, junk food, and convenience foods and increase expenditures on non-fattening traditional staple foods that are low in salt and saturated fat but provide high levels of food energy per dollar of expenditure. These households also should be encouraged to stockpile inexpensive, healthy, non-perishable foods to protect against intermittent food shortages and hunger. These emergency stockpiles would be called on if normal foods begin to run short at the end of a month.
These strategies have a strong potential to reduce very low food security.
Reducing Hunger and Very Low Food Security
There are frequent claims of widespread hunger in the United States. The U.S. Department of Agriculture (USDA) has defined hunger as “the uneasy or painful sensation caused by a lack of food.”[1] Hunger is a temporary sensation of discomfort; it is very different from and less severe than malnutrition.
For 20 years, the U.S. Department of Agriculture has conducted a “household food security” survey that provides most of the data on hunger in the U.S. The survey is a complex measurement system that categorizes individuals according to food choices, food intakes and shortages, and budget constraints.
Between 1995 and 2005, the survey included a measurement category called “low food security with hunger.” In 2006, the USDA dropped this term because the category failed to match physiological hunger, and many individuals in the group reported that they did not feel “hungry” at any time during the survey year. The USDA renamed the category “very low food security” (VLFS).[2] This change notwithstanding, the “very low food security” category does provide a useful, rough approximation of “hunger” in the U.S., with the caveat that, as noted, over a quarter of the individuals included in this group report that they did not experience hunger at any time in the prior year.[3]
According to the USDA, in households with very low food security, the “eating patterns of one or more household members were disrupted and their food intake reduced, at least some time during the year, because they couldn’t afford enough food.”[4] At times, these households worried that food would run out, ate unbalanced meals, and relied on cheaper foods. In addition, adults usually cut back on the size of their meals or skipped meals to save money. In a majority of these households, adults reported feeling hungry at times but not eating due to a lack of food.[5]
Very low food security is almost always an intermittent and episodic problem for families rather than a chronic condition. The average family with very low food security experienced disrupted food intakes in seven months of the year for one to seven days per month.[6]
In the United States in a typical month in 2013:
- One adult in 30 experienced very low food security.
- One adult in 35 was hungry for at least one day because there was not enough money for food in the household.
- One adult in 100 did not eat for a whole day because of a lack of money for food.
Very Low Food Security in Households with Children
Children who reside in a VLSF home are almost always shielded from food shortages affecting the rest of the family. Of the nearly 5 million children residing in low-income VLFS homes in 2013, only 570,000 or 12 percent experienced VLFS as individuals. A disparity in frequency of VLFS between parents and children occurs because when facing food constraints, parents will normally cut back their own food intake or go without eating in order to ensure that their children continue to have a stable food supply.[7]
In the typical month:
- One child in 165 experienced very low food security.
- One child in 125 went hungry for at least one day because of a lack of money for food.
- One child in 250 skipped at least one meal due to a lack of food resources.
- One child in 1,000 did not eat for an entire day because there was not enough money for food.[8]
Overall Demography of Very Low Food Security
Very low food security occurs predominantly among non-elderly adults. It is comparatively infrequent among children and the elderly.
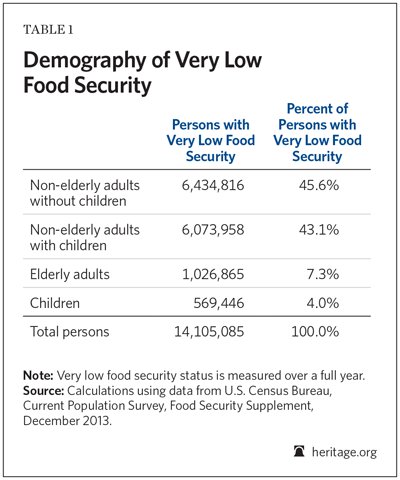
Table 1 shows annual VLFS status for individuals in 2013. Only 4 percent of individuals with VLFS were children; 7 percent were elderly. Nearly nine out of 10 (89 percent) persons experiencing VLFS were non-elderly adults. These non-elderly adults with VLFS split almost equally into two groups: parents with children and non-parents.[9]
Going Without Food
Very low food security is a recurring, not a chronic, condition. The problems of food constraints and supply disruption typically occur in the same households repeatedly. The average VLFS household will experience food constraints and shortages in six months out of the year.
A household that experiences very low food security during a month will typically run short of food toward the end of the month. About 70 percent of adults in these households will report feeling hungry during that month. When adult hunger does occur, on average, it will occur for seven days during the month. At the extreme, around one-quarter of adults in VLFS households will report not eating for a whole day because “there was not enough money for food.”[10]
For Americans to go without food for an entire day represents a social problem, but it is a problem that is limited in scope, and it requires a well-informed policy response. For one thing, the pattern of adults going without eating is difficult to understand. It is far less expensive simply to stave off hunger and fill an empty stomach than it is to provide a long-term fully balanced diet. In fact, filling a stomach is quite cheap; 1,000 calories of rice, purchased in bulk, costs only 30 cents. In a pinch, an adult can fill his stomach and meet all his daily calorie needs with healthful but inexpensive foods for a dollar a day. (Clearly, this sum would not provide a balanced long-term diet, but it would block any short-term discomfort from hunger.)
The median VLFS household spends $5 per day per person on food. The fact that roughly a third of VLFS adults may run out of food entirely for four days per month seems to be driven at least as much by the types of food purchased and the allocation of food during the month as it is by total food spending. Behavioral issues concerning tobacco use also play a considerable role.
Differences in Diet Quality
Closely related to household food security among the poor is the issue of diet quality. One important measure of diet quality is the USDA Healthy Eating Index.[11] The 2005 version of the index (HEI-2005) measures the intake of nine healthy food groups and three unhealthy (or moderation) food groups. The healthy groups are total fruit (including juice); whole fruit (excluding juice); total vegetables; dark green and orange vegetables and legumes; total grains; whole grains; milk and milk products; meat and beans; and oils. The unhealthy (or moderation) categories include saturated fat (above 7 percent of total calories); sodium (above 0.7 grams per 1,000 calories); and SoFAAS (solid fats, alcoholic beverages, and added sugars) above 20 percent of total calories.
The HEI-2005 ranks diets on a scale of 0 to 100. An individual would score 100 if he consumed the recommended amount or more of foods from all nine healthy food groups and did not exceed the limits for saturated fat, sodium, and SOFAAS consumption. An individual would receive a score of zero if he did not consume any food from the nine healthy groups and greatly exceeded the limits on the unhealthy groups.
The entire U.S. population can be ranked by HEI-2005. This results in a bell curve distribution. In 2001, the median individual (50th percentile of the population) had a score of 49.3. The 20th percentile scored 37.9, while the 80th percentile scored 62.6. Throughout most of the distribution, an increase of one point in the HEI-2005 score would increase an individual’s percentile rank by about 2 percentage points relative to the rest of the population.[12]
Eating one extra apple, one banana, or one cup of green vegetables per day would raise an individual’s HEI score by five points. Conversely, drinking one additional 12-ounce can of regular soda per day above the SoFAAS limit would generally lower the score by four points.[13] Overall, one point on the HEI-2005 scale is roughly equivalent to an increased daily consumption of one-fifth of an apple or banana or one-fifth of a cup of green or orange vegetables relative to total consumption.[14] Conversely, consuming one-quarter of a 12-ounce can of soda (above the SoFAAS calorie limit) would cause a one-point drop in the daily HEI-2005 score.[15]
Diet Quality and Household Income
There is a widespread perception that lower-income households have far less healthy diets than middle-class households. A corollary belief is that diet quality improves sharply as household income rises. According to this view, income constraints force poor and low-income households to purchase cheap, unhealthy foods; as income rises, the poor are able and expected to substitute healthy for unhealthy foods.
In reality, this perception is inaccurate. Average diet quality is quite uniform over a very wide income range.[16] Table 2, using data from the National Health and Nutrition Examination Survey (NHANES) for 2003–2004, shows the average HEI-2005 scores for various demographic groups at different income levels. Income is measured as a percent of the federal poverty level (FPL). In 2014, the annual FPL was $12,316 for a one-person household, $16,317 for a two-person household, $19,073 for a three-person household, and $24,008 for a four-person household.
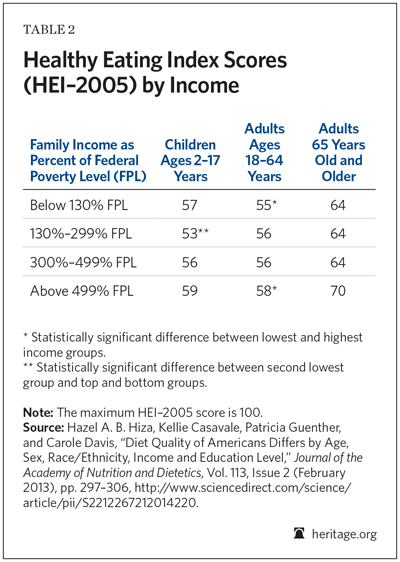
The table shows that HEI-2005 scores change very little as income rises. Lower-income children (family income below 130 percent FPL) actually have higher HEI-2005 scores than middle-income children (family incomes between 130 percent and 499 percent of FPL). Lower-income children actually consume more vegetables and fewer SoFAAS than higher-income children consume.
Non-elderly adults show little variation in average diet as income rises through most of the range. Lower-income, non-elderly adults have a mean HEI-2005 score of 55, one point less than the average for all non-elderly adults. Statistically significant differences in average diet do not appear among non-elderly adults until family income rises above 499 percent of FPL (roughly $80,000 in annual income for a two-person family). Even at that high-income level, the difference is only a modest three points on the 100-point HEI scale.
Low-income elderly persons have better-quality average diets than most affluent children and non-elderly adults have. The average diets of elderly Americans show little variation across most of the income range; average diet quality again remains uniform until incomes rise above 499 percent of FPL.
To summarize the data in Table 2, in most cases, household income can be doubled or even tripled without a significant impact on average diet quality. Health specialists may lament deficiencies in lower-income diets, but similar deficiencies occur among most Americans at all incomes, including members of the upper middle class. The main problem is that people enjoy eating palatable foods that are usually high in sugar, salt, or fat. The pursuit of palatability leads to overconsumption of calories, sodium, saturated fat, and SoFAAS. Simply raising income has at best a minimal effect on these pervasive food preferences. For example, the very affluent have the highest intakes of SoFAAS.
Relationship of Increased Food Expenditures to Diet Quality
Even though diet quality changes little across much of the income range, it is possible that increases in income and food spending among very low-income households could lead to substantial improvements in diet quality. To examine this issue, the USDA contracted for a large-scale study from Mathematica Policy Research, Inc.[17] The study examined whether increased food expenditures among SNAP (food stamp) recipients was linked to better diets. As the authors state:
Since SNAP is believed to work primarily through increasing food expenditures, a critical link to its success depends on whether greater food expenditures lead to greater nutritional quality in people’s diets…. [T]he goal of this study is to identify whether spending more money on food leads SNAP participants and, more generally, other low income households and individuals, to purchase and consume foods that are more nutritious…. The desired outcome for [overall food] spending would be an increase in spending on foods recommended for frequent consumption and a decrease in spending on foods not recommended for frequent consumption.[18]
However, the study found that a significant increase in food spending among SNAP recipients led to only a miniscule improvement in diets. Specifically, a 10 percent increase in food expenditures (equivalent to roughly $30 per month) led to an increase in the HEI-2005 score of only 0.17 point on a scale of 0 to 100.[19] An increase of 0.17 in the HEI-2005 score is equivalent to the added consumption of one-thirtieth of an apple or one-thirtieth of a cup of peas per day as a share of total food consumed. Thus, an increase in food expenditures of nearly $30 per month yielded an increase in healthy food consumption equivalent to one apple or one cup of green vegetables over the course of the whole month.
Care is needed in interpreting these data. One might infer that an extra $30 of food spending resulted in only one extra apple in healthy food, while the rest of the added funds went to unhealthy food. That would be inaccurate; instead, as food spending increased, expenditures on healthy and unhealthy foods increased in nearly equal proportions. There was only the slightest shift toward improvement in diet, an improvement equivalent to one apple per month.
Increasing food expenditures can be very expensive. For example, 46.5 million persons received monthly SNAP benefits in 2014. Increasing the value of SNAP benefits by $30 per month for all beneficiaries would cost an extra $1.4 billion per month, or $16.7 billion per year. The extra benefits would cause food expenditures on healthy and unhealthy foods to increase in roughly equal proportions, while the net shift toward healthier diets would be negligible. An added $16.7 billion in spending might improve diet among SNAP recipients by the equivalent of one cup of vegetables per month.
Moreover, the policy would be even less effective than it appears on the surface because a $30 per month increase in SNAP benefit levels would not necessarily result in a $30 increase in food expenditures. Most households receiving SNAP benefits also spend cash on food. Economic resources are fungible; an increase in SNAP benefits would generally lead to less cash spending on food.
As a general rule of thumb, low-income households spend around one-third of their income on food, so it might take an increase of $90 per month in total income to yield an increase of $30 per month in food spending. If this calculation is roughly accurate, an increase of nearly $50 billion in annual income among SNAP beneficiaries would be needed to shift their average HEI-2005 score 0.17 point, given current patterns of expenditure and food consumption.
Food Insecurity and Diet Quality
A similar story holds for the relationship between very low food security and diet quality. Contrary to conventional wisdom, food insecurity has only a modest impact on diet quality. The average diet of adults with very low food security appears to be remarkably similar to that of an average adult.[20] The average diets of VLFS adults and fully food-secure adults are the same in caloric intake, energy density, saturated fat, sodium, and macronutrients.
The average HEI-2005 score for VLFS adults is about 1.8 points below that of fully food-secure adults.[21] This difference is equivalent to consuming an extra two-fifths of an apple or two-fifths of a cup of green vegetables per day as a share of total food consumption.
Are Healthy Foods More Expensive?
Discussions of income and healthy diets are often confused by simplistic claims that healthy foods are more expensive than unhealthy foods. These claims usually compare foods by price per calorie. Healthy foods such as fruits and vegetables have few calories, and their price-to-calorie ratios are thus extremely high. Measured by price per calorie, vegetables such as lettuce, carrots, celery, and cucumbers are among the most expensive foods available—more expensive than steak.
As a recent USDA study shows, however, claiming that healthy foods are expensive on the basis of price per calorie is often misleading.[22] No sensible diet recommends maximizing caloric intake through fresh vegetables; such a diet would be wildly expensive and nearly inedible. In fact, it would be extremely difficult to consume enough fresh vegetables to meet normal caloric needs. For example, it would take 100 cups of broccoli per day to provide the 2,500 calories required by a normal adult male.
Instead of the misleading calories-per-dollar standard, government healthy diet guidelines (such as the food pyramid, MyPlate, and the Healthy Eating Index) recommend a specific number of servings of vegetables and fruits per day. Measured on this appropriate per-serving basis, fruits and vegetables are actually cheaper than unhealthy foods.[23] As the USDA study states: “When measured on the basis of edible weight or average portion size, grains, vegetables, fruit, and dairy foods are less expensive than most protein foods and [unhealthy] foods high in saturated fat, added sugars, and/or sodium.”[24]
In most cases, an increase in consumption of fruits and vegetables and a decrease in consumption of unhealthy foods high in SoFAAS would actually lower diet costs while improving quality.
Junk Foods Are Not Cheap
Advocates often claim that the poor are forced to eat unhealthy junk food to fill empty stomachs and maintain minimum caloric intake. This argument founders on the fact that, even by the limited measure of price per calorie, junk foods are not particularly cheap.
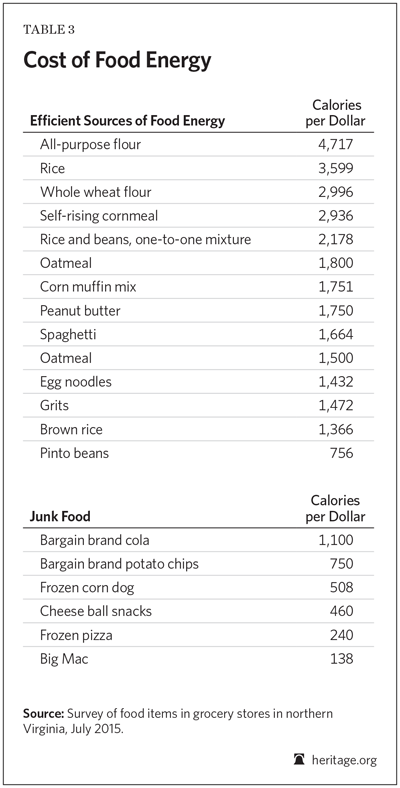
Table 3 shows the calories per dollar of cost for various foods. The foods that provide by far the most calories per dollar and thus the cheapest way to fill an empty stomach are flour, rice, cornmeal, and peanut butter. These foods could be called traditional staples; purchased in bulk, they can fulfill the caloric minimum for an adult for 50 cents to $1.50 per day. Throughout most of U.S. history, Americans relied heavily on this type of food.
Traditional staple foods can be a very cost-effective source of food energy for families who are trying to stretch their food dollars. They are far cheaper than junk food; corn muffin mix offers 1,700 calories per dollar; oatmeal, 1,500; rice and beans, 2,200; self-rising cornmeal, 2,900; rice, 3,600, and all-purpose flour, 4,700. By contrast, junk food is far more expensive. For example, bargain-brand cola offers 1,100 calories per dollar, potato chips provide around 750, cheese ball snacks offer 460, and frozen pizza provides 240.
The traditional staple foods are also comparatively healthy. In most cases, they are very low in saturated fat, sodium, and added sugars. It is important to emphasize that in isolation, these low-cost foods clearly do not provide a balanced diet. However, they are much healthier than most junk and convenience foods found in conventional diets. Food combinations such as beans and rice are very nutritious, providing both protein and calories at a very low price.
Finally, some argue that financial constraints force the poor to eat foods with high energy density. Energy density is measured by calories per gram of food. Energy-dense foods, in effect, have more calories per mouthful; this makes it easier to overeat and gain weight.[25] For example, it is easier to gain weight eating an energy-dense food such as chocolate than it is to gain weight eating a non-dense food such as apples.
Dietary expert Adam Drewnowski argues that money shortages force the poor to eat energy-dense foods and that this leads to weight gain, obesity, and health problems,[26] but this argument is again undermined by the simple fact that the cheapest foods, the traditional staples, actually have low to moderate energy density.[27] It is true that junk and convenience foods usually have high energy density, but the poor, like the public generally, usually eat these foods because they are palatable, not because they are allegedly a cheap source of calories. Overall, the diets of VLFS households do not have higher energy density than the diets of food-secure households have.[28]
Very Low Food Security and Efficient Use of Food Dollars
VLFS households do not appear to spend food dollars efficiently. These households disconcertingly report spending, on average, roughly one-quarter of their food expenditures in fast-food restaurants and vending machines.[29] This is an extremely inefficient use of scarce financial resources. For example, a nutritious meal of rice and beans cooked at home provides around 2,200 calories for each dollar of food spending; by contrast, a Big Mac provides 138 calories for each dollar spent, as well as a lot of unhealthy fat.
Many VLFS households also make unwise choices when purchasing food in grocery stores. Use of prepared, convenience, and snack foods appears to be common. On average, VLFS adults drink nearly two cans (22 ounces) of soft drinks per day.[30] Such eating patterns can lead to budgetary problems and food shortages at various times during a month. A clear pattern for many VLFS families is inefficient and unhealthy food expenditures at the beginning of the month followed by tight budgets and food shortfalls at the end of the month.
Low-income families place a very high priority on serving meat for dinner every day. A USDA-sponsored focus group survey of low-income mothers receiving food stamps (SNAP) reported the following:[31]
Cultural tradition and the preferences of family members influence food stamp participants to continue serving high-fat meat products and other traditional foods. Focus group members reported spending a large percentage of their food stamp allotment on meat, although meat often is high in cholesterol, high in fat, and expensive. These reports confirm a pattern found in the survey data that shows that low-income families devote just over one-third of their food expenditures to meat. Food stamp recipients in all ethnic groups emphasized the importance of serving meat as a part of dinner. They indicate that meat is essential for dinner, that it is the food they “grew up with,” and that it implies success and status.[32]
A heavy emphasis on eating meat raises diet costs and often leads to an excessive intake of saturated fat. Despite high costs, VLFS households tend to eat slightly more meat than food-secure households eat.[33]
Very Low Food Security and Food Banks
Food banks provide free food to low-income persons. Surprisingly, only a third of VLFS households report using food banks to obtain extra food.[34] Nearly two-thirds report that they do not have access to a food bank.[35]
This is surprising, since there are over 30,000 food banks and food pantries nationwide.[36] That amounts to one food bank for every general zip code in the country, or 10 for each county. The District of Columbia has at least 37 food banks and pantries; New York City has 163. North Dakota has 138, or nearly three for each county.[37]
Most poor families should have access to food banks in their area. Three-quarters of poor households own cars; others are likely to have relatives and friends with cars, raising the possibility of pooled trips to obtain free food. Finally, urban food banks are likely to be located near public transit routes.
The fact that the majority of VLFS families report that they have no access to food banks is perplexing and clearly calls for further research. It is possible that many of these households have food banks nearby but are unaware of them. If this is so, then VLFS problems could be reduced by having SNAP offices provide clearer information on the location and availability of food banks in the area.
However, SNAP and food-insecure households also report that they do not use food banks because they do not like the types and quality of food provided.[38] The prospect that low-income families actively turn down free food that is available adds complexity to food-insecurity issues.
Very Low Food Security and Cigarette Use[39]
Cigarette smoking is a major cause of very low food security. VLFS adults are much more likely to smoke than are food-secure adults, and money that is spent on cigarettes cannot be spent on food, adding pressures to the monthly food budget.
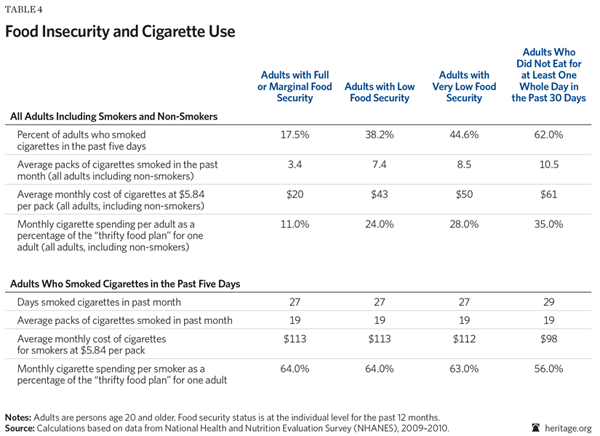
As Table 4 shows, nearly 45 percent of adults with VLFS during the year smoked cigarettes during the 30 days before the survey; by contrast, only 17.5 percent of food-secure adults smoked during that period. On average, VLFS adults (including smokers and non-smokers) consumed 8.5 packs of cigarettes per month. The average monthly cost was $50, or 28 percent of the USDA thrifty plan for food expenditures for a single adult.[40]
The nearly 45 percent of VLFS adults who smoked during the last month before the survey smoked almost every day, consuming around 19 packs of cigarettes during the month. The average cost of these cigarettes was around $112 per month, or 63 percent of the food costs for a single adult under the thrifty food plan. Smoking is clearly a predominant factor leading to very low food security among these individuals.
Nearly two-thirds (62 percent) of the adults, who reported they “did not eat” for at least one whole day during the last 30 days before the survey because “there was not enough money for food,” smoked cigarettes during the month. Those who smoked did so nearly every day; on average, they consumed around 17 packs of cigarettes during the month at an estimated cost of $98. The monthly cost of cigarettes for this group was equal to 56 percent of monthly food costs for a single adult on the thrifty food plan. Clearly, smoking is a major factor causing many of these individuals to run out of money for food on various days during the month.
Food Insecurity and Nutrition Education
The Expanded Food and Nutrition Education Program (EFNEP), run by the USDA, provides nutrition education to low-income individuals with the aim of improving diet quality. Each year, over a half-million low-income individuals are enrolled in the program.[41] Responses on pre- and post-program questionnaires suggest that the program modestly improves diet quality among participants.
One study of EFNEP in Tennessee examined the impact of the program on food expenditures and diet quality using a controlled quasi-experimental evaluation. Nutrition education was provided to a randomly selected group of women who were poor or receiving TANF (Temporary Assistance for Needy Families), SNAP, WIC (Women, Infants, and Children), or other welfare benefits. The evaluation compared low-income women who received nutrition education with a control group of similar women who did not participate.[42]
Compared to the control group, women in the intervention group reduced food expenditures by $10 to $20 per month while improving diet quality. The intervention group was also less likely to run out of food at the end of the month.[43] A similar study of the Food Stamp Nutrition Education program in Indiana, using experimental and control groups selected by random assignment, showed that a five-lesson nutrition education program produced modest but significant reductions in food insecurity among participants.[44]
One major problem with EFNEP is that the technology of instruction has not changed in 50 years. EFNEP generally uses individual instructors in small-group or one-on-one settings. This format greatly increases program costs and reduces the number of individuals who can be reached. Moreover, the quality of the instruction varies greatly according to the individual instructor.
In recent years, online interactive programs for instruction and behavioral change have become available in many fields. These programs seem to be able to promote increased knowledge and behavioral change at rates similar to traditional methods. Once developed, online, interactive teaching programs can be delivered at near-zero cost. Using this format, it is possible to deliver information in an appealing manner featuring dramatic skits and visual displays. The quality of instruction will be uniform, and programs can be tailored to specific ethnic, gender, and age groups. Refresher material, which is usually helpful in sustaining behavioral change, can be provided at little or no extra cost.
EFNEP should modernize, replacing its old small-group teaching format with new interactive programs.(This issue will be further discussed in the policy recommendation section below.)
How to Reduce Intermittent Hunger and Improve Diet Quality Within VLFS Households
The best mechanism by which to reduce intermittent hunger among VLFS households would be modest alteration of the food purchasing and consumption habits among potential VLFS households. Food assistance programs should encourage low-income households to purchase food more healthfully and efficiently and to allocate food consumption more evenly throughout a month.
Specifically, low-income households at risk of VLFS should be encouraged to take the following steps:
-
Reduce spending on fast food, junk food, and convenience foods and increase bulk purchases of healthy non-perishable staples. Households at risk of VLFS should be encouraged to reduce expenditures on fast food, junk food, and convenience foods and to increase expenditures on non-fattening traditional staple foods that are low in salt and saturated fat but provide high levels of food energy per dollar of expenditure. These households should be encouraged to make one or two major food shopping trips per month, purchasing healthy non-perishable food items in large bulk quantities.
Recommended foods for bulk purchase include flour, rice, cornmeal, oatmeal, dried beans, and peanut butter. These foods are healthier than junk and convenience foods. Critically, they provide the highest levels of food energy per dollar: —between 1,500 and 4,000 calories per dollar. If needed, an adult can obtain a full day’s worth of food energy from these foods for 50 cents to a dollar a day. These foods are by far the best tools for staving off intermittent hunger.
Again, it should be emphasized that these foods in isolation clearly do not provide a balanced diet. Poor households should not consume these foods exclusively or predominantly, but a marginal increase in consumption of these foods accompanied by a marginal reduction in the consumption of more expensive fast, junk, and convenience foods would improve the diet quality of many poor households and stretch scarce food dollars, Increased consumption of these foods can therefore reduce hunger by reducing temporary food shortages within households.
-
Purchase fewer convenience foods and more traditional staples even if the traditional foods require slightly more preparation. For example, quick breads (biscuits, muffins, corn bread, and scones) are a low-cost food that used to be a mainstay in many American homes. Quick breads use baking soda rather than yeast as the leavening. Simple to bake, quick breads can be prepared and served in as little as 30 minutes (hence the name “quick”). They can be refrigerated and used over several days. Quick breads are a remarkably cost-effective food, capable of providing full food energy for an adult for as little as 50 cents per day.
Another traditional meal is rice and beans. Low in fat and high in protein, the mixture can provide full food energy for an adult for just over a dollar per day.[45] Encouraging low-income families to eat one or more meals per week that substitute beans and rice for meat would improve diet quality while stretching the family food budget and thereby reducing the risk of food insecurity. True, traditional staple foods do require more preparation time than microwaveable foods, but if available preparation time is limited, they can be baked or cooked on the weekend, stored or refrigerated, and eaten during the week.
Some argue that VLFS adults have little spare time to prepare food.[46] In fact, the opposite is true. At any given time, only 40 percent of VLFS adults are employed, and those who are employed work an average of 34 hours per week.[47] Most VLFS adults clearly can devote additional time to food preparation. Another argument is that that poor households cannot cook because they lack kitchen facilities.[48] This too is inaccurate. Only 3 percent of poor households lack full kitchen facilities including a sink, refrigerator, oven, and range burners.[49]
Finally, it may be argued that traditional grain-based foods are fattening and will lead to an increase in obesity over time, but obesity is linked to increased energy density in a diet, and these simple grains have low energy density. Compared to individuals with high-energy-density diets, those with low-energy-density diets consume less fat and added sugar but substantially more grains.[50]
Most healthy eating guidelines support consumption of grains and beans. Encouraging low-income families to reduce consumption of meat, fast food, convenience, and junk foods and increase consumption of traditional staples such as quick breads and beans and rice would help those families stretch their food dollars while improving diet quality.
In recent years, the government’s dietary guidelines have encouraged Americans to dramatically increase whole-grain consumption so that whole grains and enriched or processed grains are eaten in equal amounts.[51] This would require a massive change in overall eating patterns in the U.S.; very few Americans in any income class come close to meeting this standard. Of course, low-cost staple meals can easily be prepared with whole grains using whole wheat flour rather than enriched flour and brown rice rather than white rice. The drawback is that whole grains are somewhat more expensive and often difficult to obtain in large bulk quantities. More important, policymakers must recognize that changing eating habits is difficult. Familiarity influences our food choices, and the more extreme the recommended change in diet is, the less likely it is to occur.
Again, this is not to suggest that these low-cost staples constitute an adequate ongoing diet. Rather, consumption of traditional staples should be increased somewhat, and consumption of junk and fast foods should be decreased. Many traditional staples are healthful and very cost effective; it is a shame that they are disappearing from low-income diets.
-
Stockpile inexpensive, healthy, non-perishable foods to protect against intermittent food shortages and hunger. These emergency stockpiles would be called on if normal foods begin to run short at the end of a month. Clearly, this emergency store would be designed for short-term use only and would not be intended to provide a long-term balanced diet.
The best foods to include in an emergency store are the traditional staples appearing in the top half of Table 3. These foods can fill empty stomachs and provide full food energy for an adult for $7 to $10 per week. A one-week emergency food store for a three-person family would thus cost $30 or less: about 7 percent of the median monthly food expenditures of a three-person VLFS household. In good circumstances, the emergency food supply would sit on the shelf unused; however, if misfortune occurred and need arose, it would be available to protect against food shortages and hunger.
Proposed Government Policies to Address Intermittent Hunger and Very Low Food Security
SNAP offices should provide clients with the following:
- Information on the cost effectiveness of various types of food and the importance of buying non-perishable staple food in bulk;
- Information on preparing traditional low-cost staple foods along with simple, appropriate recipes that, preferably, have low preparation times;
- Information on healthy low-cost foods;
- Information on food banks in the area; and
- Information stressing the importance of maintaining an emergency food supply to protect against temporary food shortages and the best types of food to include in the emergency store.
This information should be provided by brochures, DVDs, and interactive teaching programs. Materials should be designed for low-income families and tailored for specific ethnic groups, providing easy-to-prepare, healthy recipes that are most appropriate for each group.
Individuals applying for the SNAP programs should be required to complete an interactive course covering these subjects at the time of application and recertification. Additional materials should be given to SNAP recipients for use in the home. Similar materials should be distributed without charge through food banks.
The food items that can be purchased with SNAP benefits should be limited. SNAP benefits should not cover the purchase of junk food, particularly sugar-sweetened soft drinks. Since recipients use both SNAP and cash for food purchases, it is unclear to what degree this rule would actually limit their soft drink purchases, but it would send a clear and helpful message to recipients about healthy food choices.
Finally, the Temporary Food Assistance Program (TEFAP) should be redesigned to combat hunger and food shortfalls more effectively. TEFAP provides about one-sixth of the food distributed in food banks. The program is designed to provide low-income persons with a wide variety of moderately priced foods; it currently provides 900 different food items. TEFAP should be redesigned to serve as an anti-hunger program, providing families with the low-cost emergency food staples described above. By providing less expensive foods, TEFAP could greatly increase the number of meals provided and clients served.
USDA could also experiment with providing TEFAP emergency food supplies directly to families at SNAP offices. For example, at the time of SNAP application, the SNAP office could determine whether an applicant family had a history of VLFS. If the answer was yes, the office could supply the family with a stock of TEFAP emergency foods with instructions to save the food as a protection against future hunger.
Conclusion
Most discussions of hunger or “very low food security” ignore the behaviors that contribute to the problem. Costly and inefficient food expenditures are a major factor. Households with VLFS spend a quarter of their food dollars in fast food restaurants and vending machines. Adults with VLFS drink nearly two cans of soda per day. Such spending patterns help to explain why these individuals may run short of money for food toward the end of the month. Public policy should encourage at-risk individuals to purchase healthier, less costly foods and to allocate food spending evenly throughout the month.
Smoking is another major factor contributing to hunger or very low food security in the U.S. Some 45 percent of adults with VLFS regularly smoke cigarettes. Consuming 19 packs of cigarettes per month on average, these individuals spend an estimated $112 each month on tobacco. Since money spent on cigarettes cannot be spent on food, regular smoking in many cases leads directly to very low food security and hunger.
Simply calling for more generous government food benefits in these circumstances is clearly inappropriate. Treating food security as a stand-alone nutrition issue independent of the behaviors linked to it will only lead to unwise public policy.
Endnotes
[1] U.S. Department of Agriculture, Food and Consumer Service, Office of Analysis and Evaluation, Household Food Security in the United States in 1995: Summary Report of the Food Security Measurement Project, September 1997, p ii, http://www.fns.usda.gov/sites/default/files/SUMRPT.PDF (accessed February 5, 2016). Prepared for the Food and Nutrition Service by Abt Associates, Inc.
[2] In 2006, the USDA relabeled the categories “food insecure without hunger” and “food insecure with hunger,” respectively, as “low food security” and “very low food security.” The criteria by which households were classified remained unchanged. Mark Nord, Margaret Andrews, and Steven Carlson, Household Food Security in the United States, 2006, U.S. Department of Agriculture, Economic Research Service, Economic Research Report No. 49, November 2007, p. iv, http://www.ers.usda.gov/media/215286/err49_1_.pdf (accessed February 5, 2016).
[3] Some 31 percent of individuals in the VLFS category typically respond “no” to the following question: “In the last 12 months, were you ever hungry, but didn’t eat, because there wasn’t enough money for food?” Alisha Coleman-Jensen, Matthew P. Rabbitt, Christian Gregory, and Anita Singh, Household Food Security in the United States in 2014, U.S. Department of Agriculture, Economic Research Service, Economic Research Report No. 194, September 2015, p. 3, http://www.ers.usda.gov/media/1896841/err194.pdf (accessed February 5, 2016). In the household food security survey, very few individuals in the larger category of “low food security” report experiencing hunger. Similarly, these households report “few, if any, indications of reduced food intake.” Coleman-Jensen et al., Household Food Security in the United States in 2014, p. 4. Advocacy groups often refer to the low food security group as “at risk” of hunger because there is little indication of actual hunger within the group. See, for example, DoSomething.org, “14 Facts About Hunger in the US,” https://www.dosomething.org/facts/11-facts-about-hunger-us (accessed February 5, 2016).
[4] Mark Nord, Alisha Coleman-Jensen, Margaret Andrews, and Steven Carlson, Household Food Security in the United States, 2009, U.S. Department of Agriculture, Economic Research Service, Economic Research Report No. 108, November 2010, p. 5, http://www.ers.usda.gov/media/122550/err108_1_.pdf (accessed January 13, 2016).
[5] Ibid.
[6] Ibid., p. 9.
[7] Alisha Coleman-Jensen, Christian Gregory, and Arita Singh, Household Food Security in the United States in 2013: Statistical Supplement, U.S. Department of Agriculture, Economic Research Service, Administrative Publication No. 066, September 2014, p. 3, http://www.ers.usda.gov/media/1565530/ap066.pdf(accessed January 13, 2016).
[8] Calculations from U.S. Bureau of the Census, Current Population Survey, Food Security Supplement, December 2013.
[9] Ibid.
[10] Ibid.
[11] Patricia M. Guenther, Susan M. Krebs-Smith, Jill Reedy, Patricia Britten, Wen Yen Juan, Mark Lino, Andrea Carlson, Hazel A. Hiza, and P. Peter Basiotis, “Healthy Eating Index—2005,” U.S. Department of Agriculture, Center for Nutrition Policy and Promotion, CNPP Fact Sheet No. 1, December 2006, Slightly Revised June 2008, http://www.cnpp.usda.gov/sites/default/files/healthy_eating_index/healthyeatingindex2005factsheet.pdf.(accessed January 13, 2016).
[12] Patricia M. Guenther, Jill Reedy, Susan M. Krebs-Smith, Bryce B. Reeve, and P. Peter Basiotis, “Development and Evaluation of the Healthy Eating Index-2005: Technical Report,” U.S. Department of Agriculture, Center for Nutrition Policy and Promotion, November 2007, p. 20, http://www.cnpp.usda.gov/sites/default/files/healthy_eating_index/HEI-2005TechnicalReport.pdf(accessed January 13, 2016).
[13] Calculations are based on an adult male with a standard intake of 2,500 calories per day. One small apple or one banana is the equivalent of one cup of whole fruit. For an adult with a recommended daily intake of 2,500 calories, one cup of whole fruit is worth five points on the HEI-2005 scale. For the same adult, one cup equivalent of green or orange vegetables is worth five points on the scale. By contrast, each 100 calories of added sugar above the SoFASS limit reduces the HEI-2005 score by around 2.66 points. Consuming an extra 12-ounce can of soda with 150 calories above the SoFAAS limit would drop the daily HEI score by four points.
[14] One small apple or one banana is the equivalent of one cup of whole fruit. For an adult with a recommended daily intake of 2,500 calories, one cup of whole fruit is worth five points on the HEI-2005 scale. Thus, one point on the HEI-2005 scale is the equivalent of around one-fifth of an apple; the amount would be less for women and children.
[15] Both calculations are for an adult male with a daily 2,500-calorie intake.
[16] Hazel A. B. Hiza, Kellie O. Casavale, Patricia M. Guenther, and Carole A. Davis, “Diet Quality of Americans Differs by Age, Sex, Race/Ethnicity, Income and Education Level,” Journal of the Academy of Nutrition and Dietetics, Vol. 113, Issue 2 (February 2013), pp. 297–306, http://www.sciencedirect.com/science/article/pii/S2212267212014220 (accessed January 13, 2016).
[17] James Mabli, Laura Castner, James Ohls, Mary Kay Fox, Mary Kay Crepinsek, and Elizabeth Condon, Food Expenditures and Diet Quality Among Low-Income Households and Individuals: Final Report, Mathematica Policy Research, July 2010, http://www.fns.usda.gov/sites/default/files/FoodExpendDietQuality.pdf (accessed January 13, 2016). Prepared for the U.S. Department of Agriculture, Food and Nutrition Service, Office of Research and Analysis.
[18] Ibid., p. xxii.
[19] Ibid., p. 32.
[20] Cindy W. Leung, Elissa S. Epel, Lorrene D. Ritchie, Patricia B. Crawford, and Barbara A. Laraia, “Food Insecurity Is Inversely Associated with Diet Quality of Lower-Income Adults,” Journal of the Academy of Nutrition and Dietetics, Vol. 114, Issue 12 (December 2014), pp. 1943–1954, http://www.ncbi.nlm.nih.gov/pubmed/25091796 (accessed January 13, 2016). One limitation of this study is that it compares food security status over a year with dietary intakes in a single day. VLFS adults are not food insecure in every month. If food intakes were measured in the same month an individual had VLFS, average intakes might be lower. On the other hand, the study does show that the long-term diets of VLFS adults are very similar to those of food-secure adults.
[21] Leung et al. also measure differences in the new Alternate Healthy Eating Index-2010. The difference between VLFS and food-secure adults on this scale was again very small: 1.5 points on a 110-point scale.
[22] Andrea Carlson and Elizabeth Frazão, Are Healthy Foods Really More Expensive? It Depends on How You Measure the Price, U.S. Department of Agriculture, Economic Research Service, Economic Information Bulletin No. 96, May 2012, http://www.ers.usda.gov/media/600474/eib96.pdf (accessed January 13, 2016).
[23] Ibid., p. 21.
[24] Ibid., p. iii.
[25] Barbara Rolls and Robert A. Barnett, The Volumetrics Weight-Control Plan (New York: HarperCollins, 2000).
[26] Adam Drewnowski and S. E. Specter, “Poverty and Obesity: The Role of Energy Density and Energy Costs,” American Journal of Clinical Nutrition, Vol. 79, No. 1 (January 2004), pp. 6–16, http://ajcn.nutrition.org/content/79/1/6.full.pdf+html (accessed January 13, 2016).
[27] Rolls and Barnett, The Volumetrics Weight-Control Plan.
[28] Leung et al., “Food Insecurity Is Inversely Associated with Diet Quality of Lower-Income Adults,” p. 7.
[29] Calculations from U.S. Bureau of the Census, Current Population Survey, Food Security Supplement, December 2013.
[30] Leung et al., “Food Insecurity Is Inversely Associated with Diet Quality of Lower-Income Adults,” p. 3.
[31] Steven Bradbard, Eileen F. Michaels, Kathryn Fleming, and Marci Campbell, Understanding the Food Choices of Low Income Families: Summary of Findings, report prepared by Lisboa Associates for the U.S. Department of Agriculture, Food and Consumer Service, Office of Analysis and Evaluation, May 30, 1997, http://www.fns.usda.gov/sites/default/files/NUTRI.PDF (accessed January 13, 2016).The focus groups were composed primarily of low-income mothers, although a few fathers also attended.
[32] Ibid., p. 8.
[33] Leung et al., “Food Insecurity Is Inversely Associated with Diet Quality of Lower-Income Adults,” p. 5.
[34] Calculations from U.S. Bureau of the Census, Current Population Survey, Food Security Supplement, December 2013.
[35] Ibid.
[36] Laura Tiehen, “Private Provision of Food Aid: The Emergency Food Assistance System,” U.S. Department of Agriculture, Economic Research Service, Food Assistance and Nutrition Research Report No. 26-5, August 2002, http://www.ers.usda.gov/media/886877/fanrr26-5_002.pdf (accessed January 13, 2016).
[37] Food Pantries, “Find Food Pantries,” http://www.foodpantries.org/ (accessed January 13, 2016).
[38] U.S. Department of Agriculture, Food and Nutrition Service, Office of Research and Analysis, SNAP Food Security In-Depth Interview Study: Final Report, March 2013, pp. 32–33, http://www.fns.usda.gov/sites/default/files/SNAPFoodSec.pdf (accessed January 13, 2016). Prepared for the Food and Nutrition Service, Office of Research and Analysis, by Kathryn Edin, Melody Boyd, James Mabli, Jim Ohls, Julie Worthington, Sara Greene, Nicholas Redel, and Swetha Sridharan, Mathematica Policy Research.
[39] Data in this section are calculated from Centers for Disease Control and Prevention, National Center for Health Statistics, National Health and Nutrition Examination Survey, 2009–2010.
[40] Based on an average cost of a pack of cigarettes including non-brand cigarettes in 2014 according to The Tax Burden on Tobacco: Historical Compilation, Vol. 49, Orzechowki and Walker, Arlington, Virginia, 2014, http://www.taxadmin.org/assets/docs/Tobacco/papers/tax_burden_2014.pdf (accessed January 13, 2016). Thrifty food plan cost is based on 2015 data.
[41] U.S. Department of Agriculture, National Institute of Food and Agriculture, “2014 Impacts: The Expanded Food and Nutrition Education Program (EFNEP),” March 2015, http://nifa.usda.gov/sites/default/files/resource/2014%20EFNEP%20Impact%20Report.pdf (accessed January 13, 2016).
[42] The evaluation design was quasi-experimental because the control group was composed of program-eligible individuals whose entry into the program was delayed and who did not participate in the education until the evaluation had been completed.
[43] Janie Burney and Betsey Haughton, “EFNEP: A Nutrition Education Program that Demonstrates Cost-Benefit,” Journal of the American Dietetic Association, Vol. 102, Issue 1 (January 2002), pp. 39–45, http://www.sciencedirect.com/science/article/pii/S0002822302900143 (accessed January 13, 2016).
[44] Heather A. Eicher-Miller, April C. Mason, Angela R. Abbott, George P. McCabe, and Carol J. Boushey, “The Effect of Food Stamp Nutrition Education on the Food Insecurity of Low-income Women Participants,” Journal of Nutrition Education and Behavior, Vol. 41, Issue 3 (May–June 2009), pp. 161–168, http://www.sciencedirect.com/science/article/pii/S1499404608007057 (accessed January 13, 2016).
[45] The cost figure is for rice and dried legumes purchased in units of five or more pounds.
[46] For example, dietary expert Adam Drewnowski argues that VLFS adults cannot spend time cooking because they are “working two jobs at minimum wage.” Quoted in James Ridgeway, “Heritage Foundation on Hunger: Let Them Eat Broccoli,” Mother Jones, December 3, 2007, http://www.motherjones.com/politics/2007/12/heritage-foundation-hunger-let-them-eat-broccoli(accessed February 4, 2016).
[47] Calculations from U.S. Bureau of the Census, Current Population Survey, Food Security Supplement, December 2013. Among adults who were found to have VLFS in the preceding month, only 40.4 percent were employed in the week before the survey.
[48] Adam Drewnowski asserts that VLFS individuals cannot cook because they lack “a kitchen, pots, pans, utensils, gas, electricity, a refrigerator, a home with rent paid, the time to cook.” Quoted in Ridgeway, “Heritage Foundation on Hunger: Let Them Eat Broccoli.”
[49] U.S. Bureau of the Census, American Housing Survey, AHS 2013 National Summary Tables, Table C-03-AO, http://www.census.gov/programs-surveys/ahs/data/2013/ahs-2013-summary-tables/national-summary-report-and-tables---ahs-2013.html (accessed February 5, 2016).
[50] Ashima K. Kant and Barry I. Graubard, “Energy Density of Diets Reported by American Adults: Association with Food Group Intake, Nutrient Intake, and Body Weight,” International Journal of Obesity, Vol. 29, No. 8 (August 2005), p. 953, Table 2.
[51] According to the 2015 dietary guidelines, “Intakes of total grains are close to the target amounts…for all age-sex groups” in the U.S. population. See Chapter 2, “Shifts Needed to Align with Healthy Eating Patterns,” in U.S. Department of Health and Human Services and U.S. Department of Agriculture, Dietary Guidelines for Americans 2015–2020, December 2015, http://health.gov/dietaryguidelines/2015/guidelines/chapter-2/a-closer-look-at-current-intakes-and-recommended-shifts/ (accessed January 22, 2016). However, beginning with the 2010 version, the dietary guidelines called for an increase in the consumption of whole grains and a corresponding decrease in enriched/refined grains with the aim of raising whole grains to 50 percent of total grain consumption. Moderate evidence indicates that increased whole-grain consumption can lead to reduced risk of type 2 diabetes, cardiovascular disease, and hypertension. There is moderate evidence that increased intake of whole grains is associated with lower body mass index and lower obesity. See “What Is the Relationship Between Whole Grain Intake and Body Weight?” in U.S. Department of Agriculture, Nutrition Evidence Library, http://www.nel.gov/evidence.cfm?evidence_summary_id=250304 (accessed January 22, 2016). This last finding is puzzling because enriched/refined grains have the same energy density or calories per serving as corresponding whole grains. However, almost half of all refined-grain consumption is from high-calorie mixed dishes such as tacos, pizza, macaroni and cheese, burgers, and spaghetti with meatballs. Another 20 percent of refined-grain intake comes from baked goods with added fat and sugar such as cakes and cookies. Chapter 2, “Shifts Needed to Align with Healthy Eating Patterns,” in U.S. Department of Health and Human Services and U.S. Department of Agriculture, Dietary Guidelines for Americans 2015–2020. The combination of high-calorie fats and sugars with processed grains may lead to excess caloric intake. The staple grain meals recommended in this paper do not mix grains with high-fat or sugar foods.