The competition among the states is becoming more intense as businesses become more mobile. Toyota and Boeing are two high-profile employers in America that have crossed state borders because of the policy advantages of one state over another. Toyota moved from high-income-tax California to no-income-tax Texas, and Boeing, based in Washington, a forced-union state, opened a new plant in South Carolina, which has a right-to-work (RTW) law. Texas Governor Rick Perry and California Governor Jerry Brown have openly sparred in recent years about which state is more pro-business. Interstate competition allows governors and legislators to learn from each other about which policies create wealth and which policies diminish wealth inside their borders.
In recent years, governors have generally divided into two competing camps, which we call the “red state model” and the “blue state model,” raising the stakes in this interstate competition. The conservative red state model is predicated on low tax rates, right-to-work laws, light regulation, and pro-energy development policies. This policy strategy is now common in most of the Southern states and the more rural and mountain states. Meanwhile, the liberal blue state model is predominantly found in the Northeast, California, Illinois, Minnesota, and, until recently, Michigan and Ohio. The blue states have doubled down on policies that include high levels of government spending, high income tax rates on the rich, generous welfare benefits, forced-union requirements, super-minimum-wage laws, and restrictions on oil and gas drilling.
In no area are the effects of these competing models more evident than in tax policy changes of recent years. California, Connecticut, Hawaii, Illinois, Minnesota, New York, and Oregon have raised their income tax rates on “the rich” since 2008.[1] In four of these states, the combined state and local income tax rate exceeds 10 percent, reaching 13.3 percent in California and 12.7 percent in New York.[2] Meanwhile, the “red states” of Arizona, Arkansas,[3] Kansas,[4] Missouri,[5] North Carolina, Oklahoma, and Idaho[6] have cut their tax rates. This has widened the income tax differential between blue states and red states for businesses and upper-income families.
Similarly, red states such as Oklahoma, Texas, and North Dakota have embraced the oil and gas drilling revolution in America. Blue states such as New York, Vermont, Illinois, and California have resisted it. Blue states have raised their minimum wages; red states generally have not.
In this study, which is a summary of our recent book with Rex Sinquefield and Travis Brown, An Inquiry into the Nature and Causes of the Wealth of States: How Taxes, Energy, and Worker Freedom Will Change the Balance of Power Among States, we examine whether these policy differentials matter and, if so, by how much.
The answer is that the states’ policy choices on taxes, regulation, energy policy, labor laws, educational choice, and so forth have a large and in most cases a statistically significant impact on the prosperity of states over each 10-year time frame examined on a rolling basis from 1970 to 2012. There are always exceptions to the rule, but in most cases the red state model is substantially outperforming the blue state model.
We find in particular that two policies matter most. Right-to-work states substantially outperform non–right-to-work states, and states with no or low income taxes have a much better economic record than high-income-tax states.
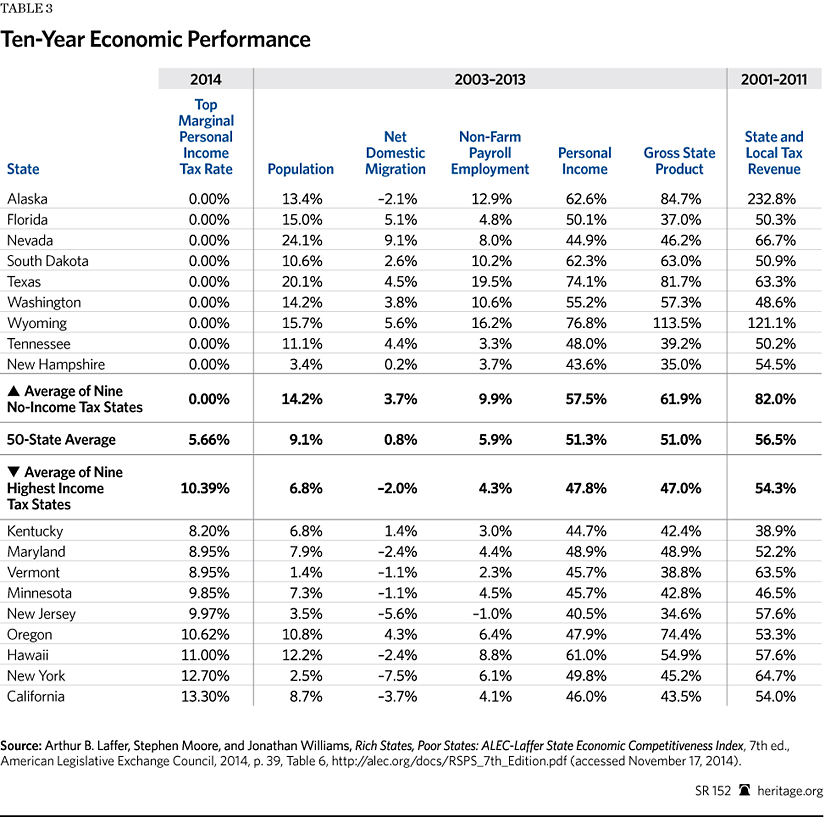
Taxes. On taxes, we compare the nine states without a personal earned-income tax (Alaska, Florida, Nevada, South Dakota, Texas, Washington, Wyoming, New Hampshire, and Tennessee) with the nine states with the highest income taxes (Kentucky, Minnesota, Maryland, Vermont, New Jersey, Oregon, Hawaii, New York, and California).[7] The results are shown in Chart 1:
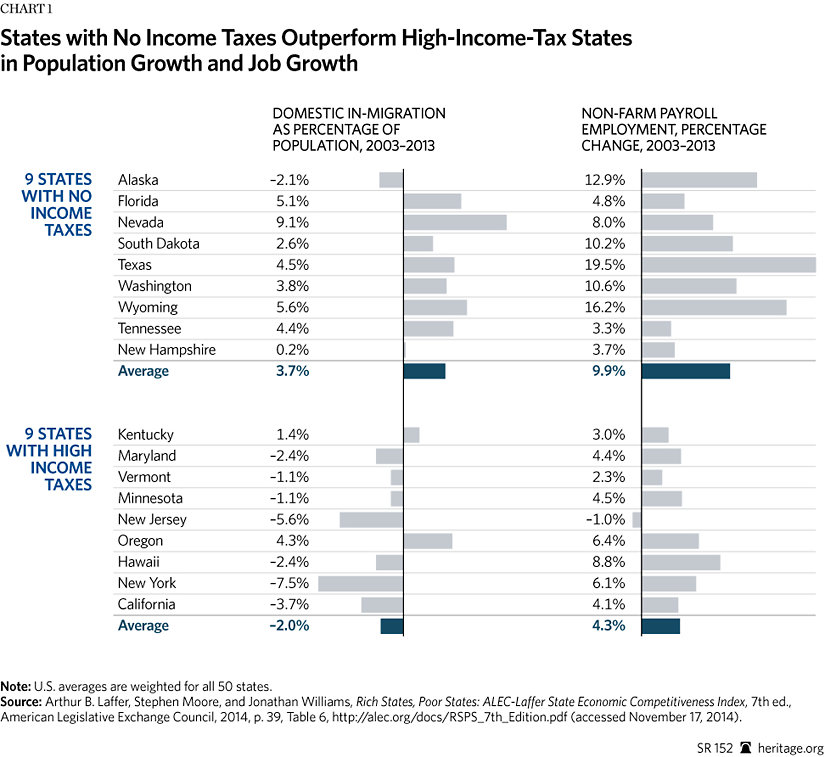
- Americans are voting with their feet to keep more of their income. The nine zero-income-tax states gained an average of 3.7 percent of their population from domestic in-migration from 2003 to 2013, while the highest-income-tax states lost an average of 2.0 percent of their population during the same period. Overall, population growth on an equally weighted basis from 2003 to 2013 was twice as high in the low-income-tax states.[8] In terms of raw population, the nine zero-income-tax states in total gained an average of 830 people per day from domestic migration throughout 2004–2013; meanwhile, the nine highest personal income tax states in total lost an average of 944 people per day from domestic migration.[9] The flow of families from high-tax to low-tax states is unmistakable.
- The jobs growth rate was more than double in the zero-income-tax states than in the high-income-tax states, on an equally weighted basis.[10] Businesses such as Toyota are more likely to set up operations in low-tax states. This kind of business relocation to low-tax states is happening routinely and even accelerating.[11] Of the four largest states, from 1990 to June 2014, the jobs growth rate in red states Florida (46 percent) and Texas (65 percent) has been almost triple the jobs growth of blue states California (24 percent) and New York (9 percent).
- Interstate migration has resulted in the zero-income-tax states gaining more than 14 percent of their 2009/2010 adjusted gross income from the rest of the nation between the tax filing years 1992/1993 and 2009/2010.[12] Meanwhile, the nine highest income tax states lost 8.8 percent of their 2009/2010 adjusted gross income over the same period.[13]
Right-to-Work Laws. On the effect of right-to-work laws, the same picture comes into sharp focus. A right-to-work law does not prohibit a union, but empowers individual workers to choose whether to join the union (and pay dues for political purposes). As of January 1, 2013, 23 states were right to work and 27 were forced union.[14] Comparing these states’ economic performance, we find:
- People are moving to right-to-work states. Population growth as an equal-weighted average from 2002 to 2012 was 12.6 percent over the past decade in RTW states and only 6.5 percent in non-RTW states.[15] Over the same decade, the equal-weighted average net domestic in-migration to RTW states was 3 percent, while forced-unionization states realized an equal-weighted loss of 0.9 percent.[16] No doubt much of this population transfer occurred as people moved to where jobs are.
- The right-to-work states enjoyed a jobs growth rate more than three times that of the forced-union states. Job growth was up 6.8 percent in RTW states and only 1.9 percent in non-RTW states.[17]
We have examined this same data set for the past four decades, and regardless of the time period measured, the results show the same directional change in favor of right-to-work and no-income-tax states with only some variation in the magnitude of the change.
Our critics deny that these economic forces are in play, and we briefly respond to those critiques below. However, it is noteworthy that New York State, whose politicians in Albany have acted for decades like taxes do not matter, is now running ads around the country about big tax breaks to firms if they move to the Empire State. Apparently, even they now concede that tax policy influences growth. Yet Albany needs to actually change its policies, not just its public relations pitch.
How Interstate Migration Is Changing America
To know the places to bet on in America, one should follow the money—and the moving vans—and the Fortune 500 companies and the venture capital funds that will finance the next Googles and Facebooks. Their movement has a pattern that is based on many dozens of factors, including the quality of the human capital in the state (how well trained and educated the workers are), a state’s natural resources (especially energy resources and good farmland), geographical proximity to national and global markets, and the weather (warm weather areas with lots of sunshine are doing better as baby-boomers retire). Many of these factors are outside the control of politicians, especially in the near term.
However, policy decisions make a big difference in a state’s attractiveness. Taxes, education policy, right-to-work laws, regulation, pension deficits, and government spending and debt are drivers of migration. This is true now more than ever, in part because the differentials between the states are widening.
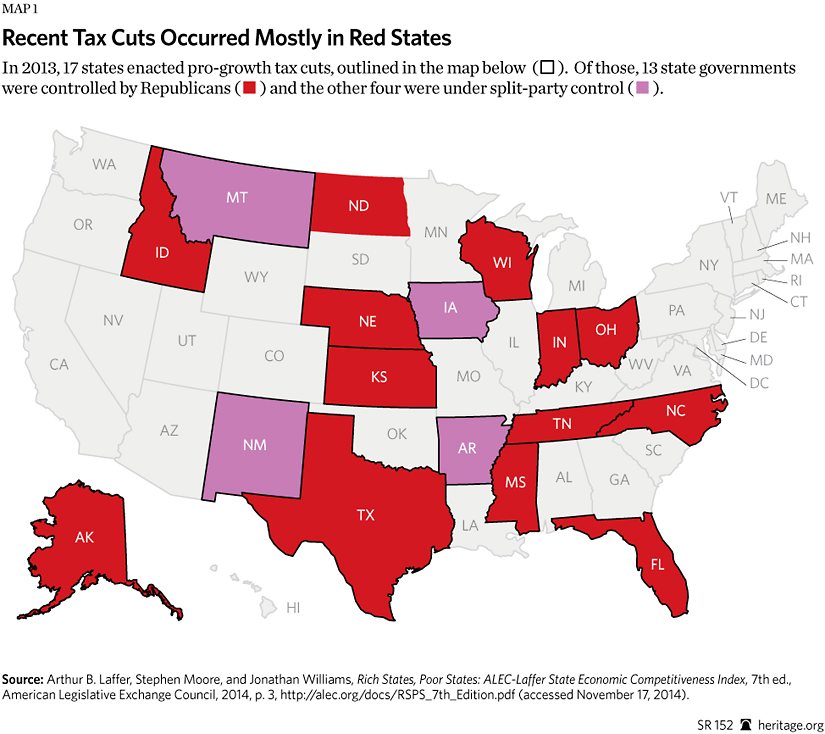
Blue states, for example, have been raising their tax rates, while red states are lowering their taxes. Of states that enacted pro-growth tax cuts in 2013,[18] 13 were red states at the time—defined as having a Republican-majority legislature and a Republican governor.[19] Of the remaining four, Iowa and New Mexico had Republican governors while Arkansas and Montana had Republican legislatures. Not a single solidly blue state enacted pro-growth tax cuts in 2013. Twenty Republican governors have proposed tax cuts in 2015.
As a result of policy changes, the 50 states and the hundreds of metropolitan areas constantly move up and down the income elevator. The United States is one large free trade zone, so businesses, people, and capital can move across state borders whenever they wish—although the Obama Administration’s National Labor Relations Board has tried to restrict the migration of employers. The Commerce Clause of the U.S. Constitution prohibits states from erecting tariffs on interstate commerce, and the Constitution also protects the rights of Americans to migrate freely between the states. Americans can locate and relocate anywhere and anytime they want in this vast country.
This study measures what might be the most important demographic trend in America: the huge shift of economic resources from blue states to red states. The geographical center of economic and political power in America is shifting right before our eyes—and more dramatically than perhaps at any time in decades. Americans are uprooting themselves and moving to places where there is economic vitality, opportunity, and a high quality of life. The recession slowed this interstate migration pattern, but it will pick up again in the decade to come.
Over the past decade (ending in 2013), roughly 53 million Americans—almost one in six—moved from one state to another[20]—a total greater than the combined populations of Florida, New York, and Illinois.
From another perspective, nearly 15,000 residents moved across state lines each day—mostly away from low-growth states and to the high-growth states. They are voting with their feet for jobs and higher incomes—economic opportunities that are disappearing from some regions of the country while sprouting in others.
Think what this means. We find that each year about $125 billion in purchasing power (adjusted gross income) leaves one state and enters another.[21] For local stores, businesses, and commerce that is a lot of dollars flowing to the winner states. That’s a lot of retail sales, tax revenues, home purchases, and investment in the local community and charities.
So Where Is Everyone Headed?
The geographical shift of power from the Northeast to the South is unmistakable. The big winners in this interstate competition for jobs and growth have generally been in Dixie: the Carolinas, Florida, Texas, and Tennessee. The Southwest and mountain region of the country are flying high, too—such as Idaho, the Dakotas, and Arizona. The big losers have been the traditional Rust Belt regions of the Northeast and Midwest. The demoralizing symptoms of economic despair in the declining states—such as Connecticut, Rhode Island, Pennsylvania, Illinois, and New Jersey—include lost population to other states, falling housing values in certain locales, a stagnant tax base, business out-migration, capital flight, high unemployment rates, and less money for schools, roads, and aging infrastructure.
North Dakota. The situation in a state can change quickly. The 2000 Census showed North Dakota’s population growth in last place of all states (3,400 people or 0.5 percent over 10 years).[22] In fact, since 1930, the state had lost 6.3 percent of its population.[23] Then, something amazing happened. Thanks to new oil and gas drilling technologies and a favorable regulatory climate, North Dakota has become the second-largest energy-producing state. North Dakota embraced the new innovations, such as fracking and horizontal drilling. One decade later, it is one of the major states importing people and capital.
Beginning in 2003, North Dakota’s population began increasing. For the decade ending in 2013, North Dakota ranked 15th in percentage population growth.[24] In 2013, North Dakota had the highest population growth rate in the nation[25] after having wiped out more than 70 years of population losses in the previous decade.
Yes, the geographical advantage of natural resource abundance played a major role in North Dakota’s stunning turnaround. But more importantly, North Dakota’s residents and political class recognized the opportunity and wisely capitalized on the drilling bonanza, while many more liberal states (such as New York) have turned up their noses to energy production. It is another lesson that policies matter a lot.
Recent Census Bureau data spotlight the migration winners and losers. We have assembled the data for the decade 2003–2012 to get a longer term view of where people are moving.[26]

Chart 2 clearly shows that the red states are growing and the blue states are falling behind. While outliers exist, the pattern is clear. Eight of the top 10 states are red states, seven of the bottom states are blue or purple states as judged by control of state legislative and executive branches.
Of course, sunny California will always have a natural climate advantage over frigid Minnesota. No one should think that Newark, New Jersey, will ever compete on equal footing with Malibu, California, or that Flint, Michigan will ever be as desirable as Palm Beach, Florida. That will not happen. Likewise, oil-rich Texas will always have a natural resources advantage over Rhode Island. Yet compensating differentials such as affordable housing, well-paying jobs, business-friendly laws, and low taxes enable states to overcome natural limitations such as poor climate, geography, or limited resources. Pro-growth policies can change the pace of growth and help to make an otherwise undesirable location desirable.
Growth Versus No-Growth States
Every state, of course, aspires to be a high-octane, high-growth state—a place of destination, not a place where people say with nostalgia that they are “from.” But differences in jobs growth rates are not random occurrences. Business growth varies significantly from state to state, in large part due to policy differences. Likewise, neither are long-term domestic migration patterns random. Policies that change the attractiveness of these locales to individuals affect the flow of people from Connecticut to Florida or from California to Nevada. Often, the desire to pursue opportunities in profitable enterprises motivates people to move across the country.
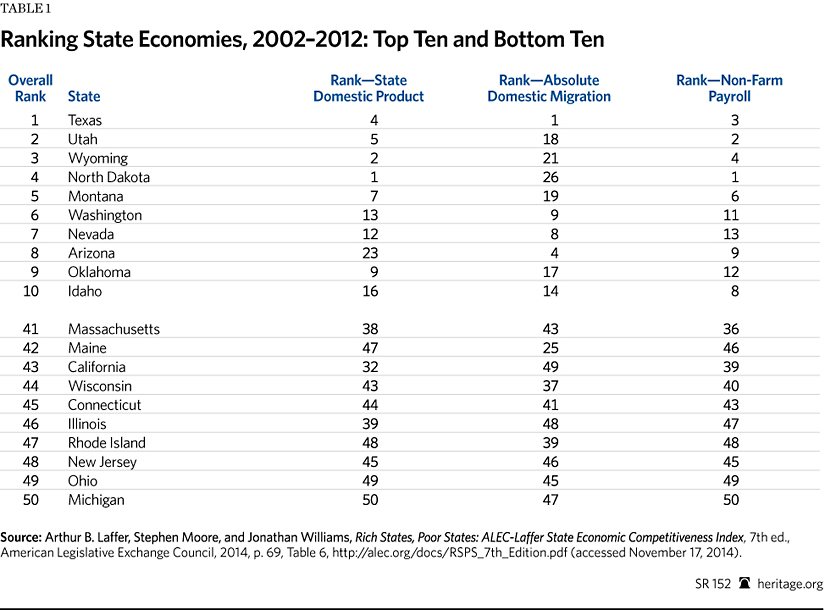
Looking backward on past performance, we list below the top 10 and bottom 10 economic performers from 2002 to 2012 in Table 1.[27]
In this study we investigate the main policy levers that help to explain the income, jobs, and population gains in the high-performing states. In other words, we examine the factors that lawmakers can control: the economic, fiscal, and social policy laws and environment prevailing in their states.
Economic policies matter. This is why many Russians are moving capital to the United States, and the Miami real estate market is feeling the effects. This is also why foreign investment in Argentina has dried up. Failed economic policies along with political instability have fueled the immigration crises on the U.S. southern border over the past years.
We have identified 15 policy variables that have a proven impact on the migration of investment capital and human capital—the basic ingredients of growth—into and out of states. Generally speaking, states that spend less (especially on income-transfer programs) and states that tax less (particularly on productive activities such as working or investing) experience higher growth rates than states that tax and spend more. The 15 factors are:
- Highest personal income tax rate,
- Corporate income tax rate,
- Progressivity of the personal income tax system,
- Property tax burden,
- Sales tax burden,
- Tax burden as a share of income,
- Estate tax rate,
- Recent tax policy changes,
- State and local government debt,
- Public employees per 1,000 residents,
- State liability system (quality),
- State minimum wage,
- Workers’ compensation costs,
- Right-to-work state (Yes or No), and
- Tax or expenditure limit (Yes or No).
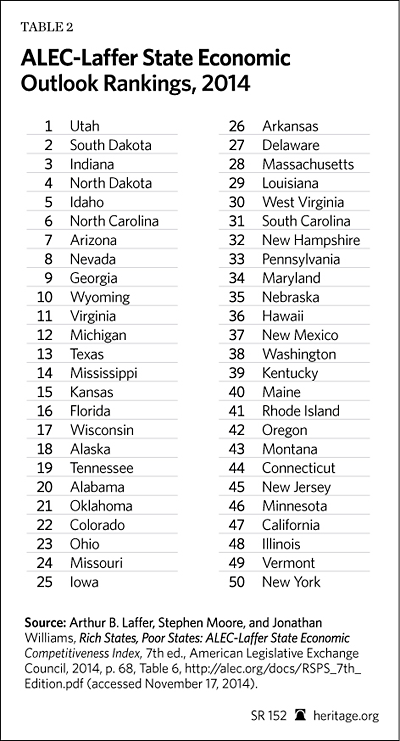
Table 2 shows our latest forecast of which states, based on how they fare on these policy variables, have the brightest economic outlooks and which have the bleakest outlook.
Most Americans live in the large metropolitan areas. We find that metro areas in pro-growth states are booming. The 10 fastest-growing of the most populous 100 metro areas from 2010 to 2013 were Austin, Raleigh, Charleston, Ft. Meyers, Provo, Houston, San Antonio, Orlando, Denver, and Dallas. Except for Denver, all of these are in low-tax, business-friendly red states. Metro areas dominated by blue-state policies—such as Scranton, New Haven, Cleveland, Dayton, Detroit, Buffalo, Providence, and Rochester—were among the biggest population losers.[28]
The Policies That Matter Most
Which policies are most essential to state population growth and economic growth as measured by gross state product? In our quest to determine what works and what does not work, we conducted an econometric analysis that related population and economic output growth to a series of 12 policy variables, including tax rates, tax burdens, right-to-work laws, and so on. The data used for this statistical study spanned an entire decade and all 50 states. Our goal was to develop a comprehensive analysis of state economic policies as a guide for current and future state government officials.
The two policy variables that matter the most are low income tax rates and right-to-work laws.[29]
Low Income Tax Rates. The highest income tax rate matters because this is the tax rate that business owners, investors, and those with portable wealth pay. California and New York City impose the highest personal income tax rate of up to 13 percent while nine states do not impose any income tax at all. As we learned from Tiger Woods and Phil Mickelson, this can be a powerful motivation to move or relocate a business.
Table 3 compares the nine no-income-tax states with the nine highest-income-tax states. While we have more detailed statistical analyses in later chapters of Wealth of States, the eyeball evidence shows a profound difference in economic performance. On average, no-income-tax states experienced double the jobs growth rate, one-fifth faster income growth, and double the population increase compared with the highest-income-tax states.[30]
We find that the negative relationship between high tax rates and net migration into a state is statistically significant. In other words, the likelihood that this result happened by chance is very small. Taxes matter.
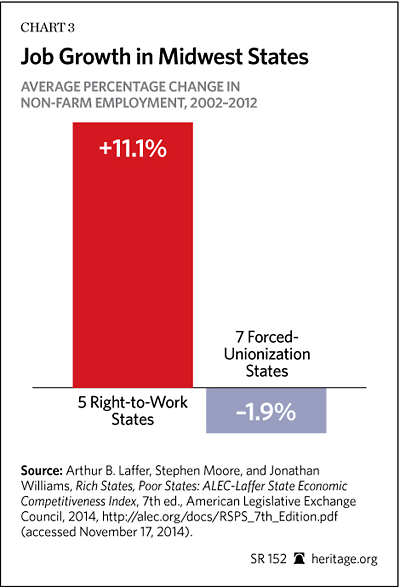
Right to Work. The same pattern emerges for right-to-work states. A right-to-work law does not prohibit unions. It simply allows workers the right to join a union or not, and it allows workers who opt out of the union to not pay union dues for political activities. About half the states are right to work, and about half the states have forced-union policies. In recent years Indiana and Michigan, the cradle of unionism in America, converted to right-to-work states. The truth is that unions are losing their power except in the public sector. Only about 11 percent of Americans are in a union today, a 40-year low, and only about 7 percent of private-sector workers are in unions.
How much does it matter if a state is right to work? Chart 3, which analyzes Midwestern states,[31] shows overwhelmingly that right-to-work states have much greater job growth than non–right-to-work states.[32]
Lessons from the Four Biggest States
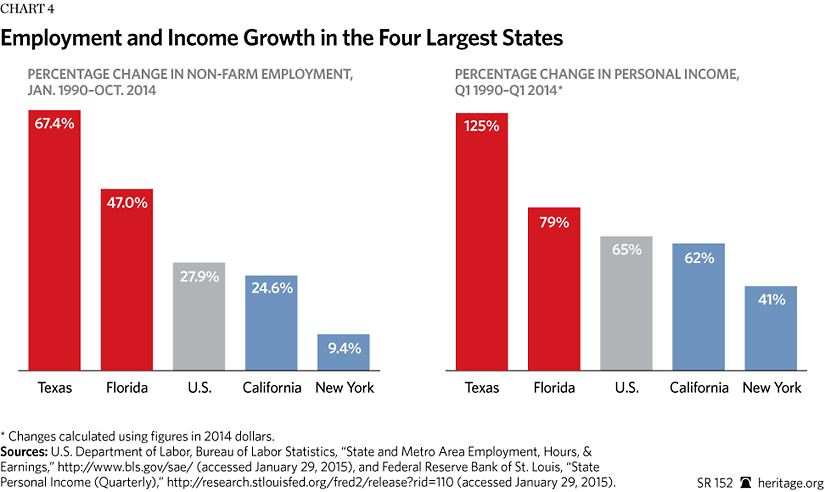
A big switch in the state population rankings is set to occur. By early 2015, Florida is expected to surpass New York in population because Florida’s population has grown at such a rapid pace over the past 30 years while New York’s population has been retreating. Only 20 years ago, Texas surpassed New York as the second most populous state. Now the four most populous states are California, 38.3 million; Texas, 26.4 million; New York, 19.7 million; and Florida, 19.6 million.[33]
These four largest states account for about one-third of the U.S. population, so they are critical to America’s overall success. It is hard for the U.S. to have a robust economic expansion if these four states are not prospering.
Coincidentally, these four states set up a very convenient natural experiment for our premise that low-tax states and states with relatively limited government interference in the private economy outperform states with the opposite policies. Texas and Florida have been implementing relatively pro-growth fiscal and regulatory policies. Neither Texas nor Florida has an income tax, and both are right-to-work states. By contrast, California and New York have been implementing counterproductive fiscal policies that have eroded their relative economic competitiveness. Both states have among the highest taxes in the nation, and both are not right-to-work.
Texas and Florida have also been growing much faster than the country as a whole, notwithstanding the big hit Florida took during the recession of 2008–2009. From 2003–2013, Texas and Florida saw overall population growth of 20 percent and 15 percent, respectively. Both California and New York experienced growth below the national average at 8.7 percent and 2.5 percent, respectively. While Texas and Florida both gained more than 1 million in domestic migration from 2003 to 2012, California and New York lost more than 1.4 million each during the same decade.[34]
With respect to jobs, Texas and Florida combined have grown at more than twice the pace of California and New York over the past 10 years ending in October 2014 (approximately 14.3 percent vs. 5.6 percent).[35] However, California has made a robust comeback in the past two years. Tax rates went up, but the rate of spending growth in the California budget went way down. A $25 billion budget deficit has been converted into an expected $3.2 billion operating surplus for the 2014–2015 fiscal year.[36] The San Francisco metro area was the ninth-fastest growing region in 2013 in raw numbers,[37] and its unemployment plunged from 10 percent in early 2010 to 4.4 percent in the fall of 2014.[38] However, the statewide unemployment rate of 7.3 percent[39] is still well above the national average. Texas’s job creation rate of 14.6 percent over the past five years ending in October 2014 dwarfs California’s 9.7 percent. Even Florida, still recovering from the housing bust, eclipsed California with a 9.9 percent growth in jobs.[40]
Some may be tempted to use California’s behemoth size as an excuse for its poor growth record. After all, is not high percentage growth harder to achieve in a large state? A few thousand jobs is a much bigger percentage in Delaware than in California. The record in Texas dismisses this excuse: Texas is achieving high percentage growth despite its size. Over the 10-year period beginning in October 2004, job creation exceeded 2.1 million in Texas compared with fewer than 760,000 in California.[41] In fact, data provided by the Joint Economic Committee in August 2014 show that Texas ranks second only to North Dakota in percentage growth of private-sector jobs since February 2010.[42] Although Texas is the second largest state, its jobs creation rate still ranked second nationally in percentage growth. So much for California’s “but we’re so much larger” excuse.
Overall, for the five-year period ending in October of 2014, roughly one of every six new U.S. jobs (15.4 percent) was created in Texas,[43] although Texas accounts for only 8.3 percent of the U.S. population.
Some argue that the Texas boom is a result of the oil and gas boom. While that is certainly a big part of the story, California is also a major oil and gas producer, but its policies have inhibited development of its abundant energy resources. Furthermore, while jobs in oil and gas extraction have increased by 42 percent in just five years, this represents only 2.2 percent of the overall job growth in Texas. Of perhaps rivaled importance is Texas’s transformation into a major high-technology state, with Austin and Houston developing major technology corridors.
The divergent experiences of these four states illustrates that the quality of the economic policies matters in economic growth, not necessarily size or weather. Even though California has a much more pleasant climate than Texas, the Lone Star State has outcompeted California in nearly every measure of progress we could find. And Florida is draining New York of its population and businesses. We would argue that California and New York are shining billboards of what not to do if states want to gain income and wealth.
Do Higher State Tax Rates Help the Poor and Reduce Inequality?
Class warfare is a hot issue in state capitals of late, just as it is in Washington, DC. Some legislators argue that raising the highest tax rate on wealthy citizens can effectively reduce the gap between rich and poor in a state. The “great recession” of 2008 and 2009 spurred many states to hike income taxes on the rich. By September 2009, California, Delaware, Hawaii, Maryland, Wisconsin, and North Carolina had hiked their highest income tax rate.[44] In Illinois, the rate jumped from 3 percent to 5 percent across the board, including the rich.
The increases in the highest tax brackets were almost all enacted in states with Democratic-controlled legislatures, reports Stateline.org. In each case, Pew Trusts’ Stateline reports, “Democrats muscled through the increases, arguing that wealthier residents can afford to pay a higher share of their income in taxes—particularly during a recession.”[45]
However, these higher tax rates have not balanced state budgets or improved the financing of vital state services—far from it. These states have been forced to savagely cut state services. We find no evidence that high-tax-rate states provide better or more services for their residents. For example, comparing California and Texas, we find that California spends substantially more than Texas in most cases, but has far worse outcomes in terms of quality of services or improving lives.[46]
Despite the evidence of economic imperilment, more tax increases on the rich may be coming in the more liberal states. With estimated combined pension deficits of more than $900 billion for all the states,[47] we expect another big push for tax increases in blue states. California, Illinois, and New York must decide whether to make their “temporary” tax increases permanent.
What of the argument that the rich are not paying their “fair share”?
These high-tax-rate states are already extremely dependent on the rich to pay for state government services. Table 4 shows the highest combined state and local tax rates in California, New Jersey, New York State, and New York City.[48] Each of these three states imposes tax rates at or near the highest in the nation—about twice the national average. Our examination of the data from the state revenue offices shows that these jurisdictions collected between 40 percent and 50 percent of their income tax revenues in 2008 from the wealthiest 1 percent of tax filers.[49] New York City has the same heavy extraction from the richest.
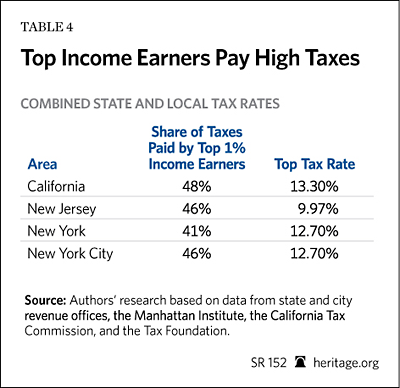
Targeting the rich is not only harming major employers, but also destroying opportunities for income mobility for others. A state cannot balance its budget on the backs of the 1 percent most productive citizens. They will leave, and they are leaving. In addition, other people and businesses are fleeing these locales. This is not what one would expect if these states are really superior and the “worker paradises” in terms of providing social justice
Again, the real-world evidence supports our contention. We start with research from groups on the left that support higher taxes on the rich. In other words, for the sake of argument, we will accept their list of which states are savagely unfair and which tax in a way to level incomes and create a more “progressive” economic culture.
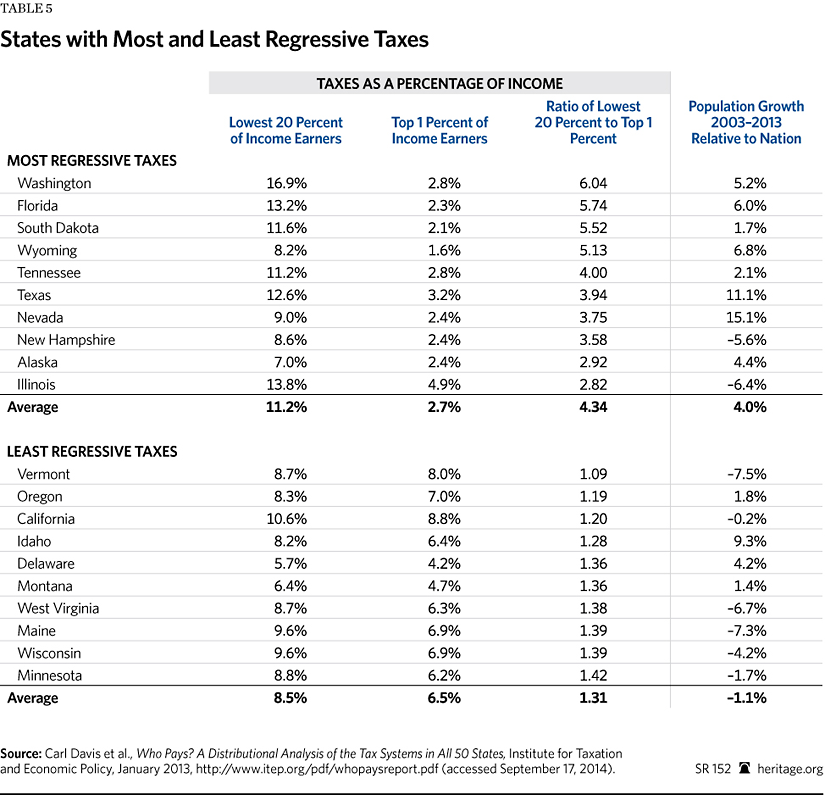
We used the “who pays” analysis created by the liberal group Institute on Taxation and Economic Policy[50] to determine the states with the most and least regressive tax systems, and we then examined the migration patterns in and out of these states. We found that states with the most highly progressive taxes (i.e., least regressive) on the richest 1 percent had much lower population growth than states with the most regressive taxes. As shown in Table 5, the least-regressive-tax states had average population growth from 2003 to 2013 that lagged 1.1 percent below the national trend. The 10 most highly regressive states, including nine with no state income tax, had population growth on average 4 percent above the U.S. average.
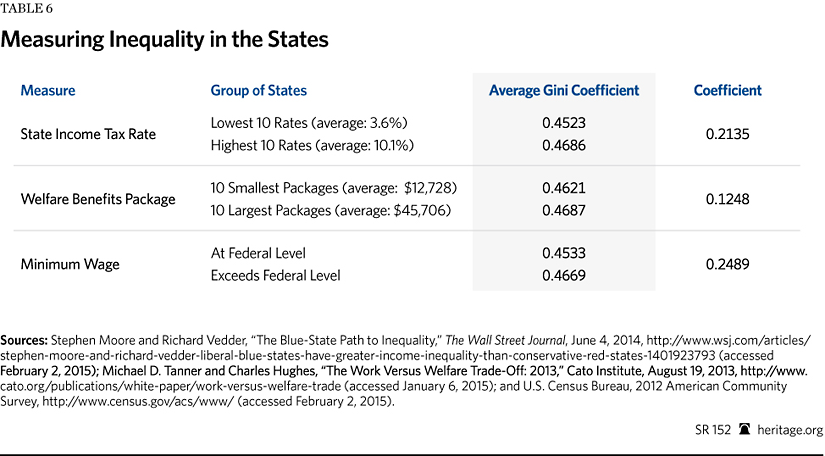
Finally, Stephen Moore teamed with economist Richard Vedder to examine whether states with higher tax rates, more liberal voting records, higher minimum wages, and more welfare benefits had less inequality than states on the other side of the policy spectrum. We found no evidence that these policies reduced income inequality. In some cases, we found statistically significant results in the other direction: Liberal policy prescriptions are associated with more income inequality as measured by the Gini coefficient, the left’s favorite fairness index.[51]
The Gini coefficient, a standard measure of income inequality, calculates the extent to which the income distribution differs from perfect equality. The higher the number, the more inequality exists. A Gini coefficient of zero means perfect equality of income, and a Gini coefficient of one represents perfect inequality, such as if one person has all the income. The U.S. Census Bureau annually calculates the Gini coefficient for the 50 states and the District of Columbia.
Contrary to the liberal expectations, the 19 states with minimum wages above the $7.25 per hour federal minimum do not have lower income inequality. States with a super minimum wage—such as Connecticut ($9.15), California ($9.00), New York ($8.75), and Vermont ($9.15)—have significantly wider gaps between rich and poor than states without a super minimum wage.
Welfare benefits exhibit a similar pattern. A Cato Institute report measured the value of all state welfare benefits in 2012.[52] In general, the higher the benefit package, the higher the Gini coefficient is. States with high income tax rates are not any more equal than states with no income tax. The Gini coefficient measures pre-tax, not after-tax income, and it does not count most sources of noncash welfare benefits. Still, there is little evidence over time that progressive policies reduce income inequality.
To be clear, our findings do not show that state redistributionist policies cause more income inequality, but they do suggest that raising tax rates or the minimum wage fails to achieve greater equality and may make income gaps wider.
The conclusion is nearly inescapable that liberal policy prescriptions—especially high income tax rates and the lack of a right-to-work law—make states less prosperous because they chase away workers, businesses, and capital.
When politicians become fixated on closing income gaps rather than creating an overall climate conducive to prosperity, middle-income and lower-income groups suffer the most, and income inequality rises. The past five years are a case in point. Those at the top have seen gains, especially from the booming stock market, while middle-class real incomes have fallen by about $500 in the five years since the recovery started in June 2009.[53]
This is a reversal from the 1980s and 1990s when almost all income groups enjoyed gains. The Gini coefficient for the United States has risen in each of the past three years and was higher in 2013 (0.476) than when George W. Bush left office (0.466 in 2008),[54] although Mr. Bush was denounced for economic policies, especially taxes, that allegedly favored “the rich.”
Our view is that John F. Kennedy had it right that a rising tide lifts all boats. It would be better for low-income and middle-income Americans if growth, not equality, became the driving policy goal in the states and in Washington, DC.
New York City Mayor Michael Bloomberg once called Manhattan a “luxury good,” meaning that people are willing to pay a premium to live there. Mayor Bill de Blasio obviously is of the same mindset. So are the politicians in Sacramento, who say much of the same thing about living in the Golden State.
Yet these jurisdictions are discovering that there are limits. The rich will pay more to live in Santa Barbara or Manhattan penthouses for sure, but everyone has a limit. The tax savings of living and running a business in Austin, Palm Beach, Nashville, Seattle, and countless other cities in states with no income tax can eventually outweigh the advantages of proximity to Wall Street or the Pacific Coast Highway. And when the rich escape, they often take more than their own direct tax payments. They also take their businesses and jobs with them. That is the collateral damage that high tax rates have on the middle class and poor.
Responding to the Critics
In an open letter in 2008 to Governor David Patterson (D–NY), Nobel Prize winner Joseph Stiglitz advised the debt-drenched Empire State “it is economically preferable to raise taxes on those with high incomes than to cut state expenditures.”[55]
Some of our growing number of liberal critics have tried every way possible to refute our findings. In recent months, liberal think tanks have published several studies arguing that taxes, regulations, and other policy variables have only minimal impact on people and businesses moving from one state to another. They also argue that cutting taxes or becoming a right-to-work state will have little impact on a state’s future prosperity. For example, the Center on Budget and Policy Priorities flatly declares that Texas does not hold “important lessons for state policies that can generate similar growth elsewhere.”[56]
Their case generally boils down to three arguments:
- Interstate migration patterns are too small to make much of a difference.
- Per capita income growth is the same or higher in high-tax and liberal states.
- Other policy factors—such as quality of education, roads, and housing—are more important than taxes to businesses and families when they move from one state to another.
Yet the evidence that pro-growth policies have a large impact on how states perform and where people—especially successful people—will want to live in the future is pretty close to incontrovertible and even overwhelming. In our book Wealth of States, we dedicate a lengthy chapter to refuting these arguments. Here is a brief summary of why the skeptics’ case is wrong.
1. Does interstate migration matter for the long-term health of a state or city?
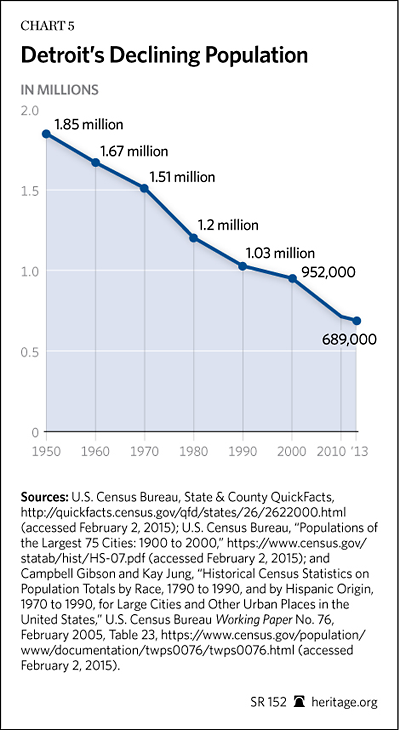
One quick answer is to look at Detroit. After 30 years of liberal policies, Detroit’s population fell from 1.6 million to about 600,000. (See Chart 5.) This is, of course, a dramatic example of the impact of outmigration. This once great city, which was one of the nation’s hubs of manufacturing and commerce, is today a ghost town of closed factories, dilapidated housing, social disrepair, and fiscal bankruptcy. For years liberals pretended that the downfall of Detroit was not happening, blamed it on external factors (trade), or attacked critics of Motor City policies as racist. Those myths crashed with the crash of the city itself.
Our warning is that the Northeastern states and several other blue states around the country are slow-motion versions of Detroit. Over the 18-year period studied, $125 billion of the income earned by Americans shifted from one state to another each year because of interstate moving patterns.[57] That is just in one year.
Over time, a pattern emerges of high-tax states losing earned income to low-tax states. Over the 18-year period of 1992/1993–2009/2010 based on Internal Revenue Service data, the aggregate adjusted gross income lost from interstate migration exceeded 8 percent of the 2009 total in Connecticut, Rhode Island, Michigan, Ohio, New Jersey, Illinois, and New York. In contrast, Nevada, Florida, Arizona, South Carolina, Idaho, Montana, and North Carolina gained more than 15 percent.[58] We regard these results as highly problematic over time for the blue states, and the politicians and chambers of commerce in these states should, too.
2. Why are blue states richer with higher per capita and median family incomes than red states?
The answer is that blue states were not always as dysfunctional in their policies as they are now. New Jersey was one of the five richest states in the nation in 1960 (and still is).[59] It had neither an income tax, nor a sales tax. Now it has nearly the highest income and sales taxes in the nation, and it cannot balance its budget. It is a rapidly declining state. Connecticut had no income tax until 1992. Since then Connecticut has suffered flight from almost all of its cities.
The per capita income measure of how a state is performing is routinely cited as evidence that blue states are not falling behind, but this does not tell the whole story because population grows rapidly in high-growth states. Incomes rise, but so does the denominator population. Meanwhile, Rhode Island has suffered a population loss year after year, yet is still a very high per capita income state. If trends continue the state will only have a few people left, but they will likely have a high per capita income. When per capita income rises due to young people leaving or the birth rate dropping, it is foolish to conclude the state is better off.
The inherent problem with measuring gross state product (GSP) or income on a per capita basis is plain when examining two states on opposite ends of the growth spectrum: Nevada and West Virginia.
Nevada is a zero-income-tax state, a zero-corporate-tax state, and a right-to-work state that, over the decade 2001–2010, ranked first in population growth, eighth in GSP growth, eighth in personal income growth, and ninth in nonfarm payroll employment growth. Yet the state ranked 48th in per capita personal income growth and 35th in median household income growth from 2001 to 2010.
In contrast, West Virginia has been ranked number one in median household income growth from 2001 to 2010. Since 1961, the state has gone from comprising 0.78 percent of the nation’s total personal income to just 0.48 percent in 2012. Income has fallen precipitously decade after decade in West Virginia, as has its population—from 1.05 percent to 0.59 percent of total U.S. population in 2012. West Virginia’s metrics are not the components of a prosperous state. The name West Virginia has been and still is a synonym for poverty and despair. People and jobs have been fleeing this high-tax state for a long time.[60]
West Virginia has experienced the exact opposite of what Nevada has experienced. In West Virginia, able-bodied lower-class and middle-class workers and their families have been unable to find work and have left the state for greener pastures elsewhere. Lower-income or no-income people are leaving the state more rapidly than are higher-income people. As the state becomes more and more hollowed out, the last few stubborn above-average families still remaining in the state cause the median household income to rise.
To remove another point of confusion, the people in a state can all be better off even if the state’s per capita or median income goes down. For example, if 50,000 low-income agriculture workers earn higher pay by moving into Texas, and Texas farmers earn more by hiring these high-quality, low-pay in-migrants, then everyone is better off and no one is worse off. The per capita income in Texas may actually go down simply because there would be proportionately more low-income agricultural workers in Texas.
While per capita GSP is generally higher in the high-income-tax states for these reasons, growth of per capita GSP is not generally higher in those states. For example, in the 2001–2010 period, per capita GSP grew 37.2 percent in the no-income-tax states, and just 33.4 percent in the high-income-tax states. Regardless, even when this measure favors our point of view, it is still inappropriate to use it as an indicator of good state policies.[61]
Finally, other factors cause growth in states. Weather and sunshine clearly have an impact: The fastest growing states are Florida, Arizona, and Texas. Yet California, with arguably the nicest climate in the nation, has amazingly lost population over the past decade due to internal migration. Two states with nearly the highest population growth in the past five years are Oklahoma and North Dakota, and does anyone really want to argue that people move to those states for the weather?
The greater prosperity in red states did not just happen by chance. Numerous academic studies—both old and recent—have shown statistical evidence that high state and local taxes repel jobs and businesses.[62] Martin Feldstein, now president of the National Bureau of Economic Research, co-authored a famous study in 1998 called “Can State Taxes Redistribute Income?” and it should be required reading for today’s state lawmakers. The study concludes:
Since individuals can avoid unfavorable taxes by migrating to jurisdictions that offer more favorable tax conditions, a relatively unfavorable tax will cause gross wages to adjust…. A more progressive tax thus induces firms to hire fewer high skilled employees and to hire more low skilled employees.[63]
For workers and businesses, progressive policy is not progress at all.
Conclusion
We regard interstate competition for jobs, people, and capital as a positive force to discipline politicians to do the right thing. Too many politicians on the left still pretend that taxes, forced-union laws, indebtedness, and heavy regulation do not hurt their states’ economies. This study shows that these policies matter a great deal and that blue states such as New York, New Jersey, Connecticut, and Minnesota need to change course abruptly or they will be economically bled to death by the dynamic states of the South and others.
By promoting lower tax rates, smaller government intrusion into the economy, and right-to-work laws, our critics say we are endorsing a “race to the bottom.” Every state, the warning goes, will cut more and more taxes and ax vital public services such as schools and roads and police service. Every state will have the level of public services of Mississippi, and America will not be a very desirable place to live. We disagree.
Growth is not a zero-sum game. It is a positive-sum game with the favorable outcome of more jobs, higher incomes, and more opportunity in a state benefiting nearly all residents. As states grow richer, they can provide higher quality public services, and they will need less of some services, such as welfare and crime prevention.
We are confident that each state and the nation as a whole would be better off if they adopted the pro-growth policies that we recommend in this study and our book Wealth of States. This point is especially important when we consider that states and cities are not just competing against each other, but also against China, India, Indonesia, Europe, and every other place that would love to steal businesses and jobs from America. Of course, national economic policies have the biggest impact on whether Michigan can compete with Dublin, Tel Aviv, Berlin, or Beijing. State policies also make a difference when a global company wants to build a new plant or research facility and is choosing between Indiana and India. “We are competing against everyone in the world here in Texas,” said Governor Perry. “That is why we have to get the policies right at the state level.”[64]
If every state starts to get this growth formula right, America would benefit with rising living standards and more high-paying jobs across the nation.
—Stephen Moore is Distinguished Visiting Fellow in the Institute for Economic Freedom and Opportunity at The Heritage Foundation. Arthur Laffer, PhD, is the founder and chairman of Laffer Associates, an economic research and consulting firm. Joel Griffith is a Research Associate in the Institute for Economic Freedom and Opportunity at The Heritage Foundation.


