Contributors
Romina Boccia is Grover M. Hermann Fellow in Federal Budgetary Affairs in the Thomas A. Roe Institute for Economic Policy Studies, of the Institute for Economic Freedom and Opportunity, at The Heritage Foundation. John W. Fleming is Senior Data Graphics Editor at The Heritage Foundation. Spencer Woody is a member of the Young Leaders Program at The Heritage Foundation.
Introduction
In 2014, federal spending reached $3.5 trillion and the deficit was $486 billion. Compared with trillion-dollar deficits following the Great Recession, this presents a small and temporary improvement in the nation’s fiscal situation. However, this minor improvement does not mean that government can stop cutting back on spending. As the figures and graphics in this report show, that would be the wrong conclusion to draw.
The national debt will still reach nearly $18 trillion this year and it already exceeds 100 percent of gross domestic product (GDP). Publicly held debt (that is, debt borrowed in credit markets, excluding Social Security’s trust fund), is alarmingly high at three-quarters of GDP. Without further spending reforms, rising debt threatens to impede growth, harm Americans’ economic opportunities, and even threaten the nation’s security.
Deficits fell in 2014 because President Obama and Congress raised taxes on all working Americans, the economy saw some improvement which helped to bring in more revenue, extended unemployment benefits were allowed to expire, and spending cuts from sequestration and spending caps under the Budget Control Act of 2011 took effect.
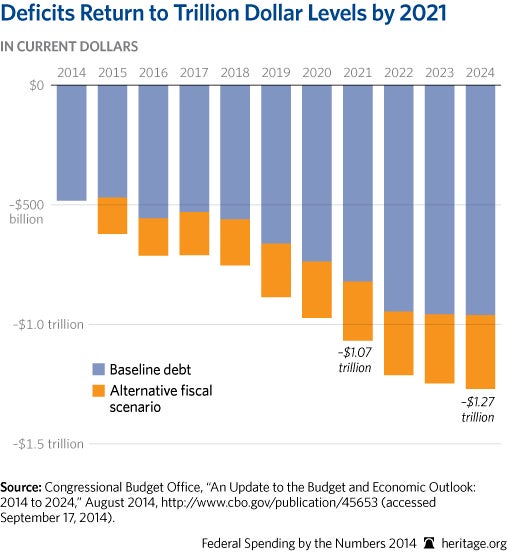
Congress should not take this short-term and modest deficit improvement as a signal to grow complacent about reining in exploding spending. Existing spending cuts and tax increases will not prevent deficits from rising next year, and before the end of the decade exceeding $1 trillion again. Driving this is federal spending, which is projected to grow by 66 percent by 2024.
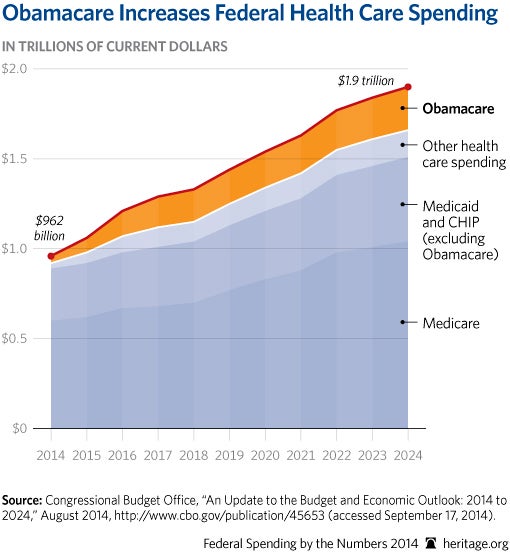
The nation’s long-term spending trajectory remains on a fiscal collision course. Social Security, Medicare, Medicaid, and Obamacare are too large and growing rapidly. While the Budget Control Act of 2011 and sequestration are modestly restraining the discretionary budget, mandatory spending—including entitlements—continues to grow nearly unabated. Eighty-five percent of the projected growth in spending over the next decade is due to entitlement spending and interest on the debt. Obamacare is the largest driver of increasing federal health care spending, and it alone will add $1.8 trillion in federal spending by 2024.
While mandatory spending is growing out of control and needs reform, there are also plenty of items to cut in the rest of the budget. For example, the National Institutes of Health spent $387,000 to study the effects of Swedish massage on rabbits, and according to a report from the Government Accountability Office, duplication of federal programs and services could cost taxpayers $45 billion annually.
Lawmakers should eliminate waste, duplication, and inappropriate spending; privatize functions better left to the private sector; and leave areas best managed on a more local level to states and localities. Most important, Congress should reform the entitlement programs so that they become more affordable and benefit those with the greatest need.
The Federal Budget
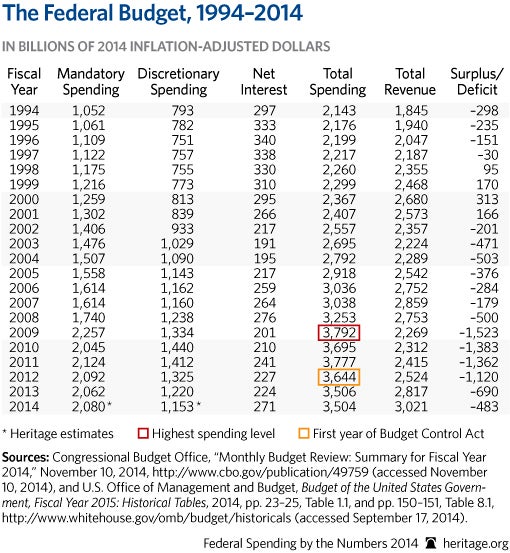
- Washington spent nearly $3.5 trillion in 2014 while collecting nearly $3 trillion in revenues, resulting in a deficit of slightly less than half a trillion. In other words, 14 cents of every dollar that Washington spent in 2014 was borrowed.
- Over the past 20 years, federal spending grew 63 percent faster than inflation.
- Mandatory spending, including Social Security and means-tested entitlements, doubled after adjusting for inflation.
- Discretionary spending grew by 47 percent in real terms.
- Despite publicly held debt surging to three-fourths the size of the economy (as measured by GDP), net interest costs have fallen as interest rates have dropped to historic lows.
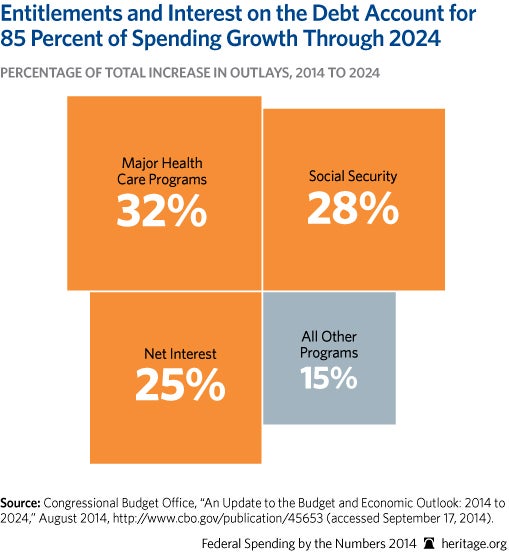
- Three major budget categories—major health care programs, Social Security, and interest on the debt—will account for 85 percent of nominal spending growth over the next decade. Entitlement reform is a must to curb the growth in spending.
Where Does All The Money Go?
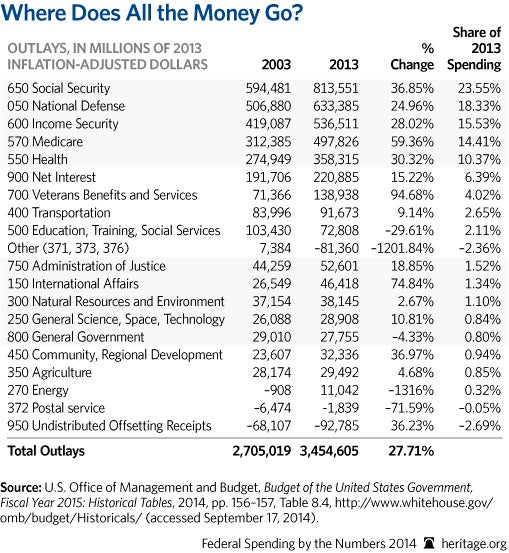
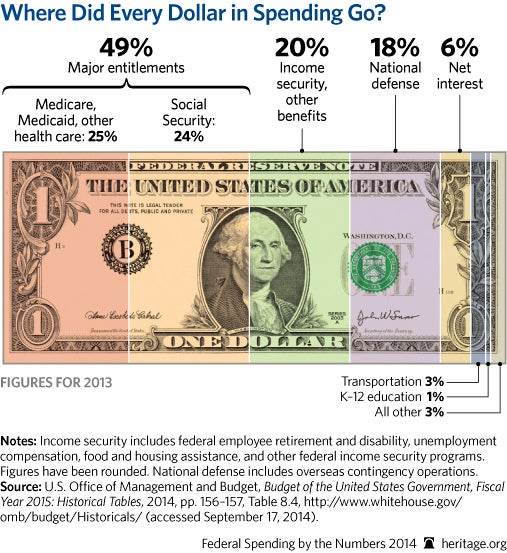
- Forty-nine percent, or almost half of all spending, paid for Social Security and health care entitlements (primarily Medicare and Medicaid).
- In 2003, the entitlement share of the budget was 44 percent, compared with 49 percent today. Without reform of these massive and growing programs, Washington will have to borrow increasing amounts of money, piling debt onto younger generations and putting the nation on a dangerous economic course.
- Social Security is the largest federal spending program and has held this position since surpassing defense spending in 1993.
- Medicare is one of the largest and fastest-growing programs in the entire federal budget.
Budget Trends
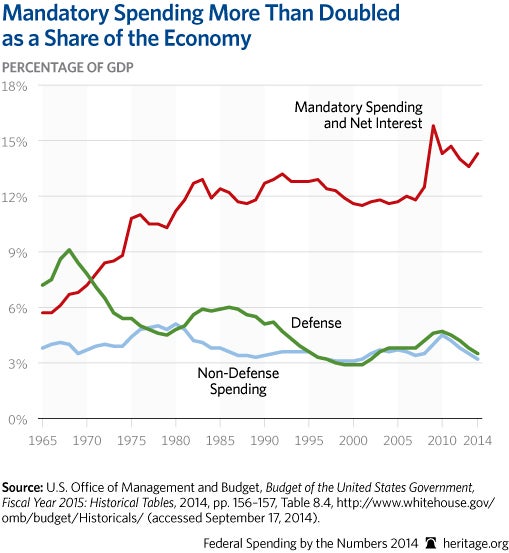
- In 1965, defense spending was 7.2 percent of GDP and mandatory spending on entitlement programs and net interest was 5.7 percent of GDP, one-third lower.
- In 2014, spending on defense is 3.5 percent of GDP, or less than half of what it was in 1965, and falling, while mandatory spending (including net interest) is reaching 14.3 percent of GDP and growing.
- Total annual spending will increase by $2.3 trillion in nominal terms, growing from $3.5 trillion in 2014 to $5.8 trillion in 2024.
- Social Security, Medicare, and Medicaid make up 77 percent, or more than three-fourths, of mandatory program spending in 2014 and have no budget limits.
- Discretionary spending, the part of the budget that Congress budgets each year, will increase by 29 percent over 10 years, but only if lawmakers enforce sequestration.
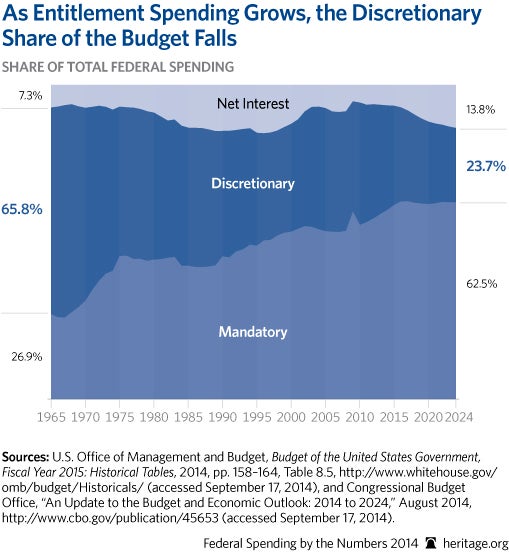
- Discretionary spending as a share of the budget will fall from two-thirds in 1964 to less than one-quarter in 2024, as entitlements grow uncontrolled.
- Mandatory spending will grow from one-quarter of the budget in 1965 to 63 percent by 2024. When net interest is added, this spending would consume three-fourths of the budget.
Debt Is Too High, and Growing
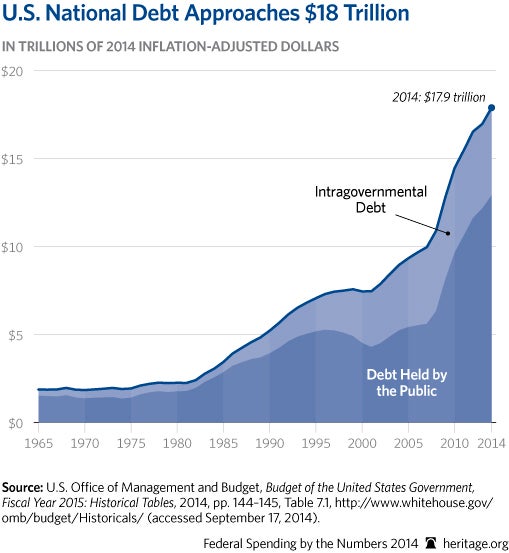
- Federal gross national debt consists of the publicly held debt (borrowed from credit markets) and intragovernmental debt, such as the Social Security Trust Fund.
- Publicly held debt exceeded $13 trillion in 2014, and together with nearly $5 trillion in intragovernmental debt, drove the national debt to nearly $18 trillion.
- In 2014, the national debt exceeds $145,000 per American household.
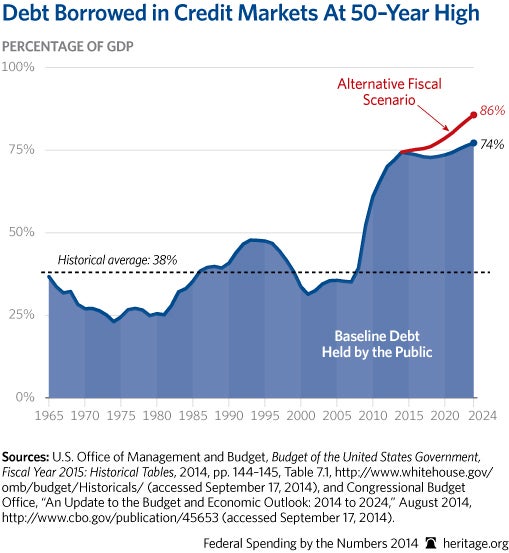
- In 2014, publicly held debt reached 74.4 percent of GDP. The historical average is about 38 percent.
- Baseline budget projections assume that Congress will allow a host of tax provisions to expire, an unlikely proposition. If Congress also ignores future sequestration cuts and continues the “doc fix” (reversing a scheduled payment cut to physicians who serve Medicare patients), publicly held debt would surge to 86 percent of GDP by 2024—the largest share since 1948.
Deficits and Interest on the Debt Grow
- Budget deficits occur any year that Congress spends more than it collects in taxes.
- In 2014, Congress borrowed 14 cents of every dollar it spent.
- The deficit is projected to grow from $486 billion in 2014 to $1.270 trillion by 2024, a 151 percent increase under the more realistic alternative fiscal scenario.
- Despite tax revenues returning to normal levels, the federal budget will have large deficits in each year because spending is projected to continue to grow.
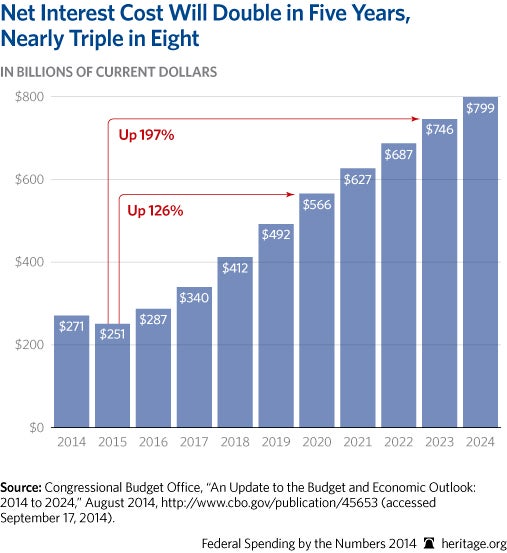
- The amount the federal government pays on interest payments depends primarily on interest rates and the amount of debt held by the public. Other factors, such as inflation and the maturity structure of outstanding securities, also affect interest costs (for example, long-term bonds generally carry higher interest rates than do short-term bills).
- As the publicly held debt grows, net interest payments will increase dramatically, even assuming that rates rise only moderately.
- Every single penny that goes toward paying interest on the debt is a penny that is no longer available to fund federal government priorities, such as national defense.
The Major Entitlement Programs
- Federal spending on health care programs will more than double over the next decade, growing by $1 trillion—from $962 billion in 2014 to $1.9 trillion in 2024.
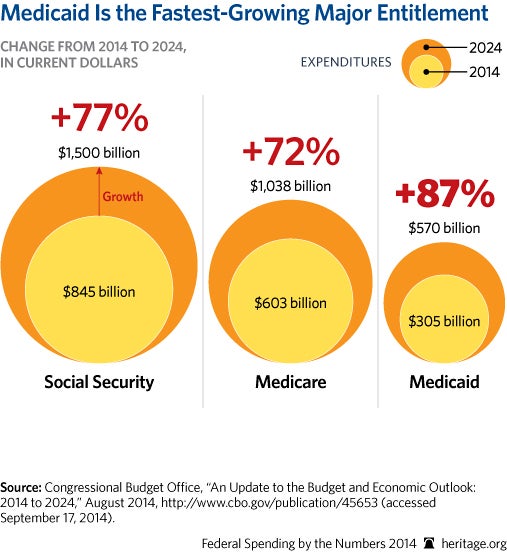
- Spending on Social Security, the largest federal program today, will surge by 77 percent, from $845 billion in 2014 to $1.5 trillion in 2024.
- Medicare is the largest health care program and its spending will surge by 72 percent, from $603 billion in 2014 to $1.04 trillion in 2024.
- Medicaid is the fastest-growing entitlement program and will grow by 87 percent over the decade, in no small part due to Obamacare’s Medicaid expansion. Medicaid needs reform, not expansion. This program provides health care to more than 60 million Americans and consumes a growing portion of state and federal budgets.
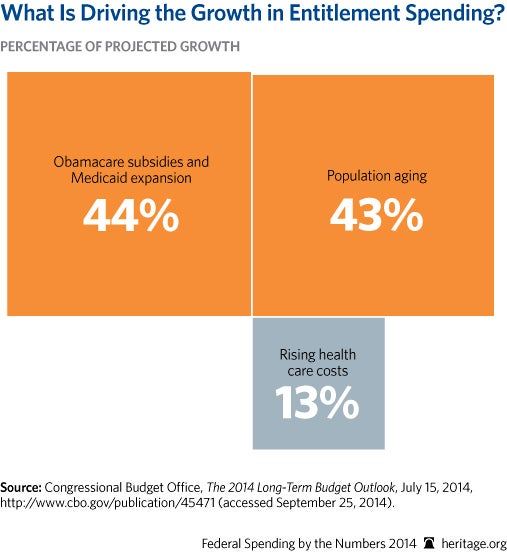
- Forty-four percent of the projected growth in major entitlement spending over the next decade is due to Obamacare’s subsidies and Medicaid expansion. Rising health care costs are projected to drive 13 percent of the increase; 43 percent of the spending growth in Social Security and the major health care programs will be due to population aging.
Obamacare
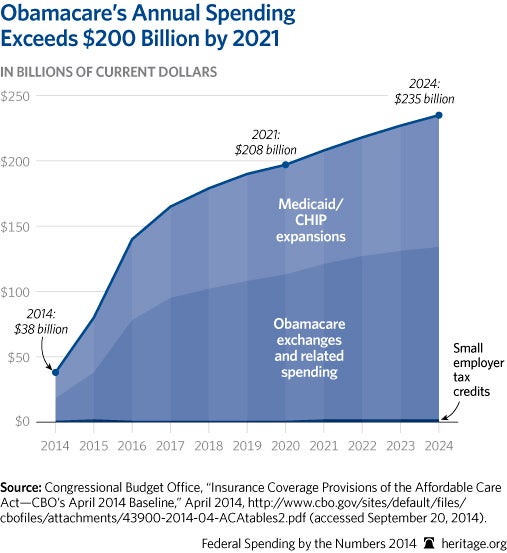
- Obamacare’s new spending will cost more than $1.8 trillion over the next decade for its massive expansion of Medicaid and subsidies for those purchasing health insurance in the new exchanges.
- There are 36 states currently relying on the federal exchange to facilitate their enrollment, for which the federal government has spent an estimated $800 million. The 14 states and the District of Colombia that are operating exchanges have received over $4 billion in grant money to help build them. However, the long-term costs of operating the Obamacare exchanges rest squarely on the states.
- One of Obamacare’s many failures is the temporary small business tax credit, which has been largely unsuccessful in enticing small employers into offering expensive health coverage. Only 7 percent of potentially eligible employers claimed it in 2011. Beginning in 2014, the credit is only available to businesses purchasing coverage on the Small Business Health Benefits Option Program (SHOP) exchange and can only be claimed for a maximum of two years.
Welfare Spending
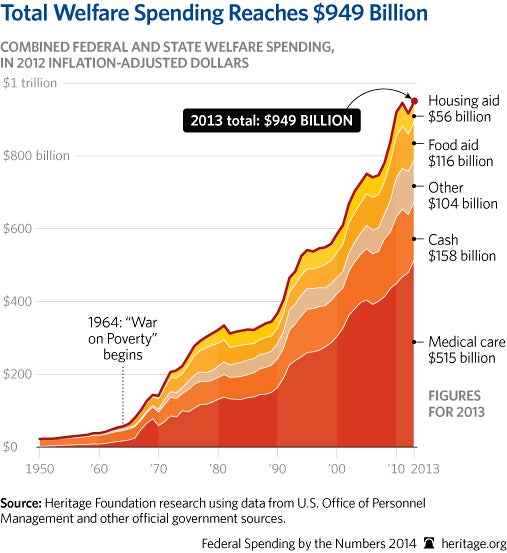
- In FY 2012, the total cost of federal and state means-tested welfare programs reached nearly $950 billion, an all-time high. Welfare spending has increased 16-fold since the federal government began the “War on Poverty” in the 1960s and is projected only to increase. This does not include spending on Social Security or Medicare.
- Today, there are roughly 80 federal means-tested welfare programs, including major programs like Medicaid, food stamps, the refundable Earned Income Tax Credit, public housing, Supplemental Security Income, and Temporary Assistance for Needy Families.
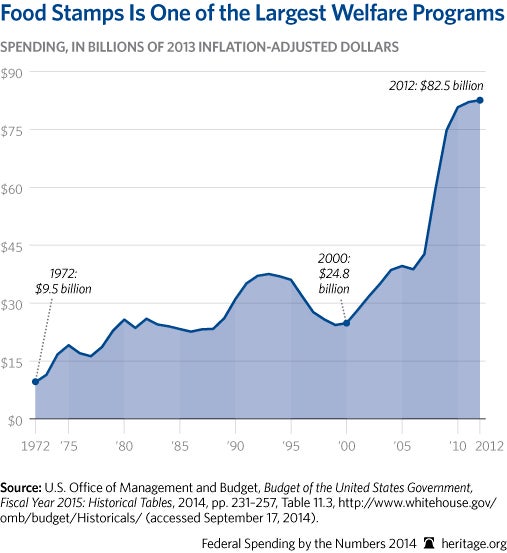
- Food stamps are one of the largest and fastest-growing means-tested welfare programs. Costs have doubled in inflation-adjusted terms since 2008. In 2012, more than 46 million Americans received food stamps every month.
- Total welfare spending should be rolled back to pre-recession (FY 2007) levels once employment rates recover, and, similar to the welfare reforms of 1996, work requirements for able-bodied adults should be inserted into welfare programs.
The Household Burden
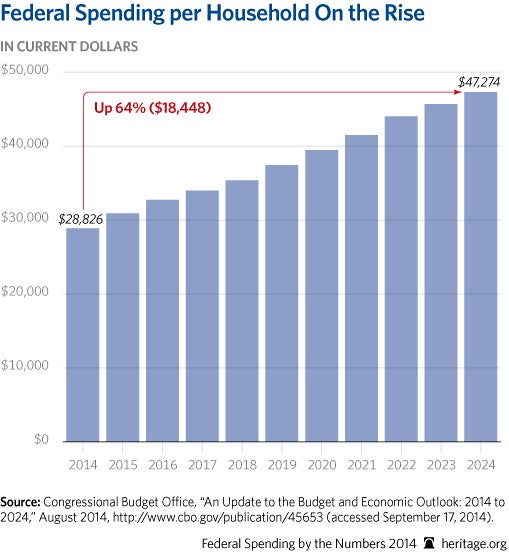
- In 2014, the federal government spent more than $28,800 per household and still racked up a $4,000 deficit per household. In 2024, spending per household will be $47,300.
- The federal government borrowed 14 cents of every dollar it spent in 2014.
- The national debt in 2014 exceeds $145,000 per household.
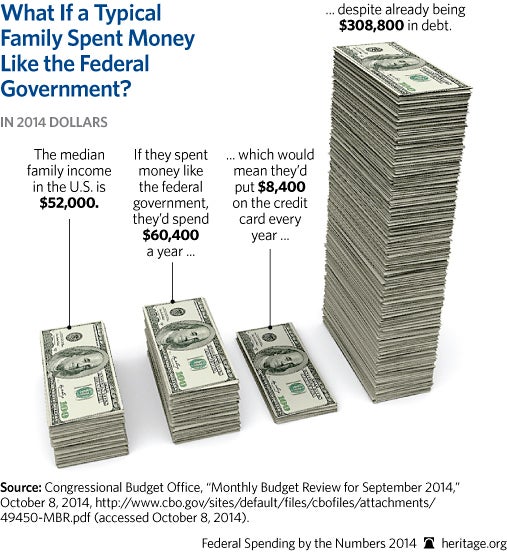
- In 2014, a median-income family will earn about $52,000. If a typical family followed the federal government’s lead, it would spend nearly $60,400 and put $8,400 on a credit card. This family would have already racked up more than $308,800 in credit card debt—like a mortgage, only without the house.
Discretionary Spending
- Congress determines discretionary budgets annually through appropriations.
- Discretionary spending is 34 percent, or one-third, of total spending.
- Discretionary spending grew by 48 percent after adjusting for inflation over the past two decades, from about $793 billion in 1994 to more than $1.17 trillion in 2014.
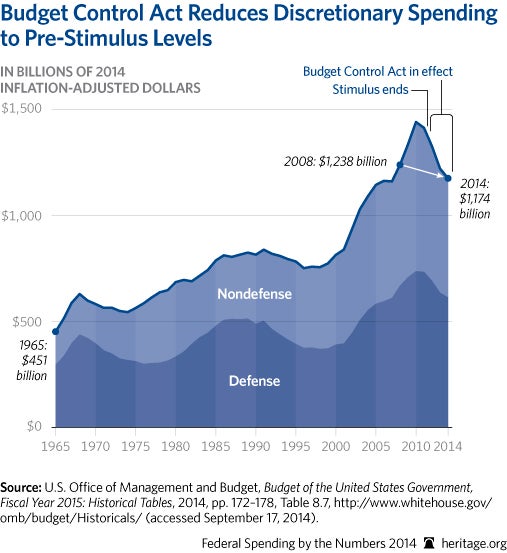
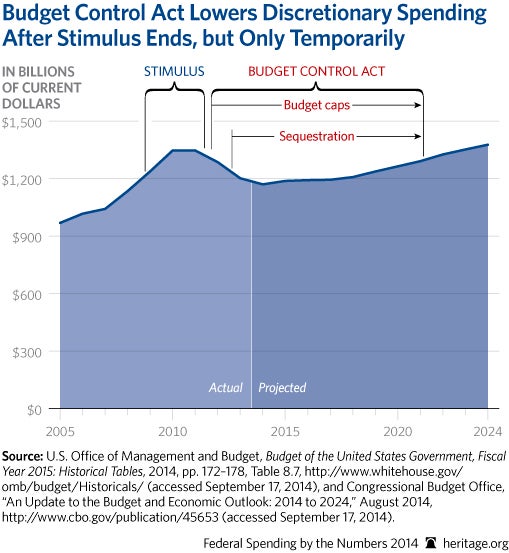
- The 2008 stimulus bill drove discretionary spending to record highs from 2009 to 2011. After the temporary stimulus ended, the Budget Control Act succeeded in returning discretionary spending to below its pre-stimulus level, after adjusting for inflation.
- National defense accounted for roughly two-thirds of discretionary spending in 1965. Today it is about half.
- The Budget Control Act caps, and sequestration cuts reduce, discretionary spending over 10 years, beginning in 2012 through 2021. Congress should adopt spending caps beyond 2021.
Battle of the Budgets: President Obama vs. House Budget Committee
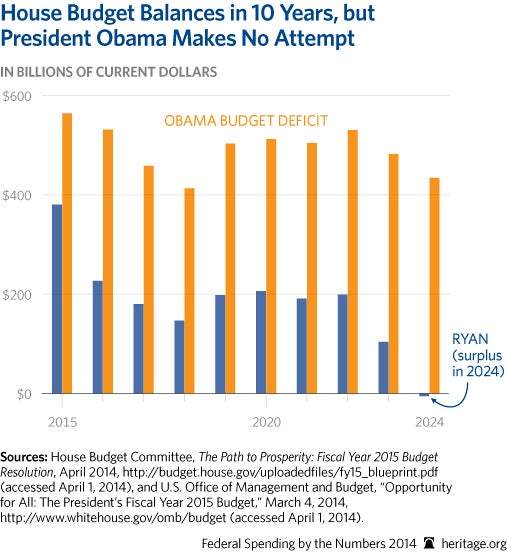
- The House budget balances the budget in 10 years by cutting discretionary spending and reforming health care entitlements and welfare programs.
- The House budget reduces spending with reforms to Medicare and Medicaid and, significantly, repeal of Obamacare.
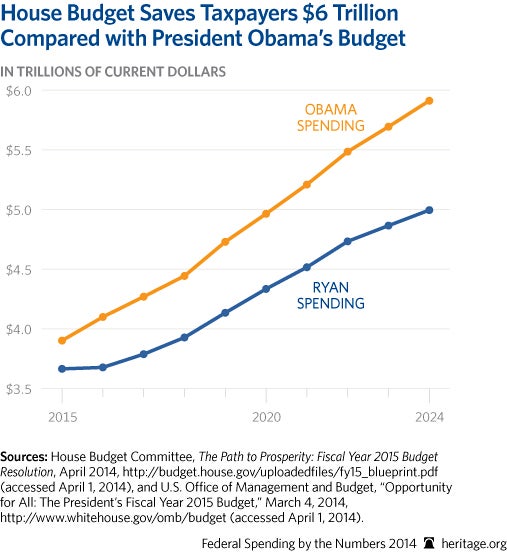
- In 2024, the House budget would spend $1 trillion less than President Obama’s budget.
- President Obama’s budget never balances, despite a more than $1 trillion tax increase over 10 years.
- The President’s deficit-reduction claims rely on budget gimmicks and tax increases. The proposal increases taxes by about $1.2 trillion, raising tax receipts to 19.9 percent of GDP in 2024—just short of record levels. Yet the budget still does not balance.
- Many of the President’s budget’s spending cuts are unrealistic, such as cancelling war spending that was never planned and then claiming savings.
- As the President’s budget adds billions for discretionary programs, it makes no significant reforms in entitlements—the largest contributors to spending and debt. The daunting spending explosion in Social Security, Medicare, and Medicaid is not addressed.
51 Examples of Government Waste
Mismanagement
- Medicare Part B paid nearly six times more than Medicare Part D for the same drugs and equipment to treat cancer. Medicare Part B paid $132.9 million for the same medical supplies for cancer treatment for which Medicare Part D paid $22 million.
- Two federal projects, one concerning the creation of a facility to produce fuel for nuclear reactors, and the other concerning a building to dispose of liquid waste from the first facility, remain incomplete. The National Nuclear Security Administration has already spent nearly $7 billion on these two unfinished projects, which were supposed to cost only $4 billion overall.
- The construction of the Department of Homeland Security (DHS) headquarters was supposed to be complete in 2003. It is nowhere near completion and has already cost taxpayers nearly $4.5 billion.
- $2.4 million intended for cotton subsidies was misused by Department of Agriculture employees to purchase laptops, two Ford Explorers, and office artwork, among other items.
- The Department of Defense is set to destroy $1.2 billion worth of ammunition because it does not have an effective inventory system to track supplies across the military services. The services each use different inventory systems, preventing proper data sharing and leading to excess materials.
- The Department of the Treasury spent $112.7 million on a public relations firm to raise domestic and international public awareness of the new dollar bill’s minor design changes.
- The Drug Enforcement Administration (DEA) paid an informant working for Amtrak $854,460 over 20 years to disclose passenger names. The DEA could have received this information free since the Amtrak Police Department, which has access to passengers’ names, is willing to share information with law enforcement partners.
- After Hurricane Sandy, the National Oceanic and Atmospheric Administration (NOAA) spent $500,000 to completely replace equipment that was not damaged beyond repair. Instead of repairing the equipment at lower cost, NOAA used the opportunity to purchase brand new equipment.
- The Internal Revenue Service will reportedly pay Microsoft $500,000 for one more year of custom support for Windows XP after failing to meet a deadline that would have secured its operating systems. The IRS is still paying for support for the outdated Windows XP, because it failed to complete the software move to Windows 7.
- The Metropolitan Washington Airports Authority (MWAA) has been accused of multiple cases of fraud in the development of the Washington, D.C.–area’s light-rail line to Dulles International Airport in northern Virginia. This includes nearly $139 million in purchases for which the MWAA cannot provide documentation.
- The Department of Defense spent nearly $500 million to purchase military transport planes for the Afghan Air Force, which have since been scrapped. The planes did not meet operational requirements, and the maintenance of the planes was too expensive for the Afghan Air Force.
- The Defense Department overpaid by $3.3 million for radios for the Afghan Army because the Defense Department did not follow contracting procedures, which would have prevented overpayment.
- The Department of Homeland Security has one of the largest vehicle fleets of any federal government agency, but according to a recent report by the DHS inspector general, 59 percent of the vehicles are driven less than 12,000 miles a year. In 2012 alone, these underused vehicles cost taxpayers between $35 million and $49 million overall.
- The Postal Service lost or cannot confirm receiving 37 trailers from a leasing company. The Postal Service continued to pay the lease for the trailers—despite the fact that they were missing—for two years before deciding to buy the titles for the missing trailers. The leasing and the titles purchase cost $287,000 for trailers that remain missing.
- The IRS bought $11.6 million worth of computer software that remains unused because the IRS did not have the space for it. This happened because the IRS did not have an effective way of keeping inventory for computer software.
- For more than $6 million annually, the Social Security Administration (SSA) is renting office spaces that remain largely unused or are being misused as storage spaces. According to an Office of the Inspector General report, several of the SSA’s offices are less than 50 percent occupied.
- Federal agencies paid nearly $50 million to the Department of Commerce’s National Technical Information Service for information that is mostly available free online.
- During the last few days of the 2014 fiscal year, the State Department purchased a $24,969 LED HD TV for the U.S. embassy in Kabul, Afghanistan.
- According to an Environmental Protection Agency (EPA) Inspector General report, employees at the EPA had used government credit cards to purchase $79,300 worth of “prohibited, improper, and erroneous” goods and services. Included in the purchases were gym memberships for EPA employees and their family members, DVDs, and academic memberships.
- The Mark Twain National Forest in Missouri received up to $100,000 from the U.S. Forest Service to add a 23rd bike trail to the park.
- The Denver Museum of Miniature Dolls and Toys was awarded $40,810 from the federal Institute of Museum and Library Services to create a digital inventory of its items.
- Grandiose oil portraits of former government agency heads continue to cost taxpayers roughly $20,000 for each new painting.
- U.S. Marshals Service wasted $2 million on “swag” gifts, like golf balls, mine-footballs, police-car-shaped stress toys, golf towels, and poker chips in order to build cooperation and camaraderie within the office.
- According to the Government Accountability Office, duplication of federal programs and services costs taxpayers $45 billion annually.
- Paralegals at the Patent Trial and Appeal Board were paid $5.1 million over four years as they watched Netflix, shopped online, and used social media while on the clock.
- The National Endowment for the Humanities provided $47,000 for undergraduate classes that teach students about laughing and the nature of humor. The classes will focus on how humor differs between cultures and how it can be used to deal with tragedies.
Corporate Welfare
- The Department of Agriculture’s Market Access Program provided $400,000 to the liquor lobby, which used part of those funds to transport foreign journalists to different breweries and distilleries in the southeastern United States.
- The International Trade Administration spent $284,300 to send American indie music executives on an international tour to promote the “independent” music industry.
- The U.S. Enrichment Corporation received $60 million from the federal government despite the company announcing plans to declare bankruptcy.
- One coffee plantation in Hawaii received a $25,000 grant from the Department of Agriculture to use solar power to dry coffee beans. Coffee bean farmers have been using the sun, in one way or another, to dry their beans for centuries.
- The Department of Agriculture awarded a $37,475 grant to teach northern Nevada farmers what kind of fruits and vegetables the Hispanic community enjoys and how to market them to Hispanics.
- The Department of Agriculture awarded a $50,000 grant to “Mary’s Alpaca,” an alpaca farm in The Plains, Virginia. This grant came from the Agriculture Department’s “rural development funds” and is intended to support the farm’s business of packaging, selling, and marketing alpaca manure.
- In an attempt to create more jobs in butterfly farming, the Department of Agriculture granted $500,000 to the Euchee Butterfly Farm to train Native American members of the Thlopthlocco Tribal Town in butterfly farming.
Questionable Federal Research
- In an attempt to fight childhood obesity and type II diabetes, the National Institutes of Health has granted more than $10 million toward the creation of video games that they hope will encourage children to eat healthier and exercise more. One of the games, “Escape from Diab,” is about five children who must get healthy enough to escape from a town full of obese people and their evil king.
- The National Institutes of Health spent $466,642 to research whether a lack of social skills is the reason why obese girls are asked on fewer dates, yet engage in more risky sexual behaviors than slimmer girls.
- The National Institutes of Health spent more than $2 million to study how singing in a choir affects the health of “minority elders,” including how choir singing promotes body strength and reduces falling incidents among the elderly.
- In an effort to understand whether gay men in Peru test positive for syphilis after treatment due to treatment failure or re-infection, the National Institutes of Health spent $330,000 to study the lifestyle and health of men who have sex with men and transgender persons in Peru.
- The National Institutes of Health spent $374,000 to study whether preschoolers will eat more vegetables after watching a puppet show about fruits and vegetables.
- The National Science Foundation granted more than $200,000 to a Yale University research project that is trying to determine how and why Wikipedia has a systematic gender bias. Researchers believe this is a step toward understanding and addressing gender disparities in academia.
- The U.S. Army awarded a $91,318 grant to the Virginia Department of Conservation and Recreation to count and determine the population of “little brown bats” in and around Fort Belvoir, Virginia. The Army hopes this survey will determine whether the bats should be added to the endangered species list.
- The National Institutes of Health spent $484,000 to study whether hypnosis can reduce the number and intensity of hot flashes in postmenopausal women and breast cancer survivors.
- The National Science Foundation spent $300,000 to study how bicycles work and how humans interact with them. The goal of the study was to find a way to make bike riding a more attractive method of travel in order to reduce society’s carbon footprint.
- NASA spent $360,000 for people to stay in slightly declined beds for 70 days to test the effects of gravity on humans over long durations of time. NASA had already conducted this experiment many times since the 1960s.
- NASA gave two grants totaling $237,205 to the University of Washington to study how rainfall effects the red crab’s annual migration to Christmas Island. Researchers hope this study will help them better understand the potential consequences of climate change for the red crabs.
- The Department of Agriculture’s Sustainable Agriculture Research and Education program awarded a $15,000 grant to the Rich Earth Institute in Vermont, which specializes in using human urine as fertilizer. This specific grant was to study if human urine could be a fertilizer for hay fields.
- The National Science Foundation granted $2.9 million to Butler University to create arts, dances, and poems at specific waterways in Indianapolis. The goal of the project is to educate citizens about their city’s urban waterways through artistic expression.
- The National Institutes of Health’s Center for Complementary and Alternative Medicine spent $387,000 to study the healing effects of Swedish massage on rabbits.
- The Department of the Interior’s U.S. Fish and Wildlife Service spent $10,000 to monitor the growth rate of saltmarsh cordgrass in an attempt to better understand how cordgrass should be treated and how it can be used to protect marshes.
- The National Institutes of Health’s Center for Research Resources spent $371,026 for a study to determine if mothers have the same neurological reaction when looking at pictures of their children and their dogs.
- The National Science Foundation spent $856,000 to study the wildlife habits of mountains lions through a scientific collar. The study included teaching mountain lions how to walk on treadmills and monitoring the amount of energy used in a mountain lion’s pounce.
- The National Institutes of Health spent $1,552,145 on the development of a smartphone game called “Kiddio: Food Fight.” The game is intended to teach parents how to convince their children to eat healthier foods.
Source information on file with The Heritage Foundation.


