Five years after the end of the Great Recession, the labor market remains weak. In May 2014, the unemployment rate stood at 6.3 percent, matching the highest rate following the 2001 recession. Labor force participation has fallen to levels not seen since the Carter Administration, when far fewer women worked outside the home than do today.
Policymakers and the media have paid close attention to these figures, but they have paid much less attention to another sign of the labor market’s condition: the length of the average workweek. This Backgrounder examines in detail the changes in the average workweek since the beginning of the recession.
During the 2008–2009 economic downturn, the average number of hours that U.S. employees worked each week dropped sharply. Since then, the length of the average workweek has recovered for most segments of the labor market—but not for workers in the bottom quintile of the wage distribution. The average workweek of an employee in the bottom quintile has fallen by over 3 percent—the equivalent of more than an hour each week—since 2007. These reduced hours have cut the incomes of low-wage workers by approximately $500 a year.
All of this has happened even before the Affordable Care Act’s (ACA) financial penalties for hiring full-time low-wage employees legally take effect. The ACA, known as Obamacare, also subsidizes low-income and moderate-income employees who work part-time. When fully implemented, Obamacare will put further downward pressure on hours for low-income workers.
Shift to Part-Time Employment
Average workweeks typically shrink during recessions. Employers cut back on overtime, reduce regular hours, and shift employment to part-time employees. During recovery, employers reverse these trends and the workweek returns to its previous level. However, during and after the Great Recession, this pattern has held only partially.[1]
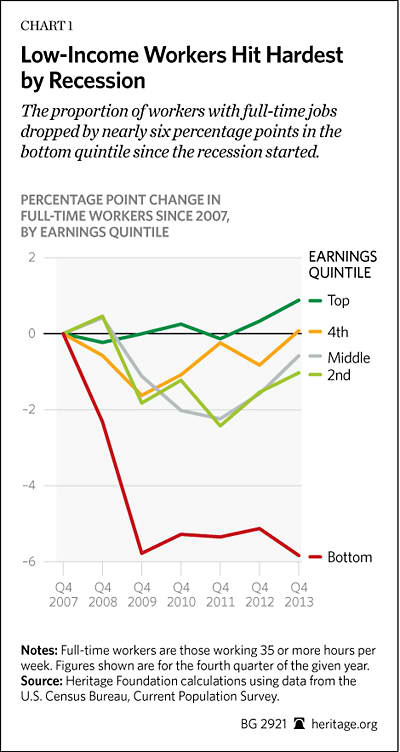
Between the end of 2007 and the end of 2009, the proportion of employees with full-time hours in the bottom four wage quintiles dropped significantly.[2] The probability of full-time employment fell the most for those with the lowest pay: those in the bottom quintile.
Full-time employment rates recovered for the middle three quintiles between the fourth quarter (Q4) of 2009 and Q4 2013. On net, the change in the proportion of workers in these quintiles with full-time hours was not statistically significant between Q4 2007 and Q4 2013.[3]
Not so for workers in the bottom income quintile. The proportion of full-time employees in the bottom quintile dropped 5.8 percentage points between the end of 2007 and the end of 2009, falling from 60.0 percent to 54.2 percent. Since then, it has not recovered, remaining at 54.2 percent in Q4 2013. In the top quintile, by contrast, full-time employment grew slightly (0.9 percentage point).
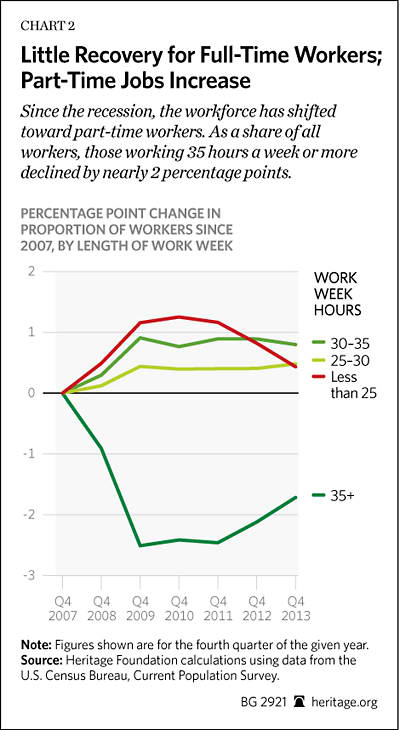
The decline in full-time jobs among low-income workers is large enough that it affects the economy-wide averages. In Q4 2007, the proportion of employees who worked full-time (at least 35 hours a week) stood at 82.6 percent. Two years later, that figure dropped 2.5 percentage points to 80.1 percent and increased only slightly afterward. By Q4 2013, the proportion of full-time workers still stood at 80.9 percent, down 1.7 percentage points from pre-recession levels. Conversely, the proportion of employees who worked fewer than 35 hours per week increased, with nearly equal increases in the proportion working fewer than 25 hours, between 25 hours and 29 hours, and between 30 hours and 34 hours a week.
Declining Hours
Another way of examining the data involves examining changes in the length of the average workweek. A shift from full-time employees to part-time employees obviously reduces average work hours, as does a decrease in the length of full-time schedules (such as from 40 hours to 35 hours a week), reduced overtime, and changes in part-time schedules. Examining the average workweek shows how hours have changed for workers of all workweek lengths.
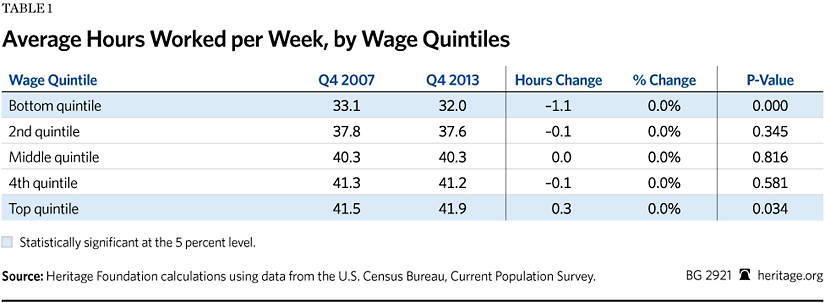
Table 1 shows the average workweek across income quintiles in Q4 2007 and Q4 2013. Workers in the top quintile worked more hours than those in lower quintiles, while those in the bottom quintile worked the fewest hours.
The length of the average workweek did not change in a statistically significant way for the middle three quintiles of the income distribution between Q4 2007 and Q4 2013. In the top quintile, the average workweek expanded by one-third of an hour, but for workers in the bottom quintile, average hours worked per week declined by 3.4 percent over this period—1.1 fewer hours a week. This segment of the labor market has yet to recover from the 2008–2009 recession.
These reduced hours impose an additional financial burden on low-income Americans. With a decline of a little more than one hour per week, the average low-skill (therefore, low-wage) worker forgoes roughly $9.22 per week of pre-tax income. Yearly, that reduces his or her earnings by $470.[4]

In making these comparisons, it is important to compare the same quarter year-over-year. The average workweek of employees in the bottom quintile fluctuates wildly in the summer as high school and college students enter the labor force and take relatively low-paying jobs. However, even in the summer, the average workweek for employees in the bottom quintile remains shorter than it was in Q4 2007.
Workweek Changes by Industry and Occupation
The decline in the average workweek in the bottom quintile has not occurred uniformly among occupations or industries. Five industries recorded statistically significant reductions in average hours for workers in the bottom quintile between Q4 2007 and Q4 2013: (1) retail trade; (2) manufacturing; (3) construction; (4) public administration; and (5) arts, entertainment, and recreation. These industries collectively employ 37 percent of workers in the bottom quintile.[5] Only in two industries—educational services and information—did the average workweek for employees in the bottom quintile rise, and only by a statistically insignificant amount.
Table 2 and Table 3 show the change in hours by industry and occupational group, respectively. The tables are ranked by the statistical significance of the total change in average weekly hours between Q4 2007 and Q4 2013. The p-value shows the probability that this measured change reflects random chance.[6]
The largest significant decline occurred in arts, entertainment, and recreation, where the average workweek was shortened by 10.1 percent. The average worker in this industry in the bottom quintile today works the equivalent of five fewer weeks a year than before the recession. The most statistically significant decline in hours occurred in retail jobs. Despite the fact that retail sales have risen 2.6 percent above pre-recession levels, the average workweek for persons employed in the retail industry and in the bottom quintile dropped by 5.7 percent—nearly two hours per week.[7] That amounts to roughly three fewer workweeks per year. The 6.8 percent drop in workweeks in the construction sector probably reflects the burst of the housing bubble.

While only five industries experienced a statistically significant decline in working hours of employees in the bottom quintile, 18 of the 20 industrial sectors experienced a decrease in average hours. The collective decrease in the 13 sectors with individually insignificant decreases was statistically significant.[8]
Changes in work hours varied across occupations as well. Of the 22 different occupations used in this analysis, 18 had decreases in average workweeks for workers in the bottom quintile. Among these, six experienced statistically significant drops: (1) office and administrative support, (2) sales, (3) transportation and material moving, (4) production, (5) construction, and (6) protective service occupations. These six occupations collectively account for half of all jobs held by workers in the bottom quintile.
The changes in hours of the remaining 12 occupations with individually insignificant differences became significant when evaluated collectively.[9] Four occupations experienced higher average hours, but only one with statistical significance.[10]
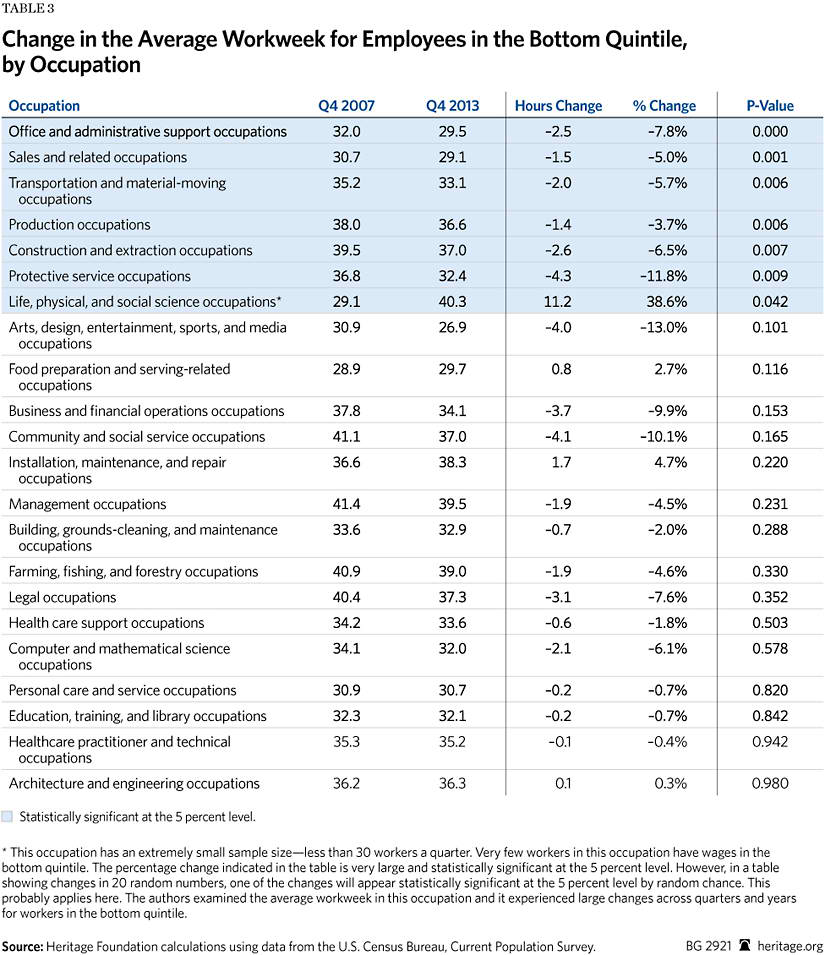
Protective service occupations experienced the largest drop (11.8 percent), a decline of more than four hours per week. That translates into six fewer weeks of work a year.
Entry-level jobs play a significant role in helping low-wage workers to build their personal human capital by gaining experience. Most Americans started out earning within a dollar of the minimum wage. Most of these workers also quickly earned promotions to higher-paying jobs.[11]
Workers with full-time schedules earn raises and promotions significantly faster than do part-time employees. Full-time minimum-wage workers are 10 percentage points more likely to be promoted to a higher-paying position within a year than are part-time minimum-wage employees who work between 10 and 19 hours a week.[12] Thus, reduced work hours not only reduce take-home pay through shorter workweeks, but also slow the process of accumulating skills that would allow low-wage workers to command higher pay in the future.
Differences by Education Level
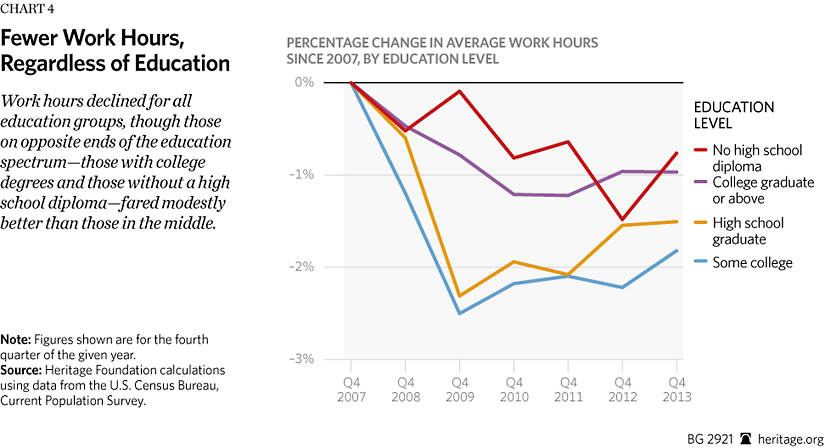
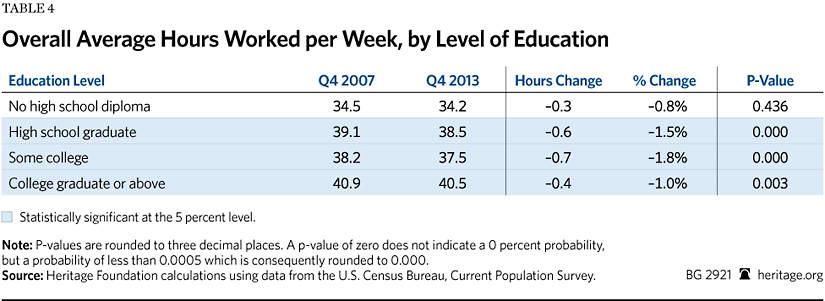
Individual human capital plays a significant role in wage mobility, and education remains one of the primary means of accumulating human capital. Between 2007 and 2013, the proportion of workers who had earned at least a college degree increased by 2.7 percentage points. However, a college degree did not necessarily protect workers from reduced work hours. The average workweek fell for employees of all educational levels, with the greatest proportionate decrease occurring among workers who had some college education (–1.8 percent) and the smallest drop occurring among high school dropouts (–0.8 percent). College graduates still work about 1 percent less than they did prior to the recession.
This picture shifts when focusing on workers in the bottom quintile—the only group of workers to experience statistically significant reductions in hours. Workers with a college degree or more who are in the bottom quintile had the largest decrease in hours of any educational category: a 9.9 percent reduction amounting to 3.6 fewer hours a week. Workers with some college education or at most a high school or GED diploma saw their work hours fall roughly 4 percent. The average workweek of high school dropouts did not change significantly.
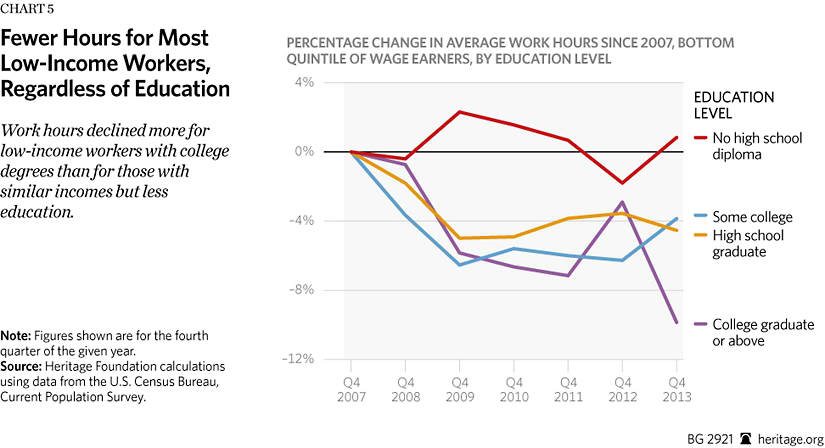
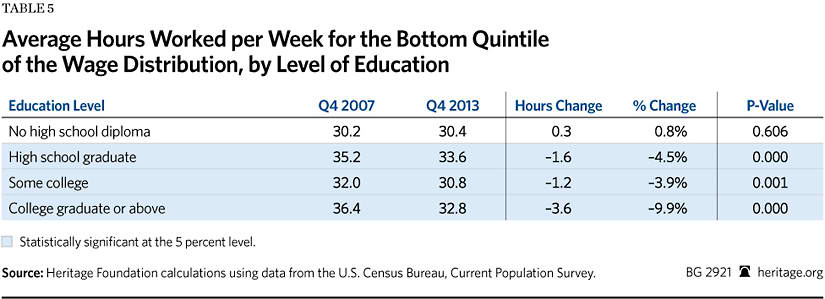
In 2007, before the recession, college-educated workers put in the longest workweek of all education groups in the bottom quintile. By 2013, the average workweek of high school graduates exceeded the workweek of college graduates.
Differences by Age
Breaking down the data by age can illuminate which demographic segments of the labor market bore the largest burden of the recession. The hours for workers ages 55 and older saw the smallest decline during the recession and subsequently recovered. This happened in addition to the increase in labor force participation among older workers during this period.[13] Younger workers still struggle with declining work hours.
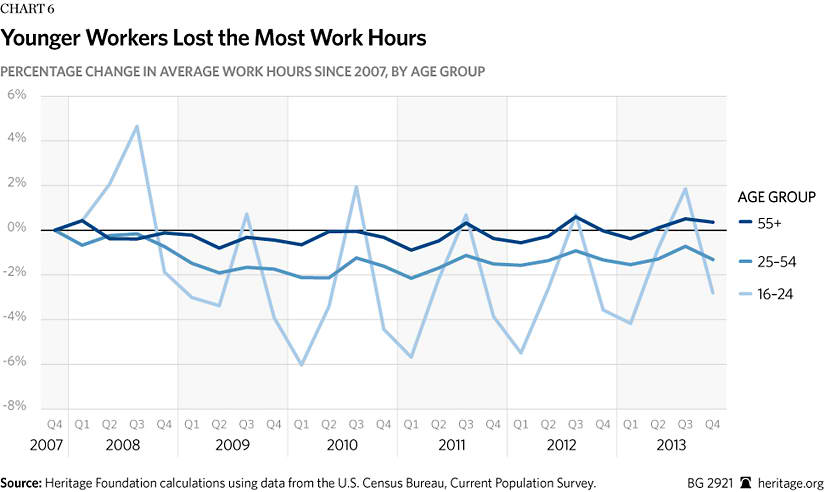
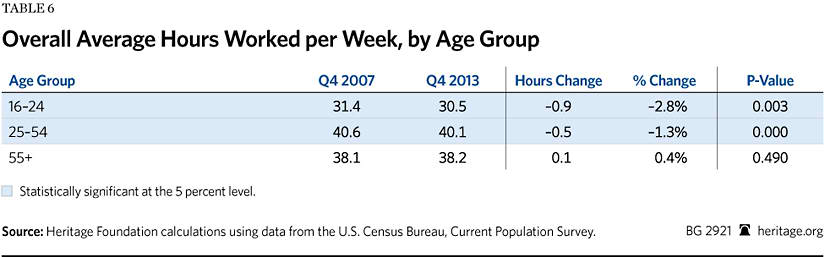
Younger workers, many still enrolled in school, unsurprisingly have highly seasonal workweeks, which rise during school breaks. This explains the spikes in the third quarter (July–September) each year for 16- to-24-year-olds. The workweek among the young dropped significantly, a decrease that comes in addition to sharply lower labor force participation and higher unemployment.[14] For the middle group—prime-age workers between 25 and 54—the overall workweek declined by 1.3 percent.
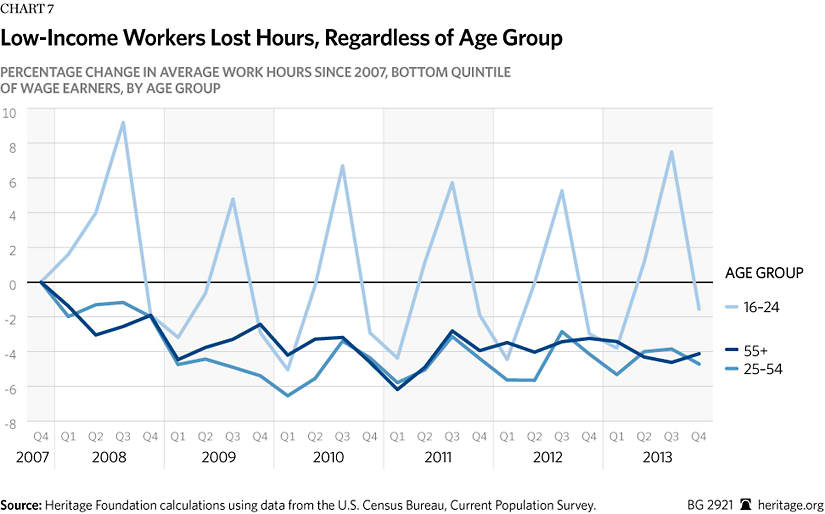
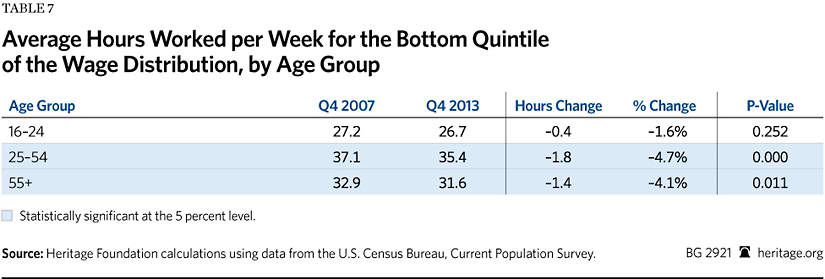
Focusing on the bottom quintile, the workweek for 16- to-24-year-olds barely shifted throughout the recession, except for seasonal effects. However, the average hours for those older than age 25 dropped by more than 4 percent. Those in the bottom quintile of 25- to-54-year-olds lost 1.8 hours per week on average, while employees 55 and older now work 1.4 hours less per week than they did prior the recession.
Future Trends
Average working hours dropped for workers in the bottom quintile during the recession, and government policy will probably accentuate this trend. Obamacare creates strong incentives for employers to create and employees to prefer part-time jobs.
Starting in 2015, Obamacare will impose a $2,000 penalty tax on employers who hire full-time workers without offering them qualifying health benefits. Unlike wages and benefits, employers cannot deduct this penalty from their taxes, so the penalty costs businesses as much as raising a worker’s compensation by $3,279 would cost them.[15] Few employers of low-wage workers provide the expensive benefits necessary to comply with this mandate. Consequently, the law will soon raise the cost of hiring full-time workers in the bottom quintile by an average of 18 percent.[16] No penalty applies to hiring part-time employees.
Few businesses can absorb an 18 percent increase in their labor costs easily without a corresponding increase in productivity. When the Obamacare penalty takes effect, it will strongly encourage low-wage employers to cut their employees’ hours below 30 a week to avoid the penalty. Hundreds of employers, including nonprofits and local governments, have already announced their plans to do so;[17] when they do, the average workweek of low-wage employees will shrink further.
Obamacare also reduces the financial incentives for many Americans to work full-time. Employees generally work full-time for two reasons: to make more money than they would make at a part-time job and to receive health benefits. The ACA greatly diminishes these incentives. The law provides expensive health subsidies for workers with incomes between 138 percent and 400 percent of the federal poverty level, but only if their employers do not offer health benefits. These subsidies mean that many employees would make as much money working part-time, taking all of their compensation as cash wages, and collecting ACA subsidies as they would working full-time and taking part of their compensation as health benefits.
Dr. Casey Mulligan of the University of Chicago calculates that a parent with a total compensation of $28 an hour would make as much money working 30 hours a week and collecting exchange subsidies as he or she would make working 40 hours a week with employer-provided health benefits.[18] The law effectively removes the financial incentives for many Americans to work full-time. This will cause millions of Americans to prefer part-time jobs that provide them the same effective income as full-time positions. This will further shrink average workweeks.
The Congressional Budget Office has estimated that from 2017 to 2024, the total number of hours worked will decline by up to 2 percent because of provisions in the Affordable Care Act that will reduce both the demand for and the supply of labor—particularly the labor of less-skilled workers. The reduction in hours would amount to a decline of 2.5 million full-time equivalent jobs by 2024.[19] In the long run, these shorter workweeks will reduce experience and human capital growth and slow wage growth for millions of workers.
Implications
Average working hours fell during the Great Recession for most Americans—far more than during the previous two recessions.[20] Since then, work hours have recovered for most of the population, but not for workers in the bottom quintile. The average workweek remains 3.4 percent below its pre-recession average for these employees. For low-income workers in the retail and entertainment and recreation industries, the reduced hours amount to almost an entire month less work a year. The poor economy has most hurt the very workers who need longer workweeks in order to gain both income and skills.
In the United States, workers in the lowest quintile of the wage distribution also work the fewest hours. In part, this is causal: Workers with less experience earn lower wages. Conversely, the most highly paid 20 percent of Americans work the most hours. The further decline of working hours at the bottom will make it harder for low-income workers to acquire the skills and experience necessary to get ahead. Inequality dominates the current political discussion, but the prospect of boosting income mobility through experience and longer hours deserves attention.
Obamacare will make this situation worse. The law raises employers’ cost of hiring low-wage workers full-time by an average of 18 percent. This will discourage employers from creating full-time jobs for these employees. The law also diminishes the financial benefits of full-time work for many low-income and moderate-income Americans. Under the ACA, many Americans will make as much working part-time and collecting exchange subsidies as they can make by working full-time with employer-provided health insurance. Both factors will push average workweeks down. This in turn will reduce employees’ human capital accumulation and compensation growth.
—Filip Jolevski is a Research Assistant and James Sherk is Senior Policy Analyst in Labor Economics in the Center for Data Analysis, of the Institute for Economic Prosperity and Opportunity, at The Heritage Foundation.
Appendix
Methodology
This Backgrounder uses the Merged Outgoing Rotation Group (MORG) data from the Current Population Survey (CPS) from October 2007 to December 2013. We used the files maintained by the National Bureau of Economic Research (NBER), which the NBER makes available publicly online.[21]
We constructed hourly wages by dividing usual weekly earnings (earnwke) by usual hours worked (uhourse). This takes into account salaried workers as well as workers paid by the hour.
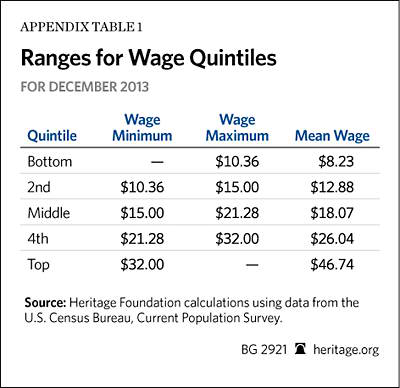
We used this hourly wage variable to construct quintiles of the wage distribution for each month. The ranges for the quintiles vary over time as the nominal wage distribution shifts. In the last month of the analysis, December 2013, quintiles broke down as indicated in Appendix Table 1.
When we refer to average workweek or weekly hours, those numbers represent the “usual hours worked” variable from the CPS MORG: uhourse.
For the industry breakdown, we constructed an industry variable to replicate the North American Industry Classification System at the two-digit level. This was done by aggregating the industry variable (dind00) of the CPS MORG to the two-digit level. For occupations, the analysis is based on the occupational variable labeled docc00 in the NBER data files.
The category for different levels of education was derived from the grade92 variable that measures which grade the respondent has completed. The variable for age groups was created similarly using the age variable from the MORG files.
A spreadsheet with the detailed outputs of the calculations and a Stata do-file with the commands necessary to replicate these results are available upon request from The Heritage Foundation’s Center for Data Analysis.


