The U.S. government was barely involved in the housing finance market before the Great Depression. Subsequently, the Federal National Mortgage Association (commonly known as Fannie Mae) and the Federal Housing Administration (FHA) attained an almost legendary status for having “saved” the housing market in the 1930s with various forms of government guarantees. The perceived success of these institutions has led many—including many Members of Congress—to suggest that the housing market cannot properly function without a government guarantee. One of the great ironies is that the government programs initiated in the early 1930s were nationalized versions of innovations that had long existed in the private market.
Furthermore, evidence suggests that these government programs were not the main drivers behind the postwar housing boom that followed the Depression. There is little reason, therefore, to argue that the housing market needs a government guarantee.
This report discusses key elements of the Depression-era mortgage market and presents evidence that eliminating the mortgage interest rate subsidy generated by the government-sponsored enterprises (GSEs) would have minimal impact on the U.S economy. Congress should eliminate government guarantees from the U.S. housing finance market because:
- The government guarantees that originated in the 1930s were nationalized versions of market-driven innovations. Instead of eliminating financial risk, nationalizing these innovations only expanded that risk and shifted it onto taxpayers.
- The government guarantees in the housing finance system were not the main driver of the postwar housing boom, and they remained a small part of the market until the 1990s. As the GSEs became dominant, they nearly destroyed the housing market.
- The GSE system is one of the main ways that government policy has encouraged investments in the housing sector at the expense of other areas of the economy. Government policy should not favor one industry over another.
- After billions in taxpayer subsidies, the long-term homeownership rate in the U.S. has remained virtually unchanged—from 63.9 percent in 1968 to 65 percent in 2013. Yet taxpayers remain responsible for approximately $4 trillion in GSE guarantees.
- Removing the government guarantee from housing finance would have minimal impact on the overall U.S. economy and would likely result in lower housing costs, less personal debt, and higher personal income and savings.
Housing Finance Before the Great Depression
Many people have argued that the housing finance market was too disorganized before the federal government got involved in the 1930s.[1] Before the 1930s, many homeowners had various types of interest-only, short-term mortgages with balloon payments that often required refinancing, and interest rates and housing prices varied widely from region to region, leaving the U.S. market fragmented.
In general, this structure resulted from two aspects of American culture in the early years of the country. First, Americans held a broad mistrust of banking and personal debt as risky and reckless, thus biasing lending markets toward short-term loans. Second, partly due to these misgivings, state governments—rather than a centralized federal authority—exercised regulatory control over their own banks. The banks in this financial system could not pool their deposits beyond their localities and could not diversify their risks because laws limited them to only one office.
However, the home financing market also consisted of life insurance companies, mutual savings banks, commercial banks, and building and loan associations (B&Ls). B&Ls, the key lending institution of this era, were localized mutual funds through which small groups of people paid dues that were then pooled to finance home loans. The B&Ls themselves were an innovation that surfaced to alleviate restrictive state banking laws. For instance, state laws in the pre-Depression era dictated a variety of specific provisions in loan contracts, such as the length of the contract (the term) and the loan-to-value (LTV) ratio.
With no particular pattern, some states prohibited banks from loaning more than 50 percent, 67 percent, or 80 percent of the value of a home for terms typically between five years and 15 years. For example, in Pennsylvania from 1913 to 1937, banks could not legally lend more than two-thirds the value of the property (i.e., an LTV of 66.7 percent), and loans could not exceed a term of 15 years.[2] Yet for all of its shortcomings, the pre-Depression financial system funded an unprecedented expansion of housing. Homeownership in the U.S. increased more during the 1920s than during the previous 30 years.[3]
Life insurance companies, mutual savings banks, and commercial banks more than tripled their combined holdings of residential mortgages in the 1920s, but B&Ls funded the bulk of the expansion.[4] By 1929, B&Ls accounted for 50 percent of all outstanding nonfarm mortgages, mutual savings banks accounted for 19 percent, and insurance companies and commercial banks accounted for less than 30 percent combined.[5] From 1919 to the peak of the market in 1927, the number of B&L associations in the U.S. grew from approximately 8,000 to 13,000.
The B&Ls relied on second mortgages as a key feature of their expansion. Under this arrangement, borrowers would take out a first mortgage—usually an interest-only loan from a bank or other non-B&L institution—to finance a portion of the home and finance the remainder of the cost with a second mortgage from a B&L. One example of this innovation was the Philadelphia Plan, an arrangement started by B&L associations in Philadelphia. This plan, in which a portion of the borrower’s monthly payment was used to buy stock in the B&L, was used for at least 50 years prior to 1929.[6]
The Philadelphia Plan provided home mortgages with terms that exceeded 11 years and cost the borrower 2 to 12 percentage points less than what could be obtained from other institutions in that era.[7] As of 1928, 3,400 B&L associations existed in Philadelphia alone. In the early history of these associations, borrowers commonly paid a premium on the interest rate because the demand for loans was so high. Although other cities did not have a Philadelphia Plan, B&Ls in various regions of the U.S provided longer-term loans than were available through other institutions. For example, the longest term available in Boston appears to have been eight years, while 20-year loans were available in New York.[8]
Unlike most banks, the B&Ls provided loans that included both principal and interest payments (i.e., amortized loans) so that borrowers did not need to continuously refinance the entire principal. While most home mortgages prior to the 1930s were not fully amortized, the B&Ls definitely pushed the market toward offering some form of principal reduction. Between 1920 and 1934, only 20 percent to 25 percent of all mortgages provided for no amortization.[9]
In a manner eerily similar to the crash of 2007, the housing boom of the 1920s—fighting against regulations with private innovation, expansionary monetary policy, and federal promotion of homeownership—was followed by a severe crash at the end of the decade.[10] Despite the crash, the manner in which these highly regulated pre-1930s markets evolved during the boom provided the impetus for the government programs instituted in the wake of the Great Depression.
The Crash and Depression Era
Two groups of B&Ls differed in how they financed the 1920s boom and how their policies influenced post-crash government interventions. The smallest B&Ls, frequently owned by real estate professionals and run on a part-time basis, had been the leaders in innovatively financing the boom. On the other hand, the larger B&Ls had warned for years that these risky innovations were fueling an unsustainable boom. The market crash in late 1927 virtually wiped out the smaller B&Ls, but the larger, less risky, B&Ls survived and morphed into savings and loan associations (S&Ls).
These larger B&Ls were well organized politically and, through their trade group, helped to draft the legislation that created the Federal Home Loan Bank System (FHLB) in 1932.[11] The FHLB system was designed to provide credit only to its member institutions, virtually all of which were heavily involved in providing home loans. Each FHLB was set up as a separate corporate entity with its own board of directors, but the FHLBs were jointly and individually liable for all debts in the system.[12] The FHLB system was initially given a $215 million line of credit with the U.S. Treasury.
Another key government intervention in the housing finance market was the creation of the Federal Housing Administration (FHA) in 1934. Congress and the Roosevelt Administration created the FHA to boost employment in the construction industry, and its principal function was to provide government insurance for long-term, low-down-payment, fully amortized loans. The FHA became a counterbalance to the FHLB system because it helped the S&Ls’ competitors, specifically financing the very types of loans that the B&Ls had warned were too risky during the 1920s boom.
Fannie Mae was created soon after the FHA to purchase mortgages insured by the FHA and other government agencies. Fannie Mae was supposed to spur construction by starting a secondary mortgage market, but it effectively became a direct lender to mortgage companies and builders through “pre-commitments” to buy loans that did not yet exist.[13]
Fannie Mae and the FHA mostly helped mortgage companies, life insurance companies, mutual savings banks, and commercial banks to fund the segments of the market that the smaller B&L associations had funded in the 1920s.[14] In the late 1930s, the new S&Ls (members of the FHLB system) served local mortgage markets and small-scale builders, while FHA loans and Fannie Mae commitments primarily funded commercial banks and mortgage companies that financed large tract builders and multifamily projects.
Nationalized Innovations
The very first FHA-insured home mortgage was a fully amortized loan, with a 20-year term for a maximum loan amount of $16,000 and an LTV ratio of 80 percent. Yet the median home price in 1934 was only $5,304, which underscores the fact that the FHA was created to boost housing construction, not to reform the mortgage market.[15] The 80 percent LTV feature was the most notable liberalization at that time, but an immediate problem was that various states had their own (stricter) requirements. In response, the federal government sent “teams of Federal lawyers” to convince state legislatures to allow their lenders to make FHA-insured loans.[16]
The states quickly complied, and the use of the FHA loans increased. However, by 1941, FHA loans still accounted for less than 25 percent of all new mortgages.[17] Regardless of these programs’ pervasiveness, the government interventions appear to have pushed private financial institutions into extending the length of their loan contracts. Commercial bank loans went from an average length of about two years in the early 1920s to roughly 10 years in the late 1930s and 13 years after 1940.[18] S&L mortgage terms, which were traditionally longer in the first place, went from about 11 years in the early 1920s to 15 years as of 1947.[19]
The loan-to-value ratio is a more complicated story, but the government loan features do appear to have influenced the rest of the market in this area as well. For instance, LTVs for life insurance mortgages averaged between 44 percent and 53 percent from 1920 to 1934, and then increased to 82 percent by 1944. Commercial banks’ LTVs were around 50 percent throughout the 1920s and 1930s, but increased to 70 percent after World War II. S&Ls, which typically had the lowest LTV ratios, followed this trend and offered ratios of approximately 75 percent by 1947.
The main complicating factor is that the use of the second mortgage declined dramatically. In other words, this general increase in LTV ratios appears to indicate a major increase in debt, but the appearance is misleading because the new, higher LTV loans were typically the only mortgage on the property.[20] Because all of this innovation—started by the free market and nationalized by the government—eventually coincided with another housing boom, the government has been credited with helping the housing market recover from the 1930s crash.
The “Postwar” Boom
The next major boom in housing corresponded roughly with the end of World War II. Between 1940 and 1960 the U.S. homeownership rate increased from 44 percent to 62 percent.[21] This period also coincided with a general economic expansion after World War II, which tends to overshadow the fact that the housing market started taking off in 1940—before the U.S. entered the war and five years before Germany and Japan surrendered. Yet the record is clear that the homeownership rate reached and then surpassed its pre-1930s level between 1940 and 1945, so this increase was not simply part of the postwar economic recovery.[22]
Indeed, research suggests that it is “likely that there was some commonality between the drivers of the increases in non-farm home ownership in the pre-1930s and the post-1940 periods.”[23] A key factor—which explained approximately 17 percent of the homeownership rate increase from 1940 to 1960—was that people began buying homes at much younger ages than previously.[24] Other research suggests that increasing income accounted for up to 50 percent of the increase from 1940 to 1960, and up to 20 percent may have resulted because tax benefits became more pronounced as income increased during this period.[25]
Given these estimates (17 percent, 50 percent, and 20 percent), the mortgage finance changes brought about by the federal government’s direct involvement could explain at most 13 percent of the growth in homeownership between 1940 and 1960. One study estimates that the Veterans Administration (VA) programs—similar to the FHA insurance but only for returning service members—alone accounted for approximately 7 percent of the overall increase from 1940 to 1960, an estimate well within the maximum range of 13 percent.[26] Even a slightly altered window of time during this expansion does not change the fact that these federal housing programs were only a small part of the mortgage market.
For example, from 1949 to 1968, the year that Fannie Mae was allowed to purchase non-government-insured mortgages, all government-backed mortgages never accounted for more than 6 percent of all mortgages in the market in any given year.[27] In other words, at least 94 percent of the mortgage market for this entire period received no federal backing of any kind.
It is plausible that these government interventions were partly responsible for the increase in homeownership during this period. These programs almost certainly drove private lenders to offer loans with longer terms and lower down payments. However, the evidence shows that these programs were not the main driver of increased homeownership before the 1970s. The historical record indicates that the housing finance system can properly function without a government guarantee.
The GSEs Arrive
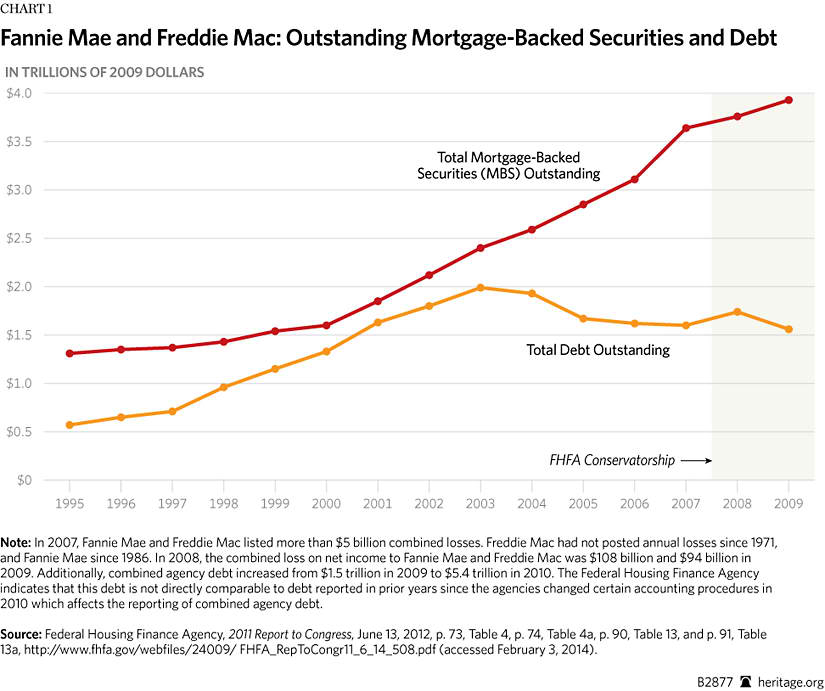
Although Fannie was created in the 1930s, it was a purely federal agency until 1954 and did not complete its transition into a government-sponsored entity with private shareholders until 1970. The Federal Home Loan Mortgage Corporation (commonly known as Freddie Mac) was created in 1970 as part of the FHLB system and became a GSE with private shareholders in 1989. Thus, the system that officially came apart in 2008, with two GSEs both purchasing non-federally insured private mortgages and issuing mortgage-backed securities (MBSs),[28] did not really begin until the 1980s.
As GSEs, Fannie and Freddie did not have an explicit backing by the federal government. However, both entities benefited from a line of credit with the U.S. Treasury, an exemption from filing financial statements with the Securities and Exchange Commission, and an exemption from state and local income taxes. The markets have always (correctly) understood that the government would ultimately back the GSEs, which gave the GSEs a cost advantage that private lenders simply could not match. In particular, the GSEs were able to borrow more cheaply than private financial institutions because of this government relationship.
Eventually, the GSEs used this cost advantage and the political mantra of promoting affordable housing to become major players in the housing finance market. From 1990 to 2003, Fannie and Freddie went from holding 5 percent of the nation’s mortgages ($136 billion) to more than 20 percent ($1.6 trillion).[29] Ironically, one main reason that Fannie became such a large force in the market was the S&L industry collapse in the late 1980s, due to high exposure to interest rate risk (the value of its assets declined when rates rose).
Fannie Mae was exposed to the same risk and also became insolvent, but it was given a pass by the federal government.[30] This act of “regulator forbearance” only prolonged Fannie’s collapse. In 2008, just before being placed under the conservatorship of the Federal Housing and Finance Agency (FHFA), Fannie and Freddie held debt of nearly $8 trillion, an amount that exceeded the total debt of the U.S. Treasury.[31] Taxpayers are now responsible for approximately $4 trillion in GSE debt and MBS guarantees.
Despite the GSEs becoming the dominant financing source in the U.S. housing market in the 1990s, the U.S. homeownership rate barely budged for most of this period. For instance, in 1968, when Fannie began its conversion to a GSE and was allowed to purchase non-federally insured mortgages, the homeownership rate was 63.9 percent. In 1994, just prior to a major expansion in the GSEs’ activity, the rate was 64 percent. The ownership rate did increase to 69 percent by 2004, but after the financial crisis quickly declined to 65 percent—just 1 percentage point higher in 2013 than in 1968.[32] If taxpayers had not been subsidizing the GSEs, the fact that the long-run homeownership rate barely moved over this period would not matter.
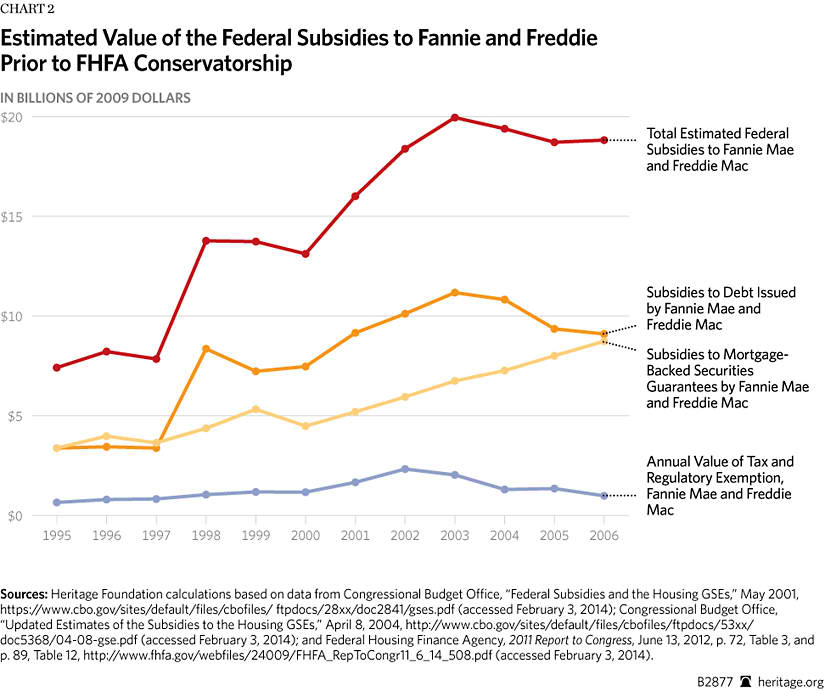
How Much Were the Subsidies Worth?
Because of their special status with the U.S. government, Fannie and Freddie have enjoyed an estimated annual subsidy ranging from a low of about $7 billion in 1995 to a high of approximately $20 billion in 2003. Research shows that the bulk of this subsidy has stayed with the GSEs and that homeowners may have benefited by paying, at most, 0.50 percent less in interest rates than if there had been no GSE subsidy.[33] Given the relatively small impact on interest rates, along with the minor long-term impact on homeownership rates, it is difficult to argue that the GSE subsidies were necessary for the housing market to function properly. This conclusion is supported by The Heritage Foundation’s macroeconomic simulation of removing these government guarantees from the housing market.
The Economic Effects of Fannie and Freddie Reform
In this section, we highlight some of the key results from Heritage’s January 2012 dynamic macroeconomic simulation of eliminating the GSEs. The full set of these results, along with the methodology for the simulation, are available in the original Special Report.[34] In general, the simulation shows that the U.S. economy would remain stable as the housing GSEs’ market activity is wound down.[35]
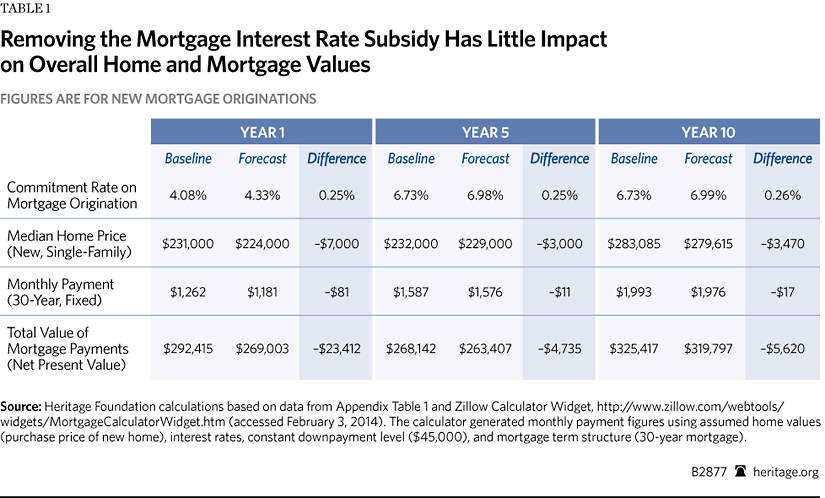
Narrowly focusing on the housing market, the model predicts that removing the government guarantee from the market will have a relatively small impact on the economy and national housing market. The results in Table 1 show a mild increase in the national annual average 30-year mortgage rate (the commitment rate), along with a modest decrease in median home prices and monthly payments on the typical 30-year mortgage. For instance, in the first year of the forecast period, the average interest rate is 0.25 percent higher, while the typical (new) single-family home price is $7,000 less. The net result of these changes is a lower monthly payment of $81 on the 30-year fixed mortgage. By the tenth year of the forecast, the typical monthly payment is $17 lower.
The simulation results also indicate that sales of new homes in the U.S. would fall an average of 0.81 percent and sales of existing homes would fall 1.5 percent over the 10-year forecast period. The results also suggest that real household incomes would rise over the forecast period. Consequently, U.S. homeownership would decline negligibly by an average of 0.11 percent over the 10-year forecast period. These results assume the 30-year mortgage continues to exist in the market, and the existence of non-government-insured 30-year mortgages in the current U.S. market shows that this assumption is plausible at the very least.[36]
As households respond to the higher borrowing costs in mortgage markets, the level of housing-related and mortgage-related debt declines in the U.S. economy. (See Table 2.) Total mortgage acquisitions fall roughly 1.42 percent relative to baseline levels, home mortgage acquisitions fall 2.01 percent, and total outstanding home mortgages decline by approximately 0.69 percent. The U.S. housing stock and housing starts experience negligible changes: U.S. housing stock (single-family and multifamily), excluding stock of mobile home units, decreases an average of 0.007 percent relative to the baseline, while housing starts (single-family and multifamily) increase by 0.026 percent.[37]

Real personal income levels trend positive beyond the first few years of the forecast horizon largely because of changes in nominal personal interest income. Nominal personal interest income increases an average of 1.2 percent relative to baseline levels in the five-year forecast period and 1.6 percent relative to baseline levels over the 10-year forecast period. The change in personal interest income reflects changes in an economy-wide mix of interest rates. This composite of interest rates in the model increases an average of 10 basis points (0.10 percent) per year relative to baseline levels over the 10-year forecast period.
As borrowing costs rise, particularly for mortgages, households reduce the amount of housing debt they hold. Gross private savings increase on average $820 million (0.024 percent) per year relative to baseline levels, and the nominal level of households’ financial liabilities declines an average $126 billion (0.75 percent) per year relative to baseline levels. While households reduce their financial debt levels, their holdings of other financial and non-financial assets decline relative to the baseline. Nominal household holdings of financial assets decline 0.52 percent, and holdings of real estate and other non-financial assets decline 0.07 percent. As a result, real household net worth declines an average of 0.19 percent relative to the baseline for the 10-year forecast.
Ceasing new GSE activity would remove a subsidy in the mortgage market—a subsidy that has induced households to take on more debt-related consumption. When it expanded GSE activity in the 1990s, Congress only temporarily increased the U.S. homeownership rate, and it did so by inducing many people to undertake risky loans. Eliminating the GSE-related government guarantees from the market would have minimal impact on the overall U.S economy and would most likely strengthen it in the long run.
What Congress Should Do
Congress should:
- Permanently shut down Fannie Mae and Freddie Mac and all of their subsidiaries.
- Ensure that any legislation to close Fannie and Freddie does not create a smaller version of the GSEs under a new name. Any such entity would surely evolve and grow, just as Fannie Mae and Freddie Mac did.
- While the GSEs remain in conservatorship, direct the Federal Housing Finance Agency to raise Fannie and Freddie’s mortgage guarantee fees (g-fees) immediately so that more private capital will flow to the mortgage market.
- Until Congress resolves the important reform issues surrounding the GSEs, the FHFA should not begin any new mortgage modification programs, specifically any principal reduction alternative (PRA) programs.
Conclusion
The U.S. government became increasingly involved in the housing market in the 1930s, and the perceived success of this involvement has led many people to suggest the private housing market cannot properly function without a government guarantee. One of the great ironies is that the government programs that were initiated in the early 1930s were nationalized versions of innovations that had long existed in the private market. Furthermore, nationalizing these advances did not eliminate financial risk, but only expanded risk and shifted it onto taxpayers.
Aside from the cost to taxpayers, the evidence shows that government guarantees were not a main driver of the postwar housing boom. They did, however, contribute to an unsustainable increase in homeownership in the 2000s. There is little reason, therefore, to argue that the housing market needs a government guarantee. Eliminating the GSEs—and their guarantees—would have minimal impact on the overall U.S economy and would most likely improve it in many ways. Congress should eliminate the GSEs and ensure that nothing remotely similar to these entities is ever created again.
—John L. Ligon is Senior Policy Analyst in the Center for Data Analysis and Norbert J. Michel, PhD, is a Research Fellow in Financial Regulations in the Thomas A. Roe Institute for Economic Policy Studies at The Heritage Foundation.