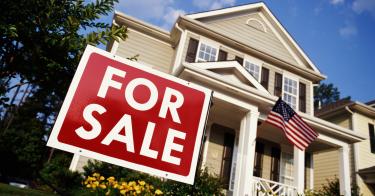
Business headlines say that inflation is down, yet countless Americans are struggling, particularly with finding somewhere affordable to live. How do we reconcile these seemingly contradictory notions? First, lower inflation means prices are rising slower but still rising. Second, housing inflation is being undercounted by official government metrics as much as 4-to-1.
The consumer price index from the Bureau of Labor Statistics is designed to measure the cost increase of a common basket of goods. Surprisingly, though, it doesn’t include the cost of housing.
The CPI tries to capture consumption but not anything considered an investment, which would include a home and any improvements to it, like installing a swimming pool. Similarly, things like the chlorine tablets used to maintain the swimming pool are also excluded since they’re considered part of an investment.
This isn’t a trivial fact because when the price of those tablets skyrocketed over 200% in 2022, that increase was nowhere to be found in the CPI. This is just one example of how the index undercounted the increase in the cost of living for many Americans.
>>> The Housing Crunch Is Causing Americans To Delay Marriage and Children
While it doesn’t directly measure the cost of homeownership, the CPI does try to estimate it by looking at renter surveys. Basically, the BLS uses the responses in these surveys to estimate not only the change in the cost of renting but also the change in the cost of homeownership through a category called “owner’s equivalent rent.”
If the cost of rent increases at the same rate as the cost of homeownership, then this methodology should theoretically create an accurate measurement of the increased cost of housing overall. The problem today is that the cost of homeownership has risen much faster than rents over the last three years.
Although rents are at a record high today, the premium to own a home vs. renting one has never been so large before. According to the CPI, rents have gone up 19.5% over the last three years, and the more-encompassing shelter component of the CPI has risen 19.4% over the same time.
According to the National Association of Realtors, however, the median sales price of existing homes is up 23.7% in the last three years. And interest rates on mortgages have more than doubled in that time, increasing the monthly mortgage payment even more.
The Federal Reserve Bank of Atlanta compiles a monthly homeownership affordability index, which estimates the cost to own a median-price home and compares that with the median household income. The index looks at not just how much a homeowner would need to pay in principal and interest but also homeowners’ insurance, taxes, and personal mortgage insurance.
In January 2021, the median price of a home was just under $300,000, while the interest rate on a 30-year mortgage was 2.7%. All in all, it costs $1,600 a month to afford a home, which is 28% of the median household income. That’s one of the most affordable ratios since the Atlanta Fed started keeping track of this metric in 2006.
>>> Home Prices: From American Dream to American Nightmare
By November 2023 (the most recent period for which figures are available), things had deteriorated. In just under three years, the price of a median home shot up to $363,000, while interest rates were 7.4%. Taxes and insurance also skyrocketed, helping drive the monthly cost of homeownership to an eye-opening $2,831.
That’s a 77% increase in just three years or four times the increase in rent counted by the BLS. It now takes 43.9% of the median household income to afford a median-price home. But note that this is before-tax income. After taxes, it takes well over half of the median household income to own a median-price home.
The stratospheric cost of homeownership has led many American families to cut corners wherever possible. That’s why 18 million Americans today are doing without homeowners insurance. The untenable cost of living has forced them to roll the dice on their financial futures.
But neither the exorbitant cost of owning a home nor the drop in insurance coverage is incorporated in the CPI. This undercounting of inflation is a key reason why so many people disapprove of the economy despite the official metrics improving. Flawed statistics won’t help cover your unaffordable mortgage.
This piece originally appeared in The Washington Times


