Introduction
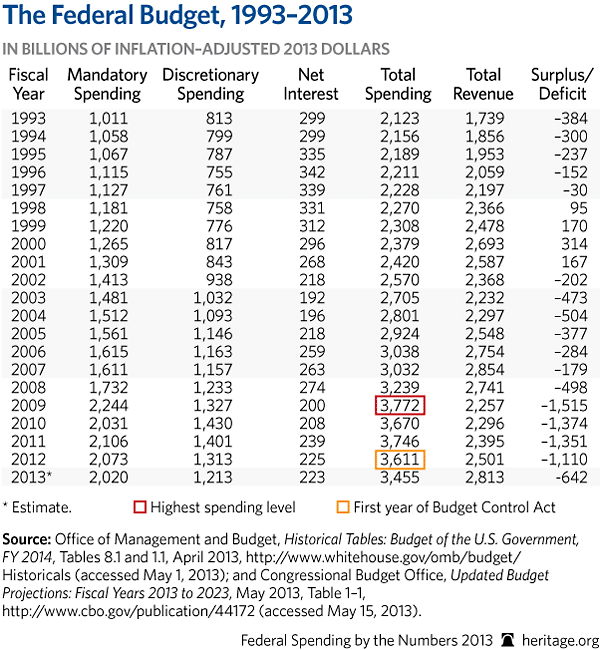
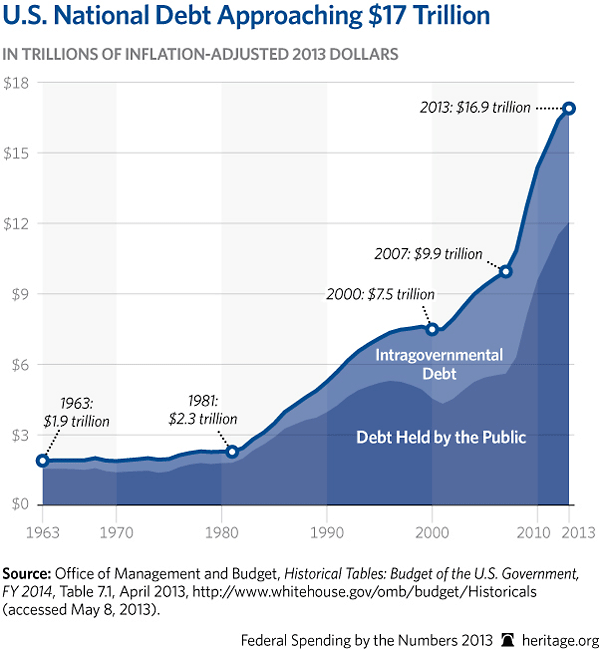
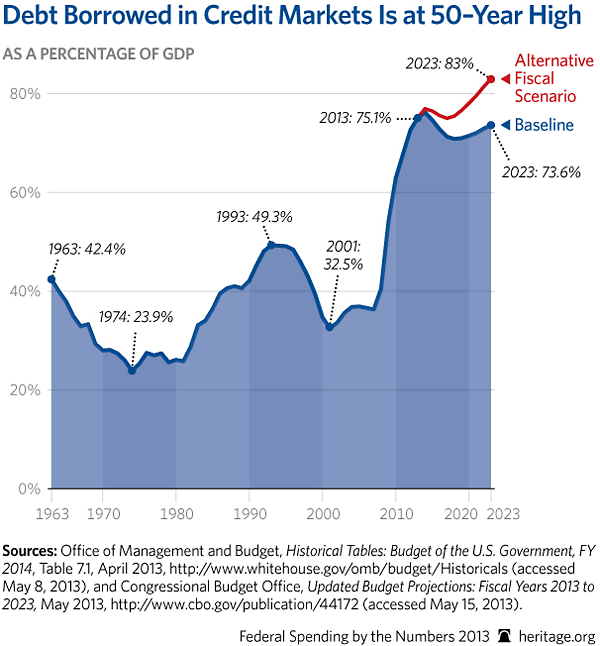
In 2013, federal spending approached $3.5 trillion and the deficit dropped to “only” $642 billion. Some are using this small improvement in the nation’s fiscal situation to avoid further budget tightening. But as the figures and graphics in this report show, this is the wrong conclusion to draw. Following four years of trillion-dollar deficits, the national debt will still reach nearly $17 trillion and exceed 100 percent of gross domestic product (GDP) at the end of the year. Publicly held debt (the debt borrowed in credit markets, excluding Social Security’s trust fund, for example), is alarmingly high at three-quarters of GDP. Without further spending cuts, it is on track to rise to a level last seen after World War II.
Deficits fell in 2013 because President Obama and Congress raised taxes on all Americans, the economy saw slight improvement which helped to bring in more revenue, and spending cuts from sequestration and spending caps under the Budget Control Act of 2011 took effect.
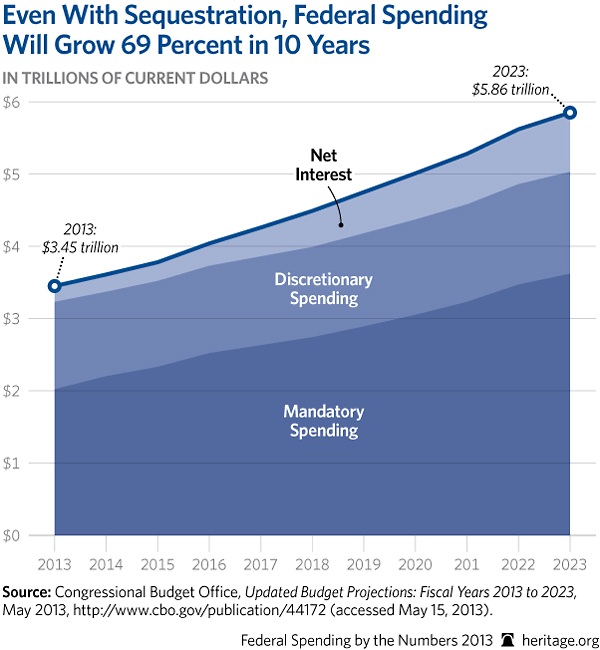
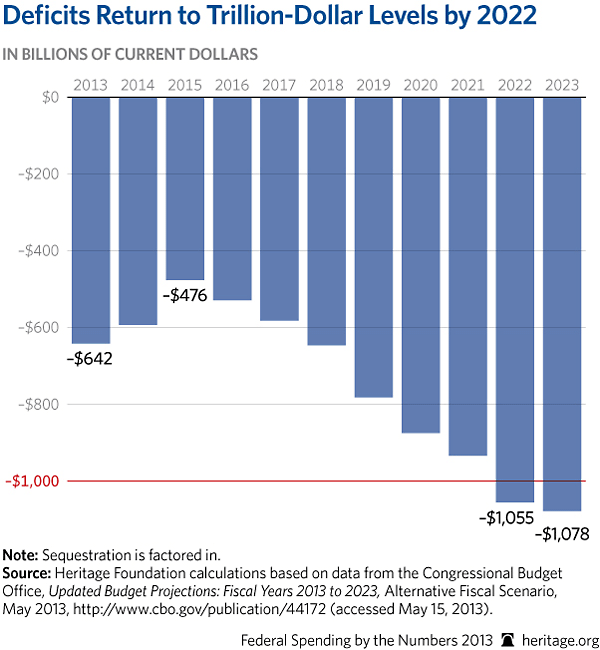
The nation should not take this short-term and modest deficit improvement as a signal to grow complacent about reining in exploding spending. Though deficits will decline for a few more years, existing spending cuts and tax increases will not prevent them from rising soon, and within a decade exceeding $1 trillion once again. Driving this is federal spending which, despite sequestration cuts, will grow 69 percent by 2023.
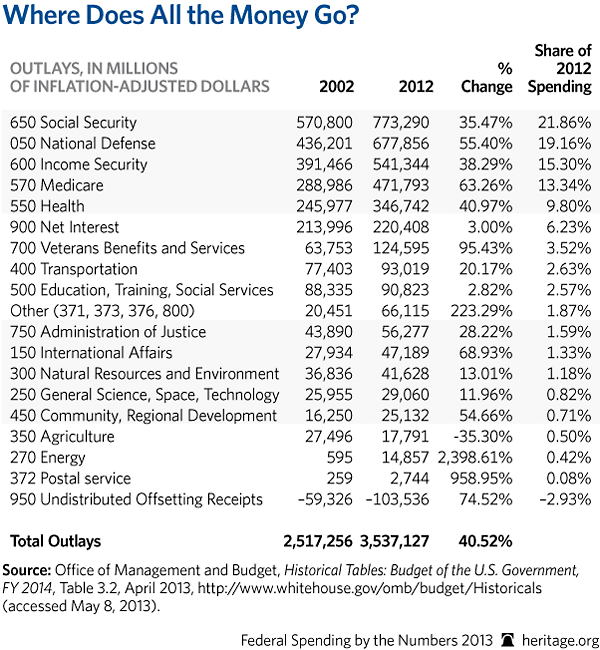
The nation’s long-term spending trajectory remains on a fiscal collision course. Total spending has exploded by 40 percent since 2002, even after inflation. Some programs have grown far in excess of that. Defense, however, has been slashed. Social Security, Medicare, Medicaid, and Obamacare are so large and growing that they are on track to overwhelm the federal budget. While the Budget Control Act of 2011 and sequestration are modestly restraining the discretionary budget, mandatory spending—including entitlements—continues growing nearly unabated. Without any changes, mandatory spending, including net interest, will consume three-fourths of the budget in just one decade.
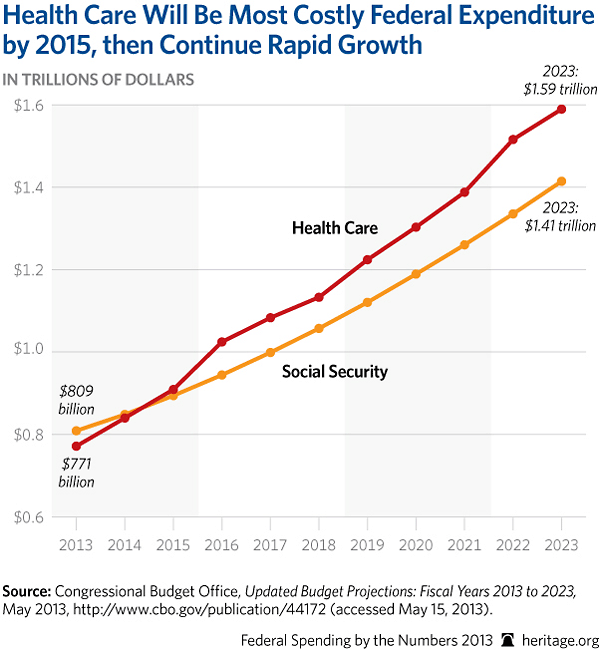
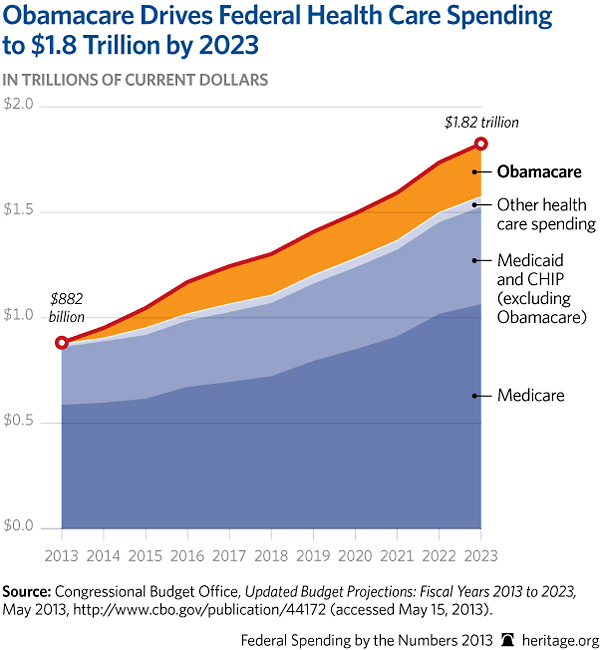
Obamacare will add $1.8 trillion to federal health care spending by 2023. By 2015, health care spending will overtake Social Security as the largest budget item, including Obamacare’s coverage expansion provisions: a massive expansion of Medicaid and subsidies for the new health insurance exchanges.
While mandatory spending is growing out of control and needs reform, there are also plenty of places to cut in the rest of the budget. For example, the Internal Revenue Service spent $4.1 million on a lavish conference in 2010 for 2,609 of its employees in Anaheim, California. Expenses included $50,000 for line-dancing and “Star Trek” parody videos, $135,350 for outside speakers, $64,000 in conference “swag” for the employees, plus free meals, cocktails, and hotel suite upgrades.
Beyond waste, the federal government is too big. Energy spending increased over 2,000 percent since 2002—after adjusting for inflation. Today there are roughly 80 means-tested anti-poverty programs.
Washington must stop kicking the can down the road, or we could soon find ourselves teetering on the edge of a Greece-style meltdown. Instead, lawmakers should eliminate waste, duplication, and inappropriate spending; privatize functions better left to the private sector; and leave areas best managed on a more local level to states and localities. And they should make important changes to the entitlement programs so that they become more affordable and benefits help those with the greatest needs.
It is not too late to solve the impending spending and debt crisis, but the clock is ticking.
The Federal Budget
- Washington will spend nearly $3.5 trillion in 2013 while collecting $2.8 trillion in revenues, resulting in a deficit of $642 billion.
- Over the past 20 years, federal spending grew 63 percent faster than inflation.
- Mandatory spending, including Social Security and means-tested entitlements, doubled after adjusting for inflation. Discretionary spending grew by 49 percent.
- Despite publicly held debt surging to three-fourths the size of the economy (as measured by GDP), net interest costs have fallen as interest rates have dropped to historic lows.
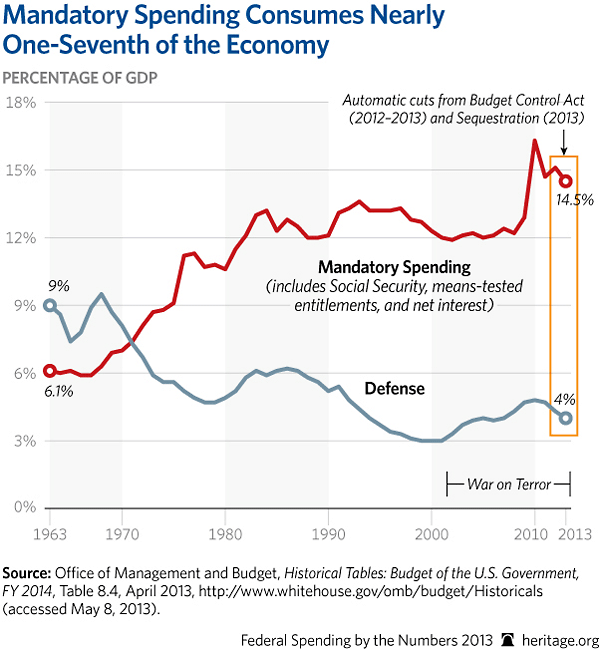
- In 1963, defense spending was 9 percent of GDP and mandatory spending on entitlement programs was 6.1 percent of GDP, one-third lower.
- In 2013, spending on defense is at about 4 percent of GDP and falling, while mandatory spending (including net interest) is reaching 14.5 percent of GDP and growing.
Where Did All the Money Go?
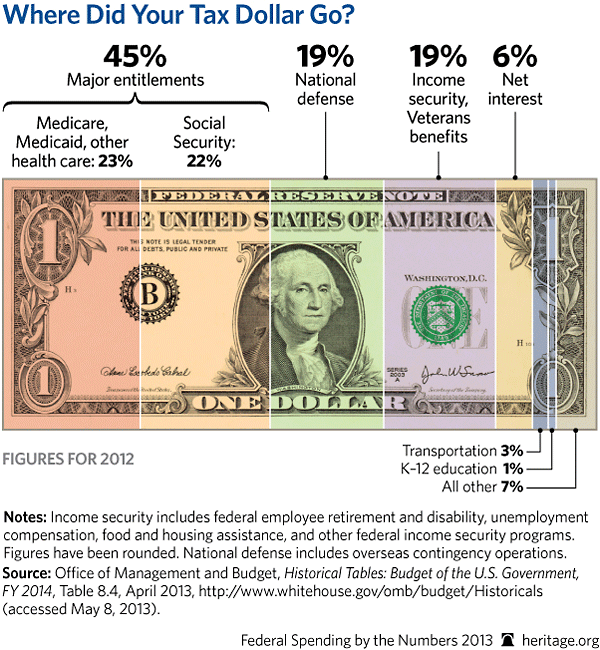
- 31 cents of every dollar Washington spent in 2012 was borrowed, resulting in a $1.1 trillion deficit.
- 45 percent, or almost half of all spending ,went toward paying for Social Security and health care entitlements (primarily Medicare and Medicaid). In 2002, that was only 25 percent. Without reform of these massive and growing programs, Washington will have to borrow increasing amounts of money, piling debt onto younger generations and putting the nation on a dangerous economic course.
- Social Security is the largest federal spending program and has held this position since surpassing defense in 1993.
- Medicare is one of the largest and fastest-growing programs in the entire federal budget.
- The U.S. Postal Service has been losing money for several years and is drawing down reserves to cover losses. Congress should allow the USPS to restructure and meet the needs of today’s marketplace. Otherwise, taxpayers will be on the hook when reserves run out.
- Energy spending has exploded, yet the increases in oil and gas production have happened on state and private lands.
Budget Trends
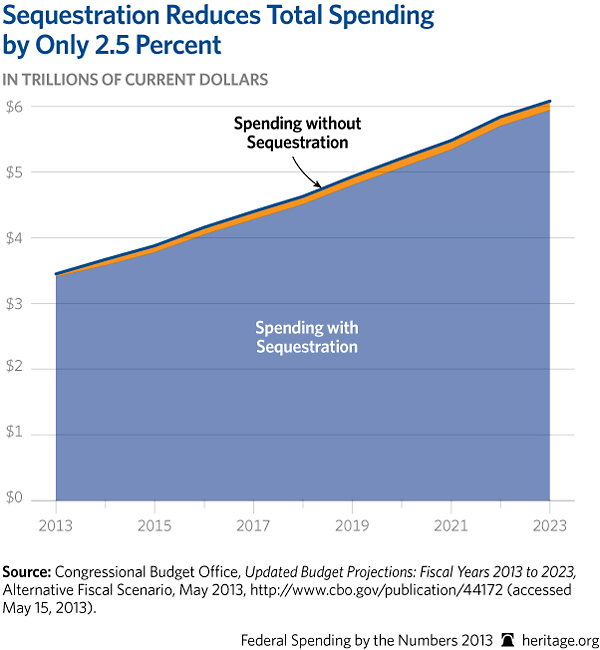
- Total federal spending will grow by 69 percent over the next 10 years, even with sequestration cuts. Without sequestration it would grow by 74 percent.
- Total annual spending will increase by $2.4 trillion, growing from $3.5 trillion in 2013 to $5.9 trillion in 2023.
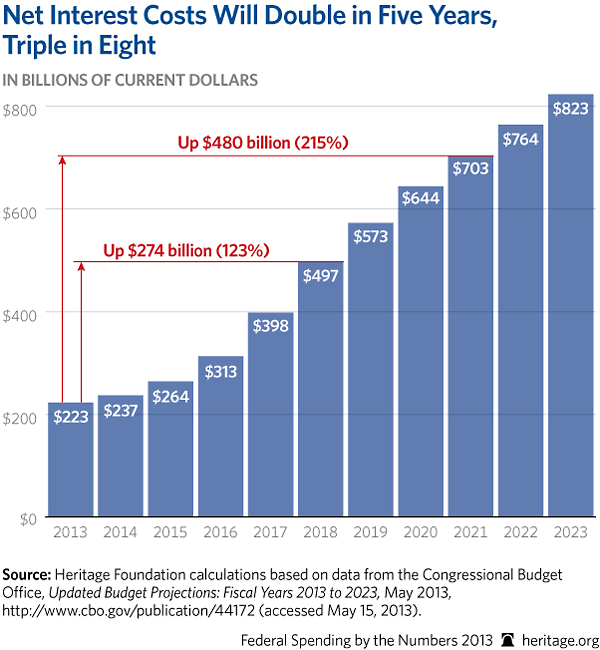
- Net interest costs are projected to grow the most by far. They will more than triple over the next decade, exploding from $223 billion in 2013 to $823 billion in 2023. This growth assumes today’s abnormally low interest rates increase only modestly.
- Mandatory spending, the part of the budget that grows on autopilot, excluding net interest will grow by 79 percent over 10 years.
- Social Security, Medicare, and Medicaid are 82 percent of mandatory program spending today and have no budget limits.
- Discretionary spending, the part of the budget that Congress budgets each year, will increase by 17 percent over 10 years, but only if lawmakers enforce sequestration.
- Discretionary spending as a share of the budget will fall from two-thirds in 1963 to less than one-quarter in 2023 as entitlements grow uncontrolled.
- Mandatory spending will grow from one-quarter of the budget in 1963 to 62 percent by 2023. When net interest is added, this spending would consume three-fourths of the budget.
Chronic Deficits Continue
- Budget deficits occur any year that Congress spends more than it collects in taxes.
- In 2013, Congress will borrow 19 cents of every dollar it spends.
- Deficits will fall in 2013 because of higher revenues from an improving economy, higher taxes passed with the fiscal cliff deal, and spending cuts from the Budget Control Act caps and sequestration.
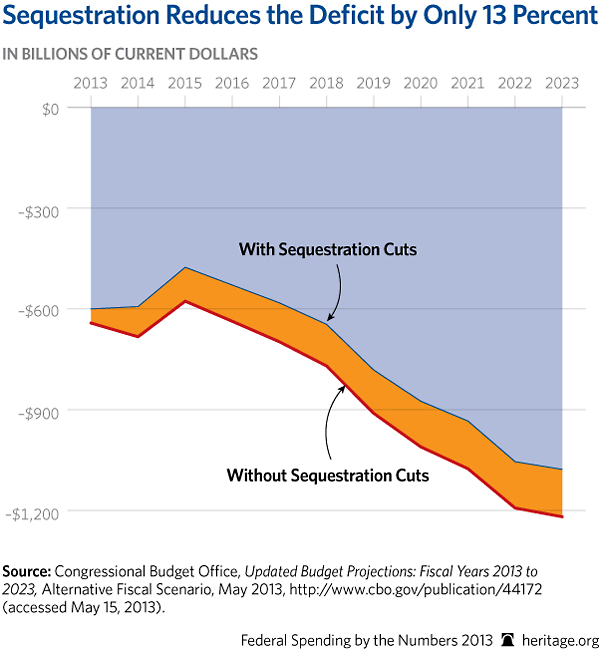
- Sequestration cuts largely keep entitlements untouched, so they do little to prevent a return to trillion-dollar deficits.
- Deficits fall below a half trillion dollars once in 2015 but begin growing immediately, reaching trillion-dollar levels by 2022, as entitlement spending continues unabated.
- The deficit is projected to grow from $642 billion in 2013 to $1.078 trillion by 2023, a 68 percent increase.
- Despite tax revenues returning to normal levels, the federal budget will have large deficits in each year because spending will continue to grow well beyond historical levels.
Debt
- Federal gross national debt consists of the publicly held debt which is borrowed from credit markets and intragovernmental debt, such as the Social Security trust fund.
- Publicly held debt will exceed $12 trillion in 2013 and together with nearly $5 trillion in intragovernmental debt, will drive the national debt to nearly $17 trillion.
- In 2013, the national debt will reach $140,000 per American household.
- In 2013, publicly held debt will reach 75 percent of GDP. The historical average is 32.5 percent.
- This assumes that sequestration cuts continue as scheduled and taxes increase by $1 trillion as certain tax provisions expire.
- Congress has extended most expiring tax provisions in every year. If Congress also ignores future sequester cuts and continues the doc fix (reversing a scheduled payment cut to physicians who serve Medicare patients), publicly held debt would surge to 83 percent of GDP—the largest share since 1948.
Interest on the Debt
- The amount the federal government pays on interest payments depends primarily on interest rates and the amount of debt held by the public. Other factors, such as inflation and the maturity structure of outstanding securities, also affect interest costs (for example, long-term bonds generally carry higher interest rates than do short-term bills).
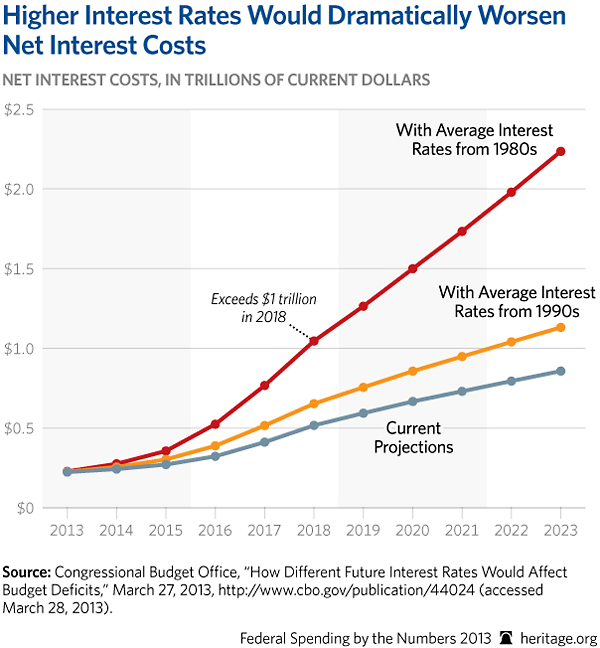
- As the publicly held debt grows, net interest payments will increase dramatically, even assuming that rates rise only moderately.
- Net interest costs will more than double in less than five years and more than triple before the end of the decade.
- If interest rates rose to the average levels in the 1990s, interest payments between 2014 and 2023 would be $1.4 trillion higher. If rates rose to levels from the 1980s, interest payments would be higher by a staggering $6.3 trillion.
- Every single penny that goes toward paying interest on the debt is a penny that is no longer available to fund federal government priorities, like national defense.
Entitlement Programs
- In 1993, Social Security surpassed national defense as the largest federal spending program and has held the top spot since then.
- By 2015, federal spending on health care programs, including Medicare, Medicaid, and Obamacare, will surpass Social Security to become the largest budget category, and the gap will only grow larger over time.
- Federal spending on health care programs will more than double over the next decade, growing from $771 billion in 2013 to $1.590 trillion in 2023.
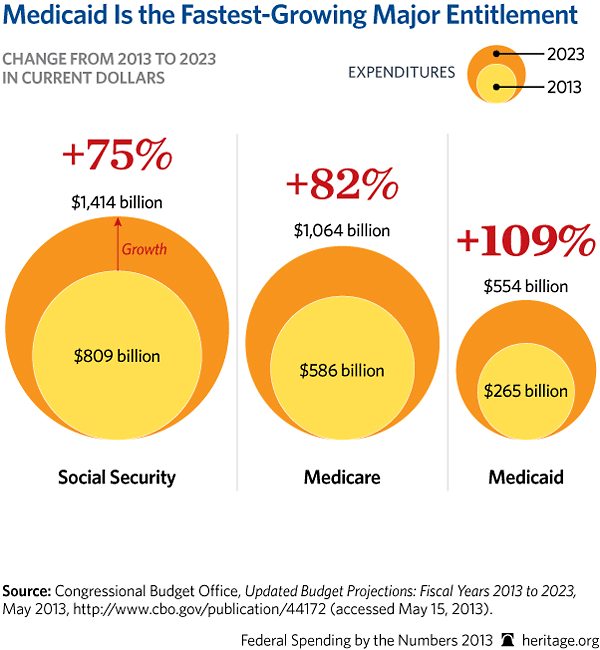
- Spending on Social Security, the largest entitlement today, will surge by 75 percent, from $809 billion in 2013 to $1.414 trillion in 2023.
- Medicare is the largest health care program and its spending will surge by 82 percent, from $586 billion in 2013 to $1.064 trillion in 2023.
- Medicaid is the fastest growing entitlement program and will more than double over the decade as Obamacare’s Medicaid expansion kicks in.
- Social Security and Medicare are the two largest entitlement programs, soaking up more than one-third of the federal budget. Both programs are unaffordable and growing rapidly.
- Social Security’s ($12.3 trillion) and Medicare’s ($35.2 trillion) unfunded obligations total a staggering $47.5 trillion, nearly four times today’s publicly held debt.
Obamacare
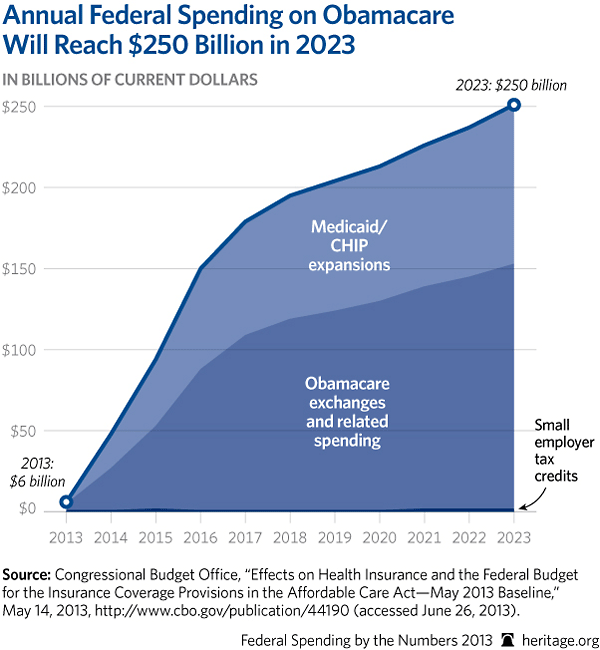
- Obamacare will cost $1.8 trillion over a decade for its health insurance coverage expansion provisions, including a massive expansion of Medicaid and subsidies for the new health insurance exchanges.
- Medicaid needs reform, not expansion. This federal–state health care program provides health care to over 60 million Americans and consumes a growing portion of state and federal budgets.
- The long-term costs of the Obamacare exchanges rest squarely on the states. While Obamacare provides grants to fund states establishing them, the law specifies that starting in 2015, any state implementing a state exchange must develop its own revenue source to fund the exchange’s annual operations.
- Obamacare’s employer mandate, delayed by the President for one year, forces all employers with 50 or more full-time employees to offer government-approved health coverage or pay a penalty. To avoid the cost of coverage and the penalty, many employers are increasingly shifting their full-time workers to part time.
- One of Obamacare’s many failures is the temporary small business tax credit, which has been largely unsuccessful in enticing small employers into offering expensive health coverage. Only 7 percent of potentially eligible employers claimed it in 2011.
Anti-Poverty Spending
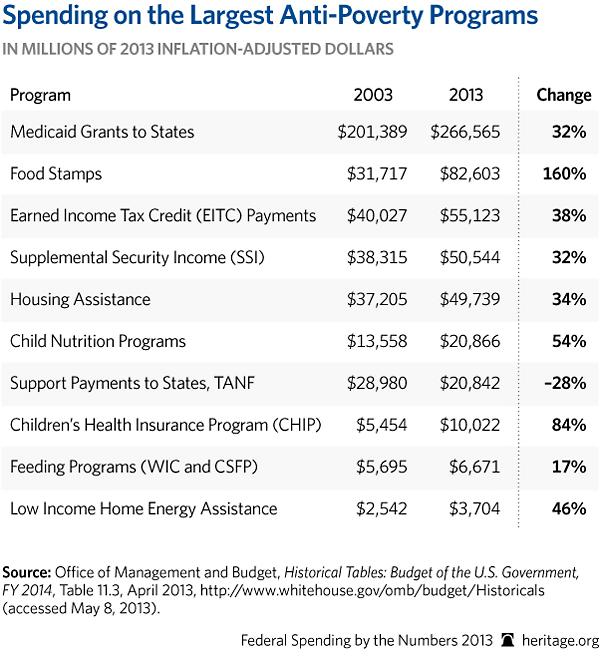
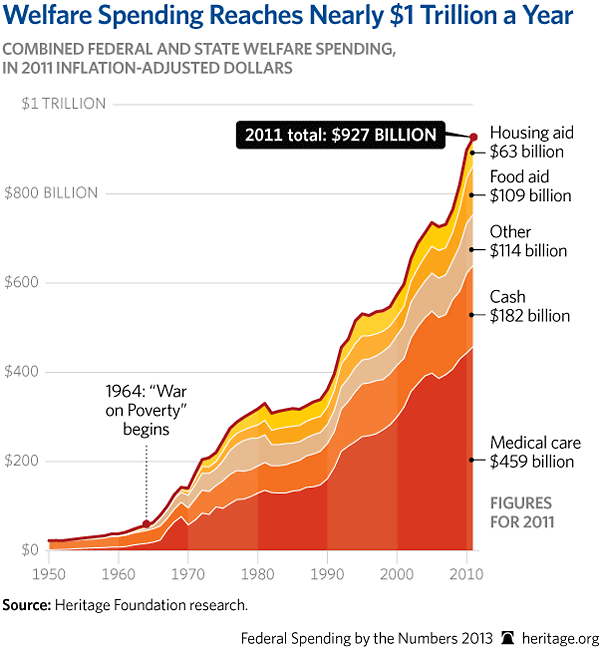
- In FY 2011, the total cost of federal and state means-tested welfare programs reached $927 billion, an all-time high. Welfare spending has increased 16-fold since the federal government began the “War on Poverty” in the 1960s and is projected only to increase. This does not include spending on Social Security and Medicare.
- Today, there are roughly 80 federal means-tested welfare programs, including major programs like Medicaid, food stamps, the refundable Earned Income Tax Credit, public housing, Supplemental Security Income, and Temporary Assistance for Needy Families.
- Food stamps is one of the largest and fastest-growing means-tested welfare programs. Costs have doubled in inflation-adjusted terms since 2008. In 2012, approximately 47 million Americans received food stamps every month.
- Total welfare spending should be rolled back to pre-recession (FY 2007) levels once employment rates recover, and similar to the welfare reforms of 1996, work requirements for able-bodied adults should be inserted into welfare programs like food stamps.
The Household Spending Burden is Skyrocketing
- In 2013, the federal government spent nearly $28,500 per household and still racked up a $5,300 deficit per household. In 2023, spending per household will be $43,300.
- The federal government borrowed 19 cents of every dollar it spent in 2013.
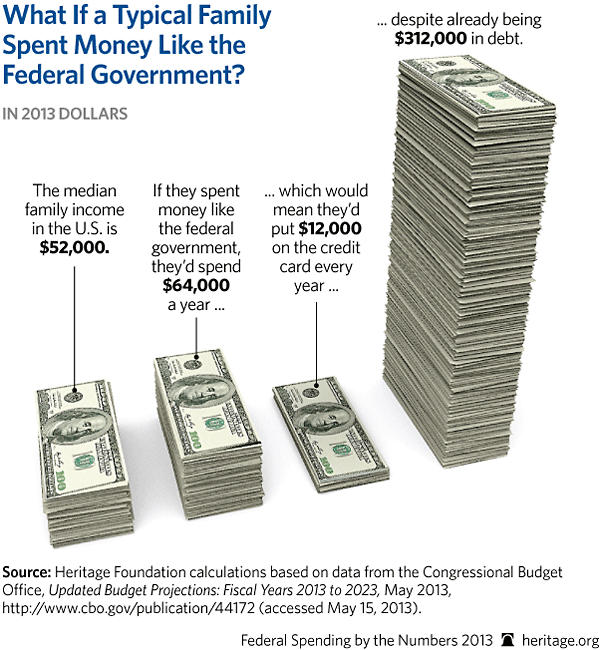
- In 2013, a median-income family will earn about $52,000. If a typical family followed the federal government’s lead, it would spend nearly $64,000 and put $12,000 on a credit card. This family would have already racked up more than $312,000 in credit card debt—like a mortgage, only without the house.
Discretionary Spending
- Congress determines discretionary budgets annually through appropriations.
- Discretionary spending grew by 55 percent after adjusting for inflation, from about $800 billion in 1993 to more than $1.25 trillion in 2013. Discretionary spending is only 36 percent of total spending.
- The 2008 stimulus bill drove discretionary spending to record highs from 2009 to 2011. Though the temporary stimulus is ending, discretionary spending will still exceed 2008 levels by $25 billion.
- National defense was nearly three-quarters of discretionary spending in 1963. Today it is about half.
- The Budget Control Act caps and sequestration cuts will reduce discretionary spending over ten years, beginning in 2012.
- The Budget Control Act and sequestration lower discretionary spending from their excessive stimulus levels initially, but over the decade discretionary spending is still projected to grow by 17 percent.
The Budget Control Act and Sequestration
- The Budget Control Act of 2011 (BCA) increased the debt limit by $2.1 trillion in exchange for caps reducing discretionary spending by $917 billion over 10 years and $1.2 trillion in additional deficit reduction enforced by sequestration.
- Sequestration reduces total spending growth by only 2.5 percent, but spending still grows by 74 percent under the alternative fiscal scenario. Total spending continues to grow because entitlements, excluded from the BCA caps and largely exempted from sequestration, are growing much faster.
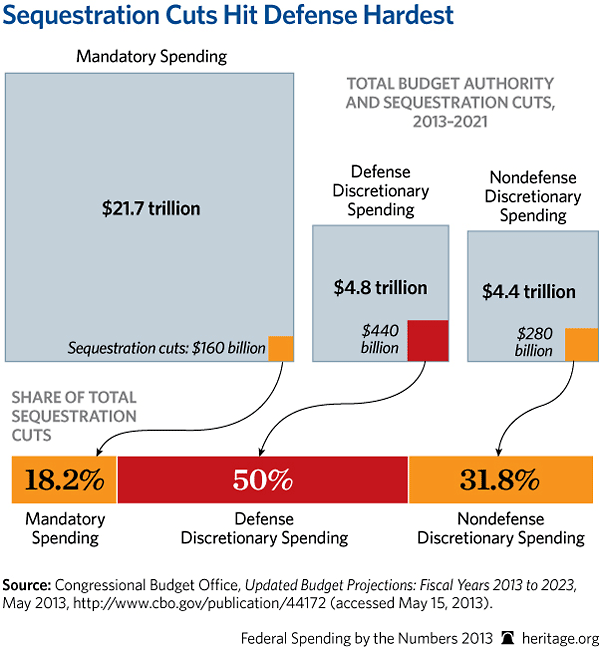
- Sequestration falls most heavily on defense, reducing the discretionary defense budget in 2013 by 7.8 percent, and the non-defense discretionary budget by 5 percent.
- Defense bears 50 percent of sequestration’s reductions under the law, even though it is less than one-fifth of the budget. Entitlements, which make up nearly two-thirds of the budget, bear only 18 percent of the sequester.
- Despite BCA caps, Congress spent $153 billion, or 15 percent, more than the BCA caps on discretionary programs through BCA-exempted categories and by exploiting loopholes like the pork-laden Hurricane Sandy bill.
The House and Senate Budgets
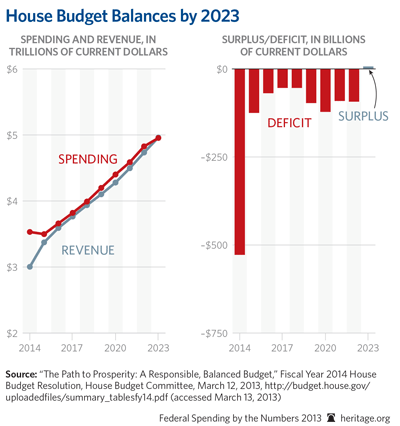
- The House budget balances the budget in 10 years by cutting discretionary spending and reforming some entitlements.
- The House budget reduces spending with reforms to Medicare and Medicaid and, importantly, repeal of Obamacare.
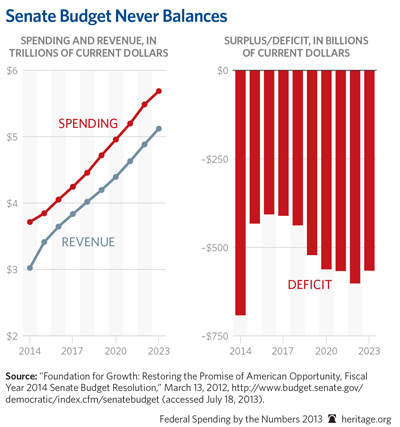
- The Senate budget made no attempt to balance the budget and featured a $1 trillion tax increase.
- The Senate budget increases spending immediately, topping House spending by nearly $5 trillion over the next decade.
- The Senate’s failure to address entitlement spending means U.S. spending and debt would continue growing rapidly, threatening opportunity especially for low- and middle-income Americans.
The Obama Budget
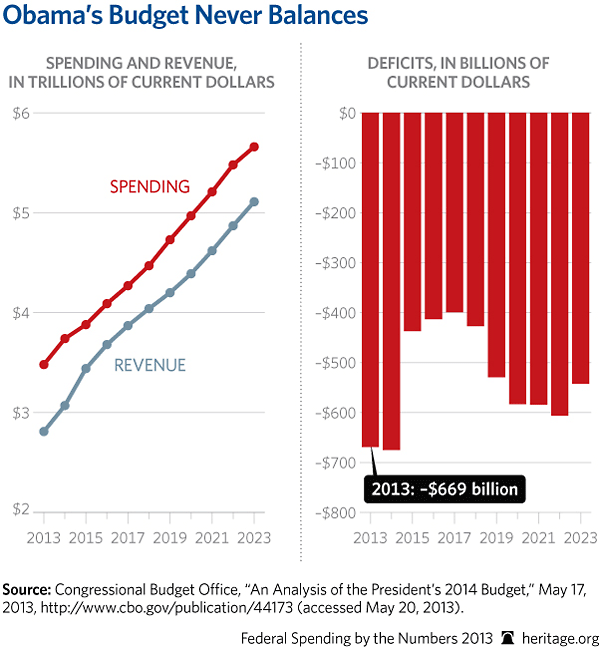
- President Obama’s budget never balances, despite a $1.1 trillion tax increase over 10 years.
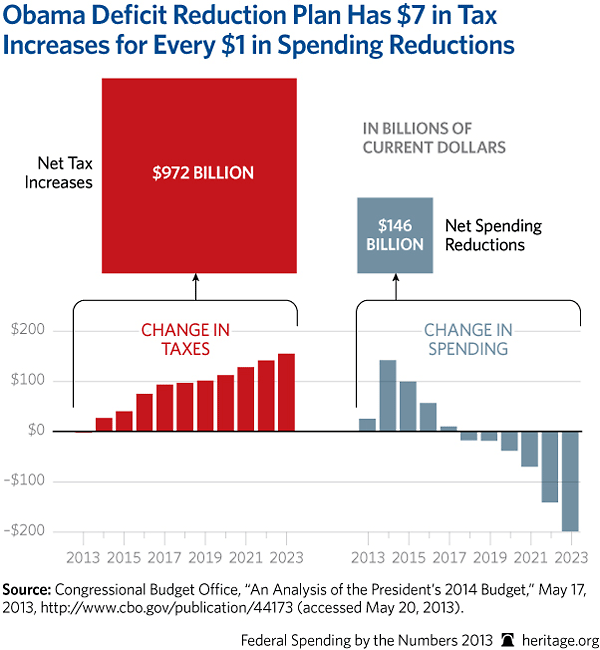
- President Obama would raise $7 in tax increases for every $1 in spending cuts with his deficit reduction proposals. President Obama promised a balanced approach of $2 in spending cuts for every $1 of tax increases.
- The President’s budget increases spending during his second term in office by $335 billion. The budget delays any spending cuts until 2018, when he has already left office.
- Half of his budget’s spending cuts are unrealistic: He cancels war spending that was never planned and then claims savings; he excludes any emergency funding for disasters like hurricanes and floods.
- Even with the President’s tax increases, deficits would increase by $200 billion through 2015 as the President’s spending increases more than offset his tax increases.
- President Obama’s budget would increase the debt held by the public by one-half from $12.1 trillion in 2013 to $18.1 trillion by 2023, for a $6 trillion increase.
United States Government Waste Examples
Agriculture:
- In 2012, the United States Department of Agriculture spent $300,000 on activities promoting caviar produced in Idaho.
Commerce and Housing:
- In 2012, the Federal Communications Commission’s $10 million computer network security upgrade was run inefficiently and was largely ineffective, according to the Government Accountability Office.
- The Federal Communications Commission spent $2.2 billion in 2012 providing phones to low-income Americans—up from $819 million in 2008. An FCC review found that 41 percent of over six million recipients were either ineligible or had not proved their eligibility for the program.
Community and Regional Development
- The Department of Housing and Urban Development (HUD) awards between $1 billion and $2 billion in grants annually for states to build or buy affordable housing. An Inspector General audit revealed poor oversight of such grants at HUD’s 42 field offices.
Education, Training, Employment, and Social:
- A $100,000 grant from the National Endowment of the Arts funded a video game that depicts a female superhero sent to save planet Earth from climate changes allegedly caused by social issues that affect women.
Energy
- Since 1998, nuclear power companies have paid a nuclear waste disposal fee to the Department of Energy (DOE), which has not put one bit of waste into long-term storage. After 14 years of lawsuits, fees paid for services not performed, and legal fees, in 2013 the DOE reimbursed several companies $160 million from the Treasury’s judgment fund.
- The Department of Energy’s Savannah River facility spent $7.7 million on severance packages for 526 temporarily hired contract workers instead of issuing layoff notices.
- After receiving $150 million in taxpayer funds, a Michigan hybrid battery plant is putting workers on furlough. Not a single battery has been produced.
- A Colorado state audit report found that the CEO of the Colorado Energy Office “was unable to demonstrate that $252 million spent over the past six years was spent cost-effectively.” Stimulus funds made up almost half of that amount.
- Taxpayers spent $700 million in stimulus funds on the Department of Energy’s Smart Grid Demonstration Program. An audit found that DOE is not effectively managing the program’s finances. Specifically, it found:
- $12.3 million in reimbursements lacked required supporting documentation, and
- Overlapping awards of $2 million and $14 million were given to the same recipient.
- The Environmental Protection Agency failed to notice that eleven federal contractors it hired to manage unused equipment and sensitive documents in a large warehouse converted part of the space into a personal gym and let the building fall into disrepair.
General Government:
- The U.S. Secret Service spent $23 million to purchase a new fleet of luxury parade limousines—without competitive bidding.
- The White House is preparing for a $376 million renovation and plans to construct a second Oval Office for the President to use during the renovation.
- The General Services Administration’s poor oversight of 33 courthouse construction projects during the 2000 to 2010 time period cost taxpayers $835 million in extra construction costs. Taxpayers pay $51 million a year to maintain and operate an extra 3.5 million square feet of space that was built and remains unused today.
- The Internal Revenue Service spent $4.1 million on a lavish conference in 2010 for 2,609 of its employees in Anaheim, California. Expenses included $50,000 for line-dancing and “Star Trek” parody videos, $135,350 for outside speakers, $64,000 in conference “swag” for the employees, plus free meals, cocktails, and hotel suite upgrades.
- In 2012, the Transportation Security Administration reportedly was not using 72,074 square feet—more square footage than in the White House or a football field—of its over 440,000 square feet of floor storage space in three Texas warehouses, but still leased the entire space for $1.8 million a year in taxpayer dollars.
- The Transportation Security Administration let 5,700 pieces of unused security equipment worth $184 million sit in storage in a Dallas, Texas, warehouse, which costs $3.5 million annually to lease and manage. Taxpayers lost another $23 million in depreciation costs, because most of the 472 carry-on baggage screening machines had been housed there for nine months or more.
- In 2013, the U.S. government will pay $65 per year, per account, in service fees to keep 13,712 bank accounts with no money in them on the books, getting nothing in return for that $890,000 in taxpayer money.
General Science, Space, and Technology:
- The National Science Foundation awarded $350,000 to Purdue University researchers, who found golfers should imagine the hole is bigger to boost confidence and accuracy.
- The National Science Foundation used part of a half million dollar grant to develop a video game that simulates a high school prom.
- The National Science Foundation approved a $227,000 grant to a Michigan State University professor in the school’s Department of Animal Studies. The grant will fund a two-year study of the evolution of National Geographic’s depiction of animals from 1888–2008.
Health:
- Under an Obamacare provision, the U.S. Department of Health and Human Services awarded New York-based Freelancers Insurance Company a $340 million loan to establish healthcare co-ops, even though regulators have ranked the business dead last among the state’s insurance companies.
- The National Institutes of Health awarded researchers $402,721 to develop a noninvasive way to monitor smoking habits, including the creation of a bracelet and a vest-like sensor that can track a person’s breathing and how much the person smokes.
- Though the “Freshman 15” is a familiar weight gain phenomenon, the U.S. Department of Agriculture has awarded a $149,992 grant to researchers at Fairleigh Dickinson University in New Jersey to study college students’ on-campus dining selections.
- The Department of Health and Human Services failed to report $800 billion in spending on time to USASpending.gov, which is the government website dedicated to government spending transparency.
Medicare:
- Medicare has been overpaying hospitals and clinics for a kidney dialysis drug to the tune of $800 million per year, an error that will not be corrected until the new rates are established in 2014.
- In 2012, the Department of Justice charged 91 medical professionals with Medicare billing fraud that totaled $429.2 million.
National Defense:
- In a study costing $681,387, the U.S. Air Force Office of Scientific Research confirmed that men bearing firearms appear taller, stronger, and manlier.
- The U.S. Air Force Office of Scientific Research conducted a $300,000 study that concluded that the first bird on earth probably had black feathers.
- “Once upon a time” DARPA (the Defense Advanced Research Projects Agency) held a $6 million convention on the science of storytelling.
- The Department of Defense sponsored the creation of an iPhone “app” that would help people optimize their caffeine level, even though at least two similar apps existed already.
- A poorly planned geothermal project at the Naval Air Station in Fallon, Nevada, cost the Department of Defense $9.12 million, according to a 2011 Inspector General report.
- The Office of Naval Research conducted a $450,000 study which determined that unintelligent robots are unable to maintain a baby’s attention.
Social Security:
- The Social Security Administration’s (SSA) fiscal year 2011 Performance and Accountability Report found $2.11 billion in overpaid Social Security benefits.
- The same report found that the SSA overpaid old-age, survivors, and disability insurance benefits by $934 million in FY 2010 alone.
- In 2010, 117,000 individuals received $850 million in cash benefits by double-dipping into Social Security’s disability insurance program and the federal unemployment insurance program.
Transportation:
- Amtrak, the federally subsidized passenger rail system, recovered only 44 cents of every dollar of its food and beverage costs on its long-distance routes, which annually lose money.
- Employees of the Metropolitan Washington Airports Authority inappropriately accepted $5,000 in gifts, including Super Bowl tickets, from one contractor. The MWAA is responsible for operating the Dulles Toll Road and constructing and funding the $5.25 billion Metrorail extension to Dulles Airport.
- The Metropolitan Washington Airports Authority gave an employee with only seven months’ experience $20,000 in hiring bonuses and pay increases, according to an Inspector General report.
- Mississippi improperly spent approximately $7.1 million in federal highway safety grant funds during fiscal years 2007–2010, according to a 2013 Inspector General report.
- In 2010 alone, $6 billion or 17 percent of federal user fees were diverted from highway and road projects to pay for mass transit, even though transit accounted for only about one percent of the nation’s surface travel.
- Poor oversight at the Federal Highway Administration allowed state officials in Florida, Michigan, and Pennsylvania to pay $125.6 million in highway repair stimulus money to contractors without proof that the work was done correctly—or completed at all.
- An Amtrak employee used a federal fuel credit card to buy $4,086 worth of gas for his personal vehicles. The average American household paid $2,912 for gas in 2012.
Other:
- A 2012 report from the Treasury Inspector General for Tax Administration identified $757 million in fraudulent tax refunds to prisoners in 2010.
- Poor oversight allowed over one thousand Pennsylvania prisoners to collect weekly unemployment benefits over a four-month period, costing taxpayers $7 million.
- According to 2012 Congressional Research Service reports, federal government agencies spent more than $900 million on advertising in fiscal year 2010 and spent an additional $750.4 million on advertising in fiscal year 2011.
- The United States Postal Service (USPS) reported a $15.9 billion loss in 2012, yet career employees and postal support employees all received a raise late that year.
- The Office of Personnel Management reported the federal government paid more than $156 million in 2011 to employees working as representatives for government unions.
- A 2013 staff report for the U.S. House of Representatives’ Committee on Oversight and Government Reform identified $67 billion in open or unimplemented recommendations, up from the $29 billion found in 2009.
Sources include Congressional Budget Office, Inspector General, and Government Accountability Office reports; Wastebook 2012 from the Office of Senator Tom Coburn (R-OK); and news articles from various media outlets, all of which are on file at The Heritage Foundation.
