The federal government has been providing subsidies to mass transit since the 1960s.[1] The principal justification was originally to reduce traffic congestion and to provide mobility alternatives to cars for low-income citizens. In addition, transit has been subsidized to reduce automobile emissions.[2]
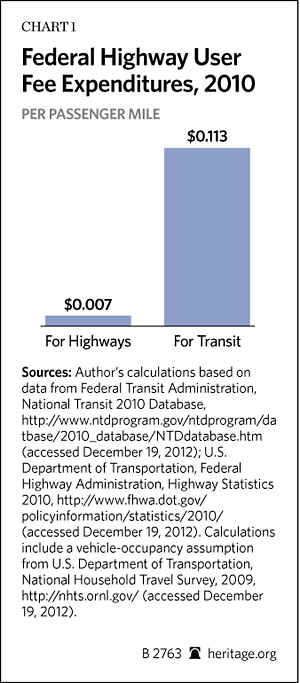
Since 1983, transit has received a share of the federal user fees paid by drivers, principally through fuel taxes. Additional diversions from federal user fees have been authorized by the Congestion Mitigation and Air Quality Improvement (CMAQ) program. In 2010, the latest year for which data are available, the total diversion from federal user fees approached $6 billion. This left $29 billion for expenditures on highways and roads. The 17 percent share of federal user fees was much greater than transit’s little more than 1 percent of the nation’s surface travel. Overall, highway user fees supported each transit passenger mile 17 times more than each highway passenger mile ($0.1130 for transit; $0.0067 for highways). (See Chart 1.)
Traffic Congestion
America has become an urban nation. The 2010 census showed that approximately four of five people live in urban areas, which vary in size from a population of 2,500 to nearly 20 million.[3] Metropolitan areas contribute to more of the national economy than their population share. Research indicates that metropolitan areas have better economic performance where residents are able to access a larger share of the job opportunities in a specific amount of time (such as 30 minutes).[4] Traffic congestion slows travel times and thus imposes costs on metropolitan economies.
Thus, public policy should seek to make it possible for city residents to minimize their travel time as they go about their business. This means that in the larger cities, economic growth and job creation will be stronger if costly traffic congestion is controlled or, better, eliminated.
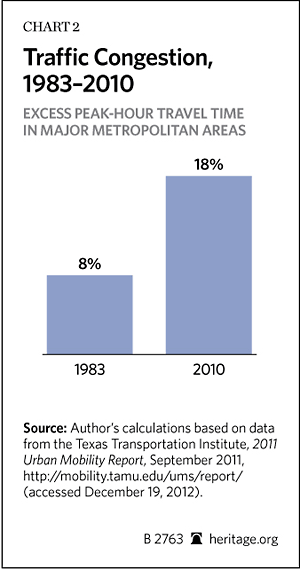
One of the principal justifications for federal subsidies to transit is to relieve traffic congestion. However, throughout the life of the federal transit program, traffic congestion has gotten worse. Between 1983 and 2010,[5] greater traffic congestion has increased peak period travel times by approximately 125 percent in the 51 major metropolitan areas.[6] (See Chart 2.) Peak period travel times worsened in all 51 areas, up to an 800 percent increase in Riverside-San Bernardino. At the same time, overall traffic volumes in major metropolitan areas increased by 87 percent.
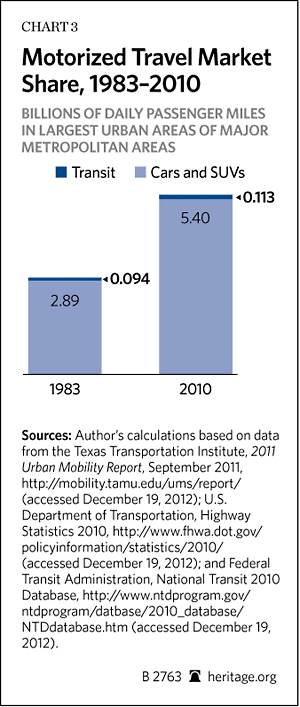
Not only has transit been unable to relieve traffic congestion, it has generally failed to even maintain its share of urban travel. Transit share of passenger miles[7] in major metropolitan areas dropped by approximately one-quarter between 1983 and 2010. (See Chart 3.)
In examination of work-trip travel patterns further illustrates the point. Most traffic congestion occurs during peak travel periods on weekdays. Work trips represent less than 25 percent of daily travel, yet are concentrated in the peak travel times. This concentration of work trips is thus the proximate cause of most recurring traffic congestion in metropolitan areas.
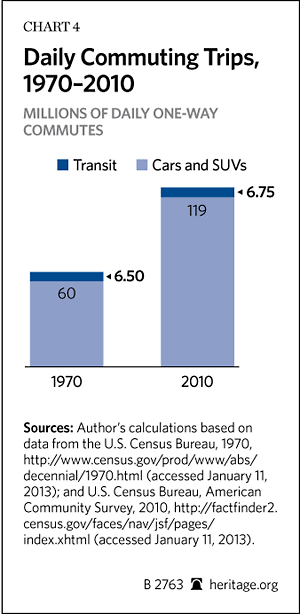
To relieve traffic congestion, transit must attract large numbers of automobile drivers as riders. This has not occurred. Census Bureau data[8] indicates that since 1970, travel to work by automobile has virtually exploded, while commuting by transit has barely budged. The number of people commuting by automobile each day increased by more than 58,000,000. Commuting by transit increased by approximately 250,000. (See Chart 4.)
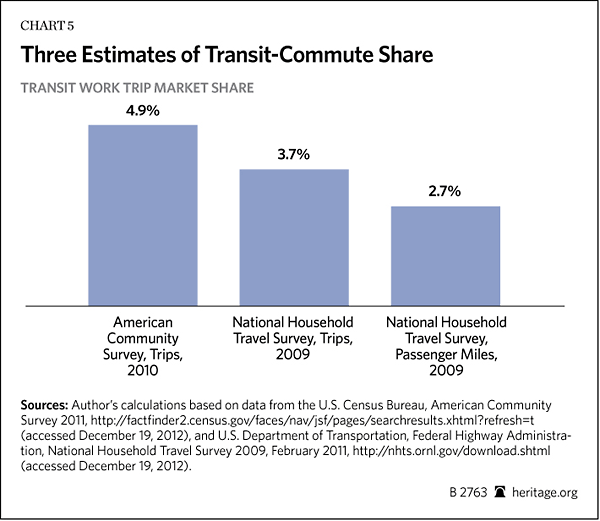
In 2010, 4.9 percent of commutes were by transit, according to the American Community Survey. However, even this figure is high. The U.S. Department of Transportation National Household Travel Survey (NHTS) indicates that people who commute by transit tend to often use other modes (such as automobiles) for commuting, which means that transit’s actual market share is less. NHTS data indicates that overall transit accounted for 3.7 percent of commuters and an even lower 2.7 percent of commuting miles in 2009. (See Chart 5.)
Different results might have been expected. Since the 1970s, the nation has embarked on an urban rail building spree, opening systems in more than 20 major metropolitan areas. Further, the price of gasoline has risen strongly in the past decade. Yet, transit use has not increased enough to relieve traffic congestion; it has not even held its own. At the same time, a work-access mode that requires no subsidies—working from home—has expanded substantially and now exceeds transit work trips in 37 of the 51 major metropolitan areas, up from 27 in 2000.[9]
Mobility for Low-Income Citizens?
While transit ridership among low-income citizens is higher than among the rest of the population, transit is unable to provide practical mobility to jobs throughout the metropolitan area to low-income citizens. (See Chart 6.) As a result, low-income workers rely on automobiles nearly to the same extent as all workers in the major metropolitan areas.
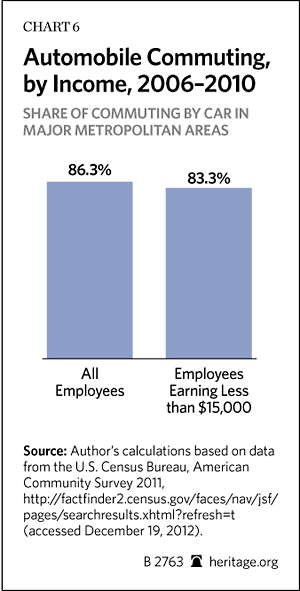
The value of the automobile to low-income commuters was expressed in a Progressive Policy Institute research analysis: “In most cases, the shortest distance between a poor person and a job is along a line driven in a car.”[10] In other words, any program that seeks to replicate overall mobility levels for low-income citizens should be targeted to benefit low-income workers, not the more affluent transit riders and certainly not transit agencies. Some private nonprofit programs are already making substantial strides in facilitating automobile finance for low-income citizens, leading to greater employment levels and higher incomes.[11]
Reducing Emissions
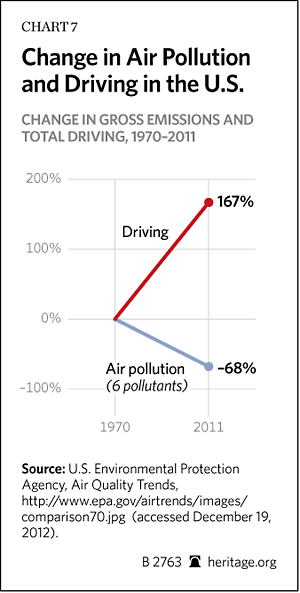
Despite expectations to the contrary, transit has played no role in the reduction of air pollution. To have done so would have required reducing traffic volumes, the opposite of which occurred.
The nation has made spectacular strides in reducing local air pollution. Data from the Environmental Protection Agency (EPA) indicates that air pollution has declined 68 percent in the past four decades. Automobile travel over the same period increased 167 percent. (See Chart 7.)
Transit has been long touted as an effective means for reducing carbon dioxide (CO2) emissions. This is because of the widely held assumption that transit produces substantially lower emissions than automobiles. There are two difficulties with this view. Even if the claim were true, in order for transit to reduce CO2 emissions substantial numbers of drivers would have to switch to transit, which has not occurred. Moreover, as is indicated below, there is virtually no prospect for a material switch to transit in the future.
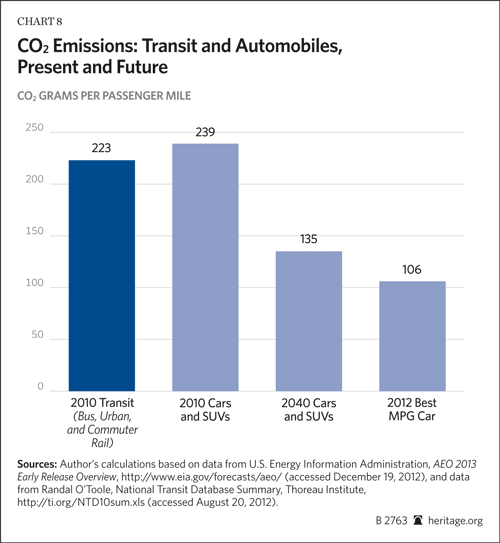
Further, transit’s advantage in CO2 emissions over automobiles is small and declining. Automobile CO2 emissions in 2010 were about 10 percent greater per passenger mile (250 grams per passenger mile,[12] than that of transit (230 grams per passenger mile).[13] Automobiles emit less CO2 per passenger mile than the transit systems in 38 of the 51 major metropolitan areas.[14] As a result, transit, at best, is estimated to account for an approximately 0.3 percent reduction in CO2 emissions from cars. Besides being infinitesimal, this reduction is also expensive, at a federal expenditure of approximately $4,000 per ton reduced, 80 to 200 times the United Nations Intergovernmental Panel on Climate Change $20 to $50 maximum range.[15] Transit is not a cost-effective strategy for reducing CO2 emissions.
The difference between transit and automobile CO2 emissions per passenger mile has been declining, due to improved fuel efficiency. Automobiles have become so fuel efficient that based on current data, transit accounts for little more than a 0.1 percent reduction in CO2 emissions from automobiles. This small contribution is likely to be eliminated in the future, based on new Energy Department’s projections.[16] Automobile CO2 emissions will drop to 135 grams per passenger mile by 2040, down approximately one-half from 2005. Already, the most fuel-efficient automobile[17] emits only 106 grams of CO2 per passenger mile.[18] (See Chart 8.)
The Six “Transit Legacy Cities”
Transit is not really a national program due to its substantial concentration in just six cities[19] (the municipalities of Boston, Chicago, New York, Philadelphia, San Francisco, and Washington). Transit has retained a work-trip market share of more than 25 percent only to locations in these “transit legacy cities” (municipalities), and competes well with automobiles, which account for a slightly smaller share of commutes.
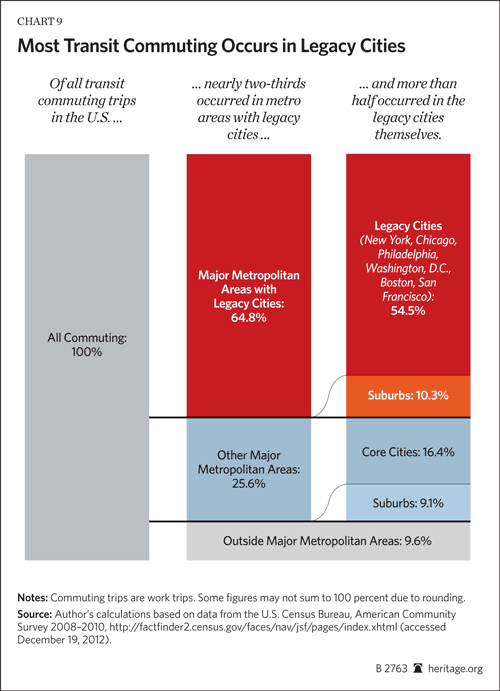
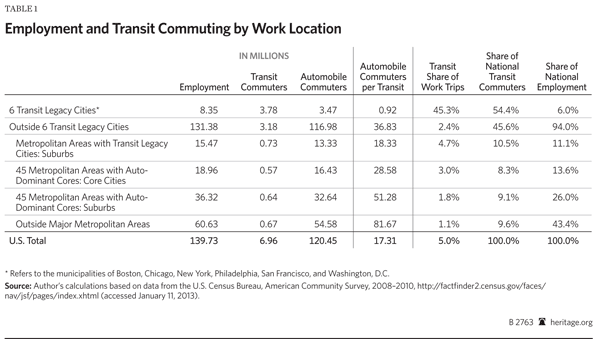
The transit legacy cities contain just 6 percent of the nation’s employment, and cover little more land area than the municipality of Jacksonville, Florida,[20] even though they are the destination for 54 percent of transit work commuting. (See Chart 9.) However, outside the legacy cities, transit attracts only a small share of commuters. Automobiles are dominant both in the suburbs of metropolitan areas with legacy cities and in core cities and suburbs of the 45 other major metropolitan areas.[21] (See Table 1.)
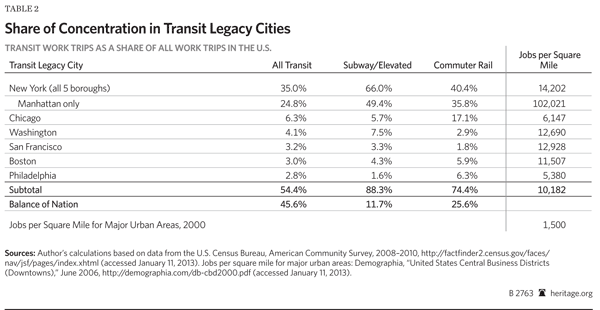
The extent of the concentration in the six transit legacy cities is illustrated in Table 2. In some ways, transit is really a New York story. More than one-third of all transit work-trip commuting is to locations in the city of New York. The dominance is even greater for high-capacity subways/elevated services,[22] where New York represents two-thirds of national commuting. The bulk is to Manhattan, by far the most dense area of the nation (in both population and employment), which accounts for approximately one-half of subway/elevated commuting. The employment densities are high in all of the transit legacy cities, at more than three times the national average for large urban areas.[23] The employment densities in Manhattan are even higher, at nearly 70 times the larger urban area average.
The concentration of transit commuting in the six transit legacy cities is illustrative of perhaps the most important factor in attracting riders who have cars available—a large, highly concentrated downtown area.
Outside the transit legacy cities, 37 work trips are taken by automobile for each transit trip in the major metropolitan areas. However, even the strong transit ridership in the transit legacy cities has not been enough to slow the continuing rise in automobile commuting in their corresponding metropolitan areas. Between 1983 and 2010, 91 percent to 99 percent of the motorized travel increase was due to automobiles.[24]
Transit’s Strength: Legacy City Downtown Areas
Large, dense downtown areas, also called central business districts (CBDs), are transit’s strength. The six transit legacy cities contain the six largest CBDs in the nation. In 2000, these downtown areas accounted for 60 percent of transit commuting in their respective metropolitan areas. These high-transit market shares are achieved because of their large and dense employment bases (not replicated elsewhere in the United States), and their dense transit feeder networks. Even so, their share of metropolitan employment was much smaller, at approximately 15 percent.[25]
Approximately three-quarters of New York CB[26] workers commuted by transit in 2000. Between 40 percent and 60 percent of commuters to the other five legacy-city CBDs used transit. The combined legacy-city CBDs cover only 20 square miles, which is less than the land area of Dallas–Fort Worth International Airport. This compares to the nation’s total urban land of approximately 100,000 square miles.[27] Downtowns that contain only 0.02 percent of urban land area accounted for approximately 35 percent of the transit commuting.
The transit legacy cities retain much of their pre–World War II high-density urban form. Yet they have lost nearly a combined 2 million residents since the 1950 census, as all growth occurred in the suburbs. Moreover, the metropolitan areas with transit legacy cities have competed poorly for residents, losing a net total of 3.3 million domestic migrants to other parts of the nation between 2000 and 2009.[28] The 45 metropolitan areas with automobile-dominant core cities gained a combined net total of 1.3 million domestic migrants.[29]
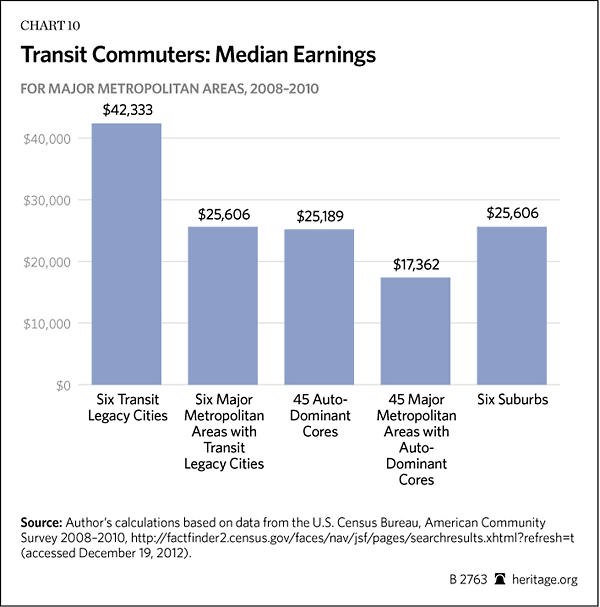
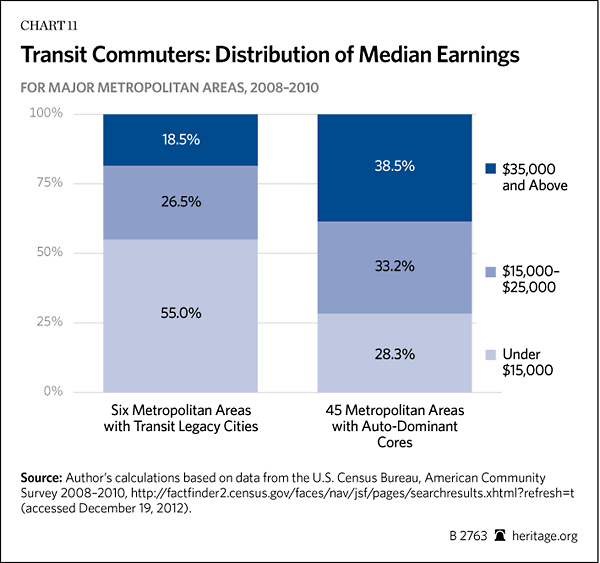
Because some of the best paying jobs are located in these large downtown areas, commuters working in the transit legacy cities have higher incomes. Because transit tends to be especially time-consuming for travel to suburban employment, few people with cars use transit, and those who do often have no car and are thus “captive to transit” and tend to have very low incomes. (See Chart 10.) Further, low-income transit commuters are far more concentrated in the 45 metropolitan areas with automobile-dominant core cities. (See Chart 11.) Poverty rates are also higher, averaging approximately one-quarter higher in the 45 metropolitan areas with automobile-dominant core cities (11.2 percent versus 8.9 percent in the metropolitan areas with legacy cities).[30]
None of this is to suggest that transit is not important. However, its substantial concentration in just six transit legacy cities in some of the most affluent metropolitan areas does not justify support by federal taxpayers. Transit subsidies would be more appropriately provided by states or metropolitan areas.[31]
Rational Commuters: Why People Use Cars
Why is it that people have not abandoned their automobiles to switch to transit? Commentators often talk of America’s “love affair with the car,” without recognizing a similar attachment to refrigerators, the Internet, and other modern conveniences. The attachment is to convenience and (affordable) products that enhance their lives.
There is also a perception that people “have a choice” and that transit can be readily substituted for automobile use. The reality is that there is no practical transit alternative for the vast majority of trips in the modern metropolitan area.
Transit achieves its large work-trip market shares to the CBDs of the six transit legacy cities because of their uniqueness. For example, commuters who travel by transit to lower Manhattan do so because the service is more convenient, and can be quicker and less expensive than commuting by automobile.[32] Transit to the CBDs of Boston, Brooklyn, Chicago, Manhattan, Philadelphia, San Francisco, and Washington also competes favorably with the automobile because of the density of employment and the intensity of transit service that feeds these small areas from all over the metropolitan areas.
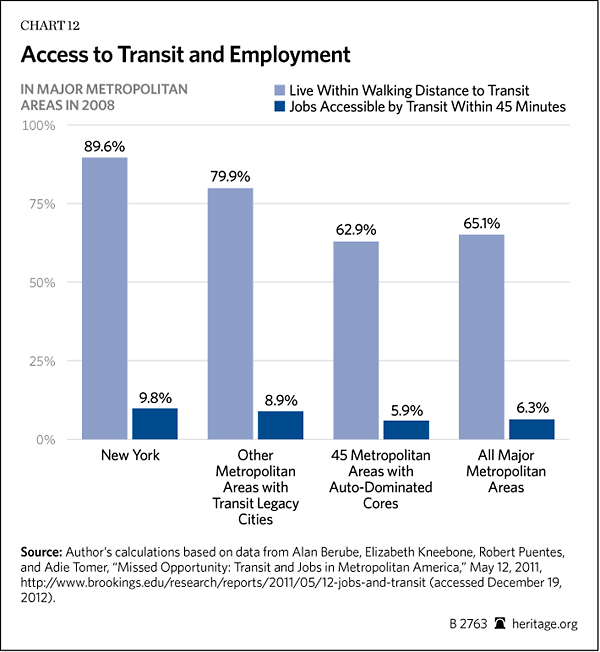
Outside these large CBDs, transit service is largely impractical. This is illustrated by Brookings Institution research indicating that only 6 percent of the jobs in the major metropolitan areas can be reached by the average resident by transit in 45 minutes.[33] This is despite the fact that 65 percent of major metropolitan area residents are within walking distance of a transit stop or station. (See Chart 12.)
There is a big difference in employment access between having an automobile in the garage and having transit nearby. With an automobile, a driver can reach any point within a much larger geographical radius quicker than by transit. The user must walk to the transit stop. The only destinations accessible without transferring to another route will be on the route or routes that serve the particular transit stop. This will not be most employment locations. To many locations, the transfer time alone could exceed the time that would be needed to reach work by automobile.
Nearly all of the 94 percent of commuters who work in the more than 99 percent of urban land outside the transit legacy cities drive to work. Commuters to destinations outside the six transit legacy cities generally continue to drive because, like other people, they tend to be rational. All things being equal, commuters choose their manner of work trip travel based on time, convenience, and quality-of-life considerations.[34] To do otherwise would be irrational.
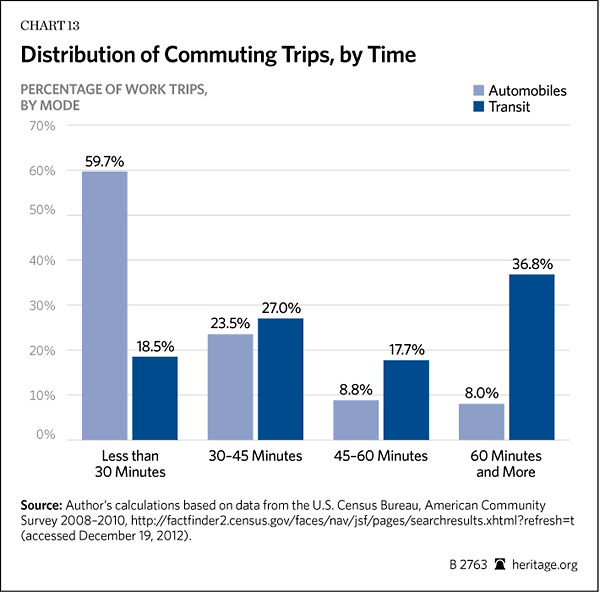
While comparable automobile employment access data is not available, the 45-minute standard used by the Brookings Institution is nearly twice the average work-trip travel time. In the major metropolitan areas, the average work trip for solo drivers is 23.7 minutes. By comparison, transit commutes average 47.7 minutes.[35] The shortest commute times are dominated by automobiles, while the longest are dominated by transit. Most automobile commutes are shorter than 30 minutes, while more than one-third of transit commutes are 60 minutes or more. (See Chart 13.)
A Transportation System Effectiveness Index
The high transit market shares to the six transit legacy city CBDs demonstrate that Americans will use transit that is competitive with the automobile. Transit market shares are a reflection of transit’s usefulness to people and the community. Rational commuters will not choose transit where it makes less sense (or where it is not available). For the most part, outside the largest CBDs, transit service cannot compete with the automobile.
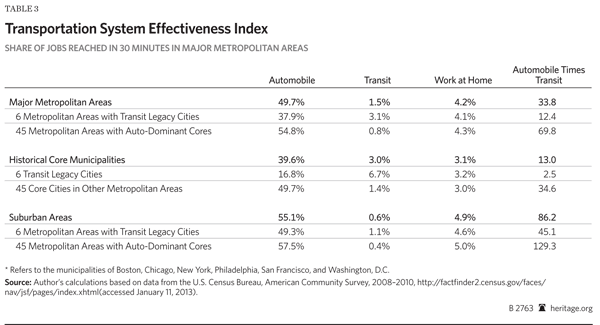
This could be demonstrated by a Transportation System Effectiveness Index, which would measure the percentage of jobs that are reached in 30 minutes by commuters (30 minutes is chosen because it is slightly above the overall average of the 26-minute work-trip travel time). The effectiveness of automobiles ranges from 2.5 times that of transit in the transit legacy cities to 130 times in the suburban areas of metropolitan areas without transit legacy cities. (See Table 3.)
Rational transit alternatives cannot be provided except in the small market niche of the six transit legacy cities by any strategy that is affordable. To provide a metropolitan mass transit system that offers automobile-competitive service could cost more on an annual basis than the total personal income of the metropolitan area each year.[36] It is not surprising that no regional planning agency in the United States or even Western Europe has proposed a plan that would make transit competitive with the automobile throughout a major metropolitan area.
Transit’s Financial Performance
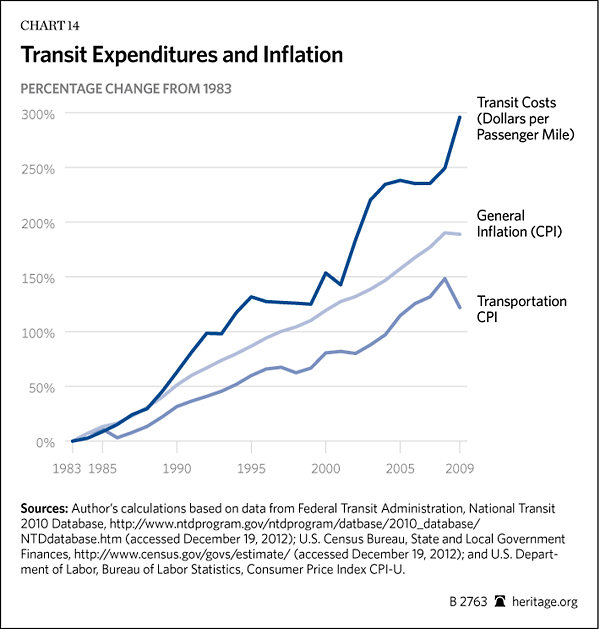
Transit’s cost performance has been substandard. Transit has been plagued by recurring and extraordinary escalation in expenditures. From 1983 to 2009,[37] total transit expenditures rose approximately 300 percent. This is well in excess of the rate of general inflation, which is around 190 percent. (See Chart 14.)
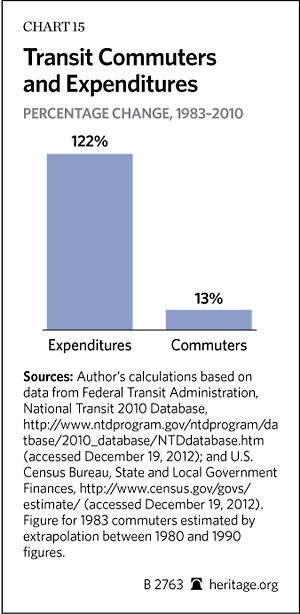
Current urban planning orthodoxy imagines that transit can play a significant future role in reducing automobile use (which has been shown to be impossible). However, under its current non-competitive operating structure, transit’s additional inflation-adjusted revenue has produced a far-less-than-corresponding increase in ridership. On an inflation-adjusted basis, each 1 percent increase in ridership has been associated with a 9 percent increase in expenditures.[38] (See Chart 15.) This means that doubling the number of transit commuters could require transit expenditures to be increased nearly nine times (inflation-adjusted).
Over the same period, passenger and freight transportation industries operating in the competitive market have generally maintained rate increases at or below the inflation rate. However, as a captive of the political process, transit has operated as would be expected for a monopoly (public or private), imposing higher costs than would occur with competitive incentives and resisting cost-effective innovations. Both management and labor have strongly resisted reforms that could have substantially improved cost performance.[39]
Federal taxpayers have received considerably less than full value for their subsidies. Moreover, any notion that expanded transit can play a major role in the cities of the future is likely to be illusory.
Indeed, it can be argued that the diversion of federal highway user fees to transit has led to greater traffic congestion. The federal highway program, which is a partnership with the states, was successful in building virtually all the interstate highway system, together with tolls on some highways. As is indicated below, there has been a substantial increase in traffic congestion in the United States over the decades since highway user fees were first provided to transit. Not only has this diversion of funds to transit failed to reduce traffic congestion, it has also used valuable billions that could have been applied to increase highway capacity. The result would have been less traffic congestion. Insufficient attention has been paid to mobility, not only for passengers, but also for road freight. Federal highway user fees can be best used for traffic congestion relief by commitment to the nation’s principal transportation system, its highways.
In a time of unprecedented financial stress it is essential for the federal government to objectively review the performance of all of its programs. The mass transit program has materially failed to achieve its objectives. It has not reduced traffic congestion. Most low-income commuters have abandoned it and its contribution to CO2 reduction is minimal and falling.
Remedies
There are measures the federal government can take to address these problems:
- The federal government should phase out its transit program by reducing federal expenditures over a five-year transitional “glide-path.” The federal transit program should be reduced by one-fifth per year, and the operating budget of the Federal Transit Administration should be reduced by at least that amount. The only permitted expenditures after the five-year phase-out should be those required in “full funding agreements” with state and local governments as of a certain date, such as December 31, 2012. Full funding agreements apply to larger projects, such as urban rail and busways. Following that date (such as December 31, 2012), new or revised full funding agreement financial commitments would be subject to the five-year phase-out, with no subsequent expenditures permitted.
- State and local opportunities. The five-year transition program would give states and localities the opportunity to determine the level of funding to which they are willing to commit, and to implement cost-effectiveness measures that have often been discouraged by federal transit law and regulation. For example, federal transit regulations have often been cited as a barrier to converting high-cost monopolistic transit service to competitive contracting, despite its proven cost effectiveness in metropolitan areas, such as San Diego and Denver, and has achieved even more compelling results beyond the reach of U.S. federal regulation elsewhere in the world, such as in London,[40] Copenhagen, Stockholm, and Perth (Australia).[41 ]
At the same time, state and local decision making that must fund complete programs is more likely to adopt capital improvement programs that are less costly. This is in contrast to the incentives of the federal transit program, through which local communities have built more expensive systems (such as urban rail) rather than bus-based or other alternatives that could have produced improved transit ridership at considerably lower costs.[42]
Conclusion
Transit has been unable to meet its objectives of reducing traffic congestion, providing substantial mobility to low-income citizens, or reducing emissions. Transit use is highly concentrated in just six transit legacy cities, where transit commuters are far better paid than in the rest of the nation. Transit’s financial performance has been sub-optimal. In addition to these difficulties, transit should rank as a very low priority for federal funding at a time of compelling budget constraints.
—Wendell Cox, Principal of the Wendell Cox Consultancy in the St. Louis area, is a Visiting Fellow in the Thomas A. Roe Institute for Economic Policy Studies at The Heritage Foundation.
