Abstract: The stereotype of the underworked government employee is frequently invoked in criticisms of public-sector employment. But does the average public employee really work less than the average private employee? To provide an objective answer, this paper uses the American Time Use Survey, which produces a detailed listing of personal activities on a given day for each respondent. Based on this dataset, government employees work around three fewer hours per week and roughly one less month per year than private-sector workers. Substantial differences in work time persist even after controlling for occupational and skill differences between sectors. The underworked government employee should be of concern to taxpayers who expect private-sector levels of work in the public sector in exchange for private-sector levels of compensation.
The stereotype of the underworked government employee is frequently invoked in critiques of public-sector employment practices. Critics suggest that government jobs routinely feature shorter workdays, prolonged sick leave, and extended vacation breaks. But does the average public employee really work less than the average private employee?
The question is important for practical economic reasons and for broader political considerations. From a budgetary perspective, shorter work hours in the public sector may cause governments to be less efficient in converting tax dollars into public services. More broadly, the perception that government employees do not work as hard as private-sector employees runs counter to the spirit of public service. Voters need assurances that government workers receive no special privileges as a result of their employment.
This Backgrounder compares the amount of time that government and private employees spend working, using a rich and detailed dataset known as the American Time Use Survey.
Inadequate Measures of Work Time
Researchers often measure work time using “contract hours,” meaning the amount of time that employers require their employees to be at work. Contract hours generally show public workers receiving more official paid leave than private workers.[1] But many employees, both public and private, routinely take work home, skip lunch breaks, pass up vacation days, or go to the office on weekends. Others may regularly come to the office late and duck out early. Little of this variation in work time is captured by contract hours, which could be unfair to employees who frequently work off the clock. Measuring work time using contract hours can be especially inadequate for school teachers, who have shorter official workdays but often grade papers or develop lesson plans at home.[2]
As an alternative to contract hours, researchers have used surveys that directly ask individuals about the hours they work. The Current Population Survey (CPS), for example, poses this question in its annual March supplement: “In the weeks that [you] worked, how many hours did [you] usually work per week?” Responses indicate that private employees work about the same number of total hours as federal employees and slightly more hours than state and local employees.[3] But answers to open-ended questions like these are susceptible to exaggeration and subjectivity regarding what each respondent actually defines as work. The CPS in particular yields overestimates of work time.[4]
Although both contract hours and worker surveys tend to show government employees as a group working less than private employees, better data are needed for an objective comparison.
The American Time Use Survey
The American Time Use Survey (ATUS) is a “time diary” dataset sponsored by the Bureau of Labor Statistics (BLS) that catalogues in detail each respondent’s activities, including work time, during a full 24-hour period.[5] Now totaling around 13,000 responding households per year, the ATUS sample is a representative subset of the CPS.
Respondents are notified in advance of the interview and are reminded to describe activities that occurred specifically on the day prior to the interview. Interviewers go through the entire 24-hour day, noting all of the activities mentioned by the respondent. The respondent’s raw answers are then placed by BLS researchers into a detailed set of activity categories that are standardized across all respondents.
A major strength of the ATUS is that it does not undercount working at home versus working at an office, or working evenings rather than regular business hours. If someone is working at 2:00 a.m. on a Saturday, the ATUS will account for it. No other large-scale, nationally representative dataset used to estimate work time has this kind of objectivity and precision.
Another advantage of the ATUS interview process is that respondents are not asked to estimate the amount of time spent on any broad activity category. Respondents may naturally inflate time spent on useful or socially approved activities; they are less likely to do so here. They are never asked, for example, “How many hours did you work yesterday?” Instead, respondents describe all of their specific activities—such as, “I wrote an e-mail”—and then state whether that activity was performed for their job.
This Backgrounder uses the ATUS variable called “work, main job” and combines the results of each ATUS survey from 2003 through 2010. Aggregation produces a total sample of 1,776 federal workers, 8,053 state and local workers, and 39,042 private-sector workers. The ATUS data allow users to analyze both the number of hours individuals work during a typical workweek and the total number of hours they work during the calendar year. Thus, the ATUS can capture differences in both weekly work hours and the actual amount of time off that employees enjoy throughout the year.
Measuring Work Time with the ATUS
Each ATUS respondent is interviewed only once, but total interviews are spread throughout the year, ensuring that individual responses can be aggregated into a representative picture of the population (or of a subgroup) over the full calendar year.
If an individual ATUS respondent works six hours on his interview day, this individual does not necessarily work “6 hours x 7 days = 42 hours/week.” However, because other respondents were interviewed on other days of the week, the average work time for the group can be computed by averaging the six hours that Person A worked on Monday, the seven hours that Person B worked on Tuesday, the seven hours Person C worked on Wednesday, and so on, then multiplying the daily average by seven to get the full-week estimate.[6]
This method works only if the distribution of interview days throughout the week is roughly uniform. If half of the interviews were conducted on a Saturday, for example, adding up work times for each respondent would underestimate actual work time because weekdays are underrepresented.
The ATUS is weighted so that interview days for the sample as a whole are evenly distributed throughout the week. However, subgroups (such as government workers) will not necessarily have the same proportion of interview days on weekends as the overall sample. In order to account for this potential bias, separate averages for weekday hours and weekend hours are computed and then combined to produce an estimate for the full week.
Mathematically, “average weekly work time = 5 x (average work time on a weekday) + 2 x (average work time on a weekend day).” Similarly, the calculation of the average yearly work time weights weekdays by 261 (roughly the number of weekdays in a calendar year) and weekend days by 104.[7]
Results: Comparing Work Time During a Typical Workweek
To measure the typical workweek, this section excludes ATUS respondents who are on vacation or otherwise away from their jobs. Included in the analysis are respondents who describe their labor status as currently working full time (excluding the self-employed), who are between the ages of 18 and 64, who were not interviewed on a holiday, and for whom no interview problems were reported.
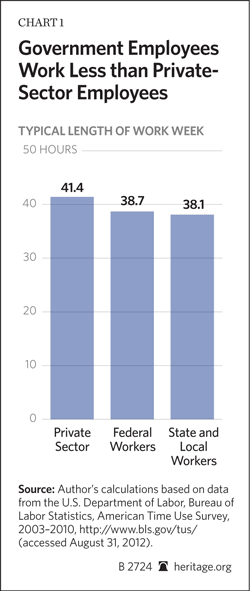
The results show that private-sector employees work 41.4 hours during a typical work-week. Federal workers, by contrast, put in 38.7 hours, and state and local government employees work 38.1 hours. As with all the public-private differences reported in this Backgrounder, the time differences between each government sector and the private sector are statistically significant at the 95 percent level or greater.
Results: Comparing Work Time During a Calendar Year
Working fewer hours in a typical week adds up to a substantial difference over the full year. Analyzing the full year also incorporates the impact of vacation and other paid leave on total work time.
Now added to the set of respondents above are workers whose employment status is “employed–absent,” in addition to the respondents in the previous section who were all “employed–at work.” Workers who are “employed–absent” may be on vacation, taking sick leave, or not working for some other reason despite being employed. Excluded from this full-year analysis are all school teachers, whose naturally shorter work year would skew the comparison.[8]
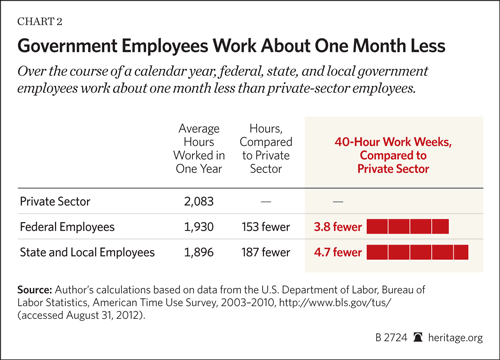
For ease of interpretation, “equivalent 40-hour workweeks” are compared by dividing total annual work hours by 40. Private-sector employees work the equivalent of 3.8 more 40-hour workweeks than federal employees, and 4.7 more weeks than state and local government workers. Put another way, private employees work about one month more each year than public employees.
Note that these figures reflect actual hours worked during the calendar year, not simply an estimate of hours based on a predetermined work schedule. There is no need to count how many vacation days or sick days that public and private workers receive—or to make any assumptions about work schedules at all—since the ATUS accounts for all work hours on any day.

Controlling for Skill and Occupational Differences
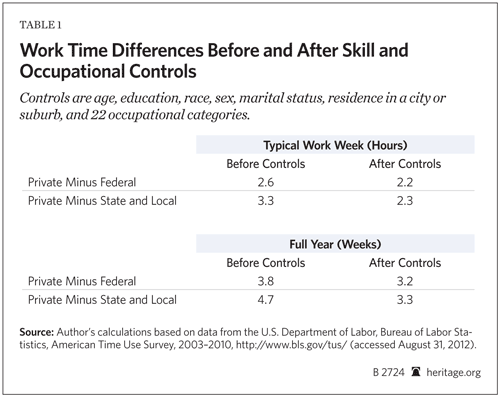
Are the differences in work time due to the different occupations and skills found in each sector? Only partially. A regression analysis[9] that controls for age, education, race, sex, marital status, residence in a metropolitan area, and 22 broad occupational indicator variables reveals that significant differences remain.
After controls, private-sector employees work 2.2 more hours per week than federal workers, and 3.2 more 40-hour weeks per year. Compared to state and local workers, private employees work 2.3 more hours per week and 3.3 more weeks per year. Therefore, the observed differences in work time are likely due in part to differences in public and private employment per se, not merely differences in types of jobs or workers in each sector. Table 1 summarizes the effects of the controls on the comparisons.

It is interesting to note how different controls affect the comparisons. Controlling for occupation shrinks the differences in work time, but controlling for individual characteristics increases the differences. (Table 1 reports the combined effects.) Put another way, public workers are partially “excused” for working shorter hours given their occupations, but they are especially “guilty” of working too little given their skills and demographic profile.
A control variable not included above is receipt of overtime pay. A recent paper attempted to explain the lower work time reported by state and local workers in the CPS this way: “Public employees, particularly higher level professional employees, have fewer opportunities to work overtime than those who work in the private sector.”[10] The overtime-opportunity theory is not directly relevant to this analysis, since the purpose here is to measure work time in the public and private sectors, not to speculate about how much government employees might work if employment policies changed. But it is worth noting that including a control variable for receiving overtime pay makes essentially no difference in the results of the work-time regression. Opportunity for overtime does not account for the public-private disparity in work time.
Caveats and Robustness Checks
All of the results presented above require an interpretive caveat. The ATUS measures work time, not work effort or work effectiveness. If, for example, one person works half as long but twice as hard as another person, both people may have equal productivity. How productive a public employee is compared to a private employee during a given hour of work is not something that can be analyzed with the ATUS.
Interpretation aside, the results are robust across alternative methods of data analysis. For example, the main results are based on averaging weekday hours and weekend hours separately, then combining them to estimate total hours. The purpose of separate estimates is to mitigate any effects of one group being interviewed more often on weekends, which would bias the results. Without separate weekday and weekend estimates, the public-private differences in work hours would be slightly greater than reported here.
A more sophisticated reweighting technique called entropy balancing was employed as an additional robustness check.[11] Rather than calculating weekdays and weekends separately, entropy balancing creates a new set of weights that ensures that all groups in question have exactly the same distribution of interviews across the week. The results were very similar to the simpler method of separating weekdays and weekends.
Finally, the definition of work used in the paper (“work, main job”) excludes “work-related activities,” such as commuting or meeting co-workers in social settings. But using a broader definition of work does not substantially affect the results.
Conclusion
According to a detailed “time diary” dataset that measures work wherever and whenever it takes place, government employees work around three fewer hours per week and roughly one less month per year than private-sector workers. Substantial differences in work time persist even after controlling for occupational and skill differences between sectors.
The “underworked” government employee should be of concern to taxpayers who expect private-sector levels of work in the public sector in exchange for private-sector levels of compensation. With several recent studies suggesting an overall compensation premium for public employees,[12] reducing aspects of that premium—such as paid leave—could be part of a larger strategy to shrink the pay gap and save taxpayer money.[13] More generally, work time differences are a reminder to lawmakers that they should ensure that public employees’ work time and compensation are generally in line with those of private-sector employees.
—Jason Richwine, Ph.D., is Senior Policy Analyst for Empirical Studies in the Domestic Policy Studies Department at The Heritage Foundation.


