Abstract: The post-recession economy has undergone the slowest recovery in 70 years. In addition to more than 8 percent unemployment, labor force participation has fallen sharply since the recession began in December 2007. Today, nearly 5 million fewer Americans are working or searching for work. The drop in unemployment since 2009 is almost entirely due to the fact that those not looking for work do not count as unemployed. Demographic factors explain one-fifth of the decreased labor force participation. The rest comes from increased school enrollment and more people collecting disability benefits. Six percent of U.S. adults are now on disability insurance. This is no time to make it more difficult for businesses to create jobs.
The American economy is experiencing the slowest recovery in 70 years. In addition to persistently high unemployment, labor force participation has fallen sharply since the recession began in December 2007. Today, nearly 5 million fewer Americans are working or looking for work. This drop accounts for virtually the entire reduction of the unemployment rate since 2009—those not looking for work do not count as unemployed.
Demographic changes explain approximately one-fifth of the drop in labor force participation. The baby boomers are aging and thus more likely to retire, dropping out of the labor force. The remaining drop in participation primarily comes from millions more people going on disability insurance or attending school. While those enrolled in school will probably return to the labor force, those going on the disability rolls will not. They will remain permanently outside the labor force.
The difficulty of finding a job drives both these changes. Job creation fell sharply after the recession began, and—unlike the number of layoffs—has not recovered. The government’s responses have been largely ineffective. Instead of voting for vast subsidies and public works programs, Congress should reduce the tax and regulatory burden it imposes on businesses to encourage hiring and stop the fall in labor force participation.
The Slow Recovery
The collapse of the housing bubble and the resulting financial crisis sent the U.S. economy into a recession in December 2007. Recessions and financial crises are not unusual occurrences. The savings and loan crisis and the Volcker disinflation contributed to the recessions of the early 1990s and 1980s, respectively. The recovery from both these recessions was strong. What is unusual about today’s economy is how slowly it has recovered.
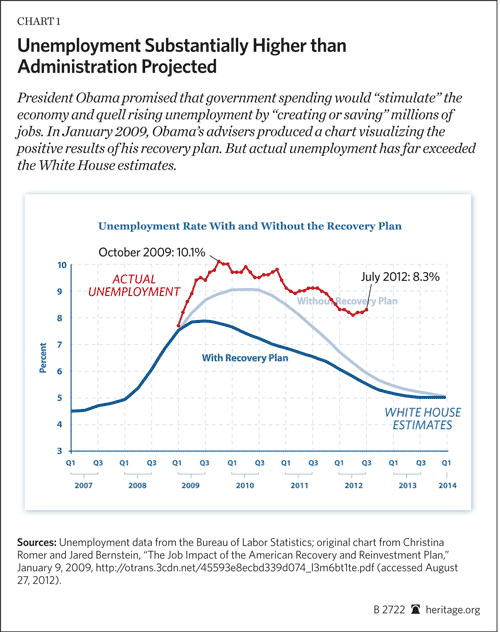
Officially, the current recession ended in June 2009—the month that, despite a 9.5 percent unemployment rate, marked the end of the last quarter of contracting GDP. When President Barack Obama took office in early 2009, his Administration projected that if Congress passed his stimulus package, unemployment would fall from 7.8 percent at that time to 5.5 percent by late 2012. The Administration warned that if Congress did not pass the stimulus package, unemployment would fall to only 6 percent by the end of 2012. Congress passed the stimulus, yet unemployment rose to 10 percent in October 2009, and has remained above 8 percent since then. Total employment in the economy remains 3.4 percent below the pre-recession peak of 138 million workers.[1]
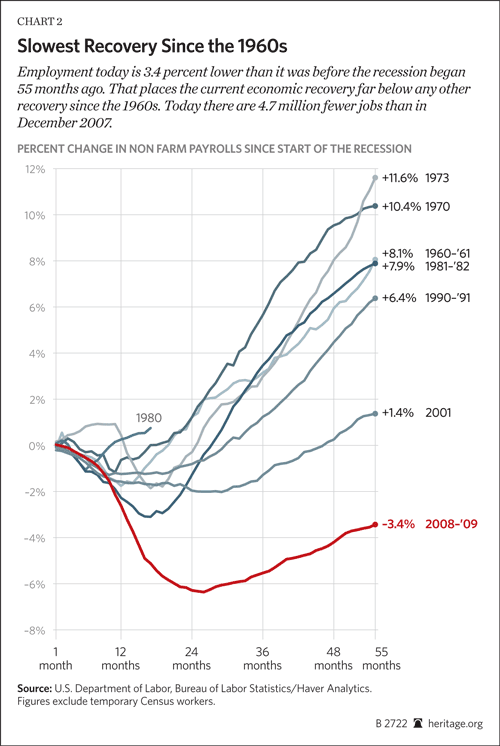
This represents the slowest recovery in the post war era. After every other recession, the economy fully replaced the lost (net) employment within two to four years of the recession’s onset. Investors and entrepreneurs rapidly found productive new uses for the millions of idled workers and billions in idle capital. Not since the Great Depression has employment remained below its pre-recession levels four and a half years after a downturn started.
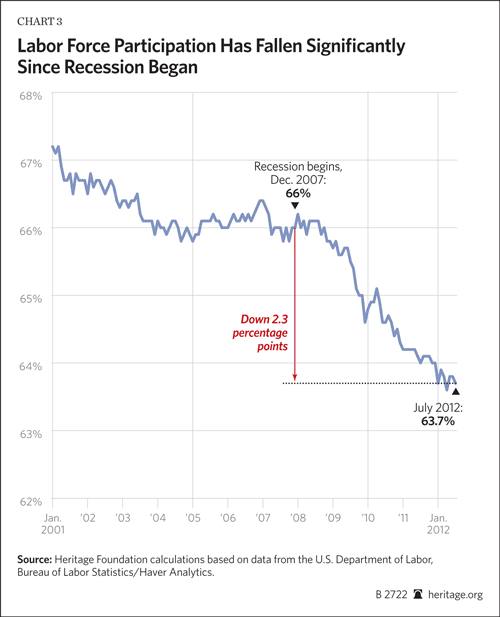
Lower Participation = Lower Unemployment Rate. As high as the unemployment numbers are, they still overstate the economy’s performance. Since the recession began, the labor force participation rate—the proportion of adults either working or trying to find work—has fallen by approximately 2 percentage points. The government counts only people activelylooking for jobs as unemployed. The drop in labor force participation accounts for the entire net drop in the unemployment rate over the past three years.
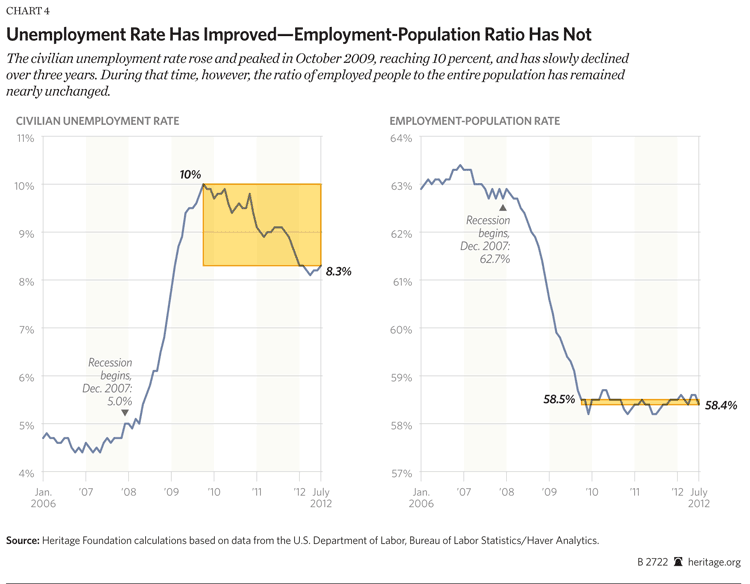
Another measure of the state of the labor market is the employment-population ratio. This ratio shows employees as a proportion of all adults, both those looking for work and those outside the labor force. During the recession, the employment-population ratio fell sharply and the unemployment rate increased. Since then, the unemployment rate has improved modestly. The employment-population ratio has not.
The unemployment rate peaked at 10.0 percent in October 2009 and currently stands at 8.3 percent. The employment-population ratio has gone from 58.5 percent to 58.4 percent during this time—a statistically insignificant change. Unemployment has fallen because fewer Americans are looking for work, not because more Americans are finding jobs. Job creation since the recession ended has only been enough to keep pace with population growth.
A Smaller Labor Force—What It Means
Understanding why labor force participation has fallen is critically important for assessing the state of the economy. When millions of people would like to be employed, but have given up on finding work, the official unemployment rate understates the weakness of the labor market. It omits millions of potential workers who have become so discouraged they have stopped job searching.
On the other hand, economists are expecting labor force participation to fall no matter what happens in the labor market. The first of the baby boomers turned 65 in 2011. People in their 60s are considerably less likely to work and more likely to retire than those in their 50s. An aging population will push down labor force participation whether the economy does well or poorly. The aging of the baby boomers presents economic challenges for America, but these challenges have nothing to do with the cyclical state of the economy. If demographic changes explain most of the drop in labor force participation, then the unemployment rate accurately measures the health of the economy.
Examining the Drop in Employment. The Bureau of Labor Statistics (BLS) surveys a representative sample of tens of thousands of households each month. The BLS reports the proportion of Americans who are employed, unemployed, and not in the labor force. People outside the labor force do many things: enjoy their retirement, study in school, collect disability benefits, take care of family members, or fight illness.[2] The BLS asks individuals outside the labor force what they are doing, but does not regularly report these details.
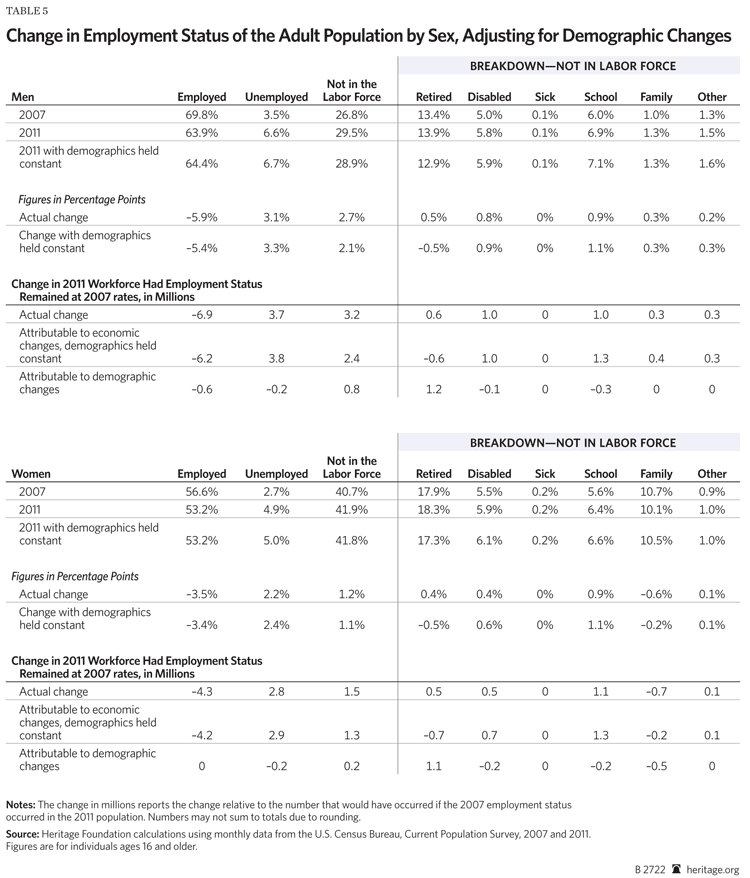
The Heritage Foundation analyzed micro-data from the BLS’s Current Population Survey to break down the changes in employment, unemployment, and those outside the labor force. Table 1 shows the change in these figures between 2007 (the last year before the recession) and 2011 (the most recent full year in the recovery).[3] Table 1 also shows how those figures would be different if the employment, unemployment, and not in labor force rates had remained constant between 2007 and 2011.[4]
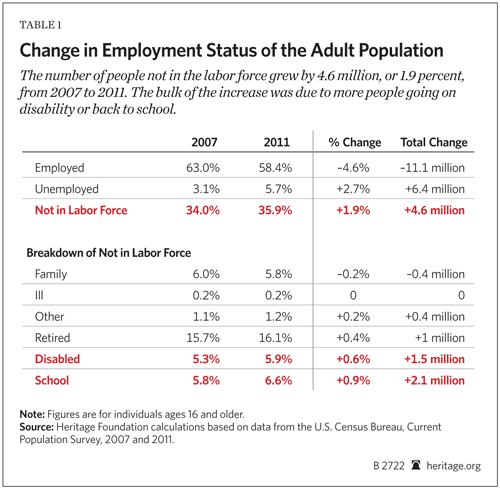
Between 2007 and 2011 the employment-population ratio fell by 4.6 percentage points, while the unemployment-population ratio increased by 2.7 percentage points and the labor force participation rate fell by 1.9 percentage points.[5] Had employment and unemployment remained at their previous rates, 11 million more Americans would have jobs: 6.4 million fewer unemployed Americans and 4.6 million more Americans participating in the labor force.
Three categories explain the bulk of the decrease in labor force participation. The proportion of those outside the labor force and attending school has risen by 0.9 percent (2.1 million), the proportion collecting disability insurance has risen by 0.6 percent (1.5 million), and the proportion of retirees increased by 0.4 percent (1 million). There were small changes in the proportion of those outside the labor force and spending time with family (–0.2 percent) or who remain outside the labor force for “other” reasons (+0.2 percent), while the proportion of those not working due to illness (0.2percent) did not change.
These figures do not reveal what portion of these changes demographic changes caused and what portion the recession caused. The aging of the baby boomers should naturally cause more Americans to retire, pushing down labor force participation. Conversely, the generation of workers currently retiring has less education than the generations succeeding them. More educated workers have higher labor force participation rates. Rising education levels will increase labor force participation.
Change in Labor Force Status by Age. Table 2 shows the change in the employment status of the adult population by age and education categories. The recession has not affected everyone equally. Workers aged 16 to 24 experienced the largest drop in employment (-7.7 percentage points) and the largest increase in those outside the labor force (+4.4 percentage points). Conversely, the employment rate of workers 55 and older slightly increased (+0.2 percentage point) and the proportion of those 55 and older outside the labor force fell by 1.7 percentage points.
The latter change is driven by a sharp decrease in retirement rates (–2.4 percentage points). Older Americans are less likely to retire now than before the recession began. However, workers 55 and older are still more likely to be outside the labor force (usually retired) than any other age group. This is why the aging of the population has increased the number of retirees even as the retirement rate has fallen.
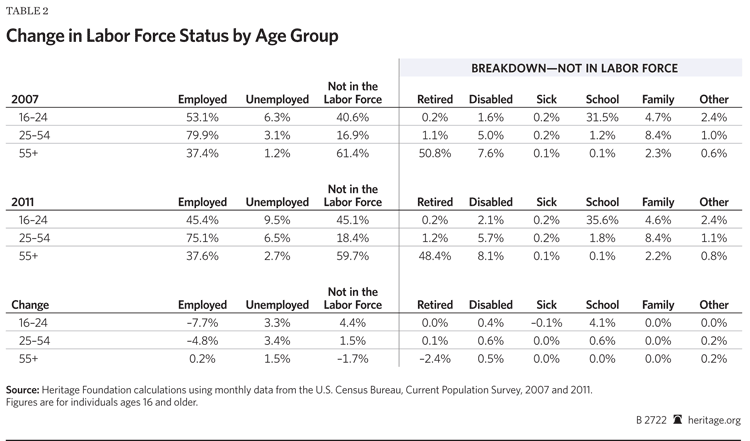
The increase in disability insurance varies little by age group. Workers in all categories were between 0.4 and 0.6 percentage point more likely to be on Social Security Disability Insurance (SSDI) in 2011. The same is not true of schooling. The largest increase in those outside the labor force and attending school—unsurprisingly—came among younger workers (+4.6 percentage points).
This does not necessarily mean that younger Americans are more likely to enroll in school. The “employed” and “not in the labor force–in school” categories are mutually exclusive. It could also be that students who in the past would have had part-time jobs now cannot find work. Thus, they are classified as outside the labor force. These figures show how the activities of those outside the labor force have changed. They do not show whether those outside the labor force and in school would take jobs if they could get them.
Change in Labor Force Status by Education. Table 3 shows how the labor force status has changed by educational attainment.[6] Even before the recession those with more education were more attached to the labor force and had lower unemployment rates. The burden of the recession has fallen heaviest on those with less education. The employment rates of those with less than a high school degree (–6.0 percentage points) and high school graduates (–6.2 percentage points) have fallen the most. These groups also have the largest decreases in labor force participation (3.4 percentage points and 2.7 percentage points, respectively). Workers with bachelor’s degrees saw considerably smaller (–3.7 percentage points) decreases in their employment rates and labor force participation rates (1.5 percentage points).
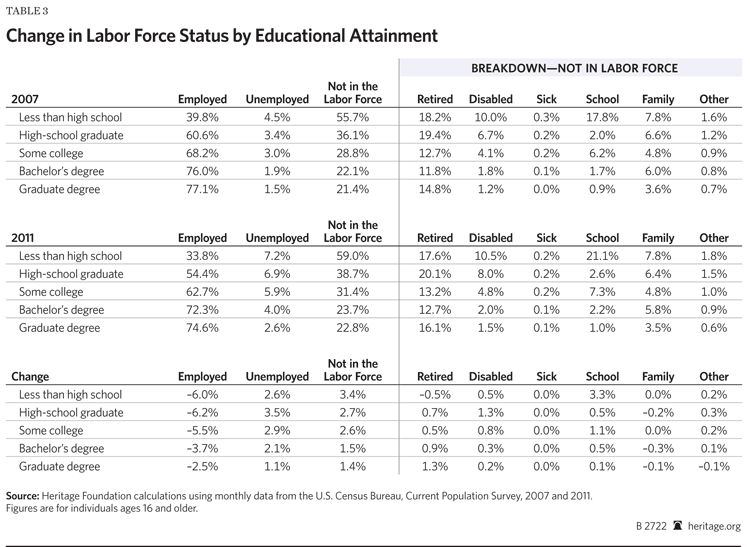
A substantial part of the drop in labor force participation for workers without a high school degree comes from those enrolled in school (+3.3 percentage points). Many of these individuals are younger Americans studying in high school. The recession has encouraged many of them to continue their education—it will be difficult for them to find a job if they drop out. Similarly, difficulty finding part-time jobs has caused many students to drop out of the labor force, though they remain in school.
Table 3 also shows notable differences in disability insurance claims. The increase in workers dropping out of the labor force and going on disability insurance was greatest for workers with at most a high school degree (+1.3 percentage points) or with some college education (+0.8 percent). Workers with a bachelor’s degree (+0.3 percentage points) or a graduate degree (+0.2 percentage points) were considerably less likely to increase their use of disability insurance.
Holding Demographics Constant. Tables 2 and 3 demonstrate the importance of controlling for demographic factors before drawing conclusions about the economy. An older or more educated workforce will have a different attachment to the labor force than a younger, less educated workforce. One way to control for demographic changes is to calculate what the employment status of the overall population would look like if the age–sex–education distribution of the population did not change but the employment status of each separate age–sex–education group changed as it actually did.[7] This hypothetical employment status shows what the unemployment rate would have been if demographics remained unchanged since 2007.
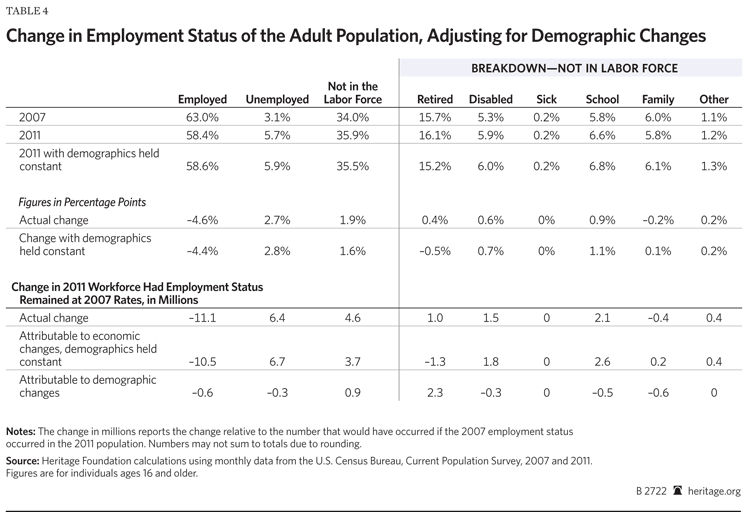
Table 4 shows the actual and hypothetical change in the employment status of the adult population. The employment-population ratio fell by 4.6 percentage points, of which 4.4 percentage points remain after controlling for demographics. Similarly, 1.6 percentage points (3.7 million people) of the 1.9 percentage point (4.6 million people) decrease in labor force participation remains after controlling for demographic factors. Approximately one-fifth of the drop in labor force participation is due to demographic—not strictly economic—factors. A recent Federal Reserve Bank of Chicago study came to a similar conclusion, finding that demographic factors accounted for one-quarter of the drop in labor force participation between 2008 and 2011.[8]
After accounting for demographics, three major categories of workers outside the labor force changed significantly between 2007 and 2011.[9] The increase in retirements decreased the labor force participation rate by 0.4 percentage point.[10] That increase was due entirely to the aging population. Older workers have become much less likely to retire since 2007. If America’s demographic makeup had not changed between 2007 and 2011, lower retirement rates would have increased the labor force participation rate by 0.5 percentage point.
Controlling for demographics also increases the number of those who are outside the labor force and attending school. The demographics-adjusted increase rises from 0.9 percentage point (2.1 million people) to 1.1 percentage points (2.6 million people). The aging population means that fewer people are likely to be enrolled in school. Controlling for this, the increase in those not participating in the labor force and enrolled in school becomes even more pronounced.
A similar phenomenon explains the demographics-adjusted increase in disability insurance recipients. Overall the proportion of workers claiming disability insurance increased by 0.6 percentage point—1.5 million more people. However, more educated workers are less likely to collect disability insurance than workers with lower levels of education. (See Table 3.) As older workers leave the labor force, they are being replaced by workers who are, on average, better educated than they are. This trend should reduce disability claims. Had the population not become more educated, disability claims would have risen by 0.7 percentage point (1.8 million workers). Controlling for demographic changes makes the recent increase in disability insurance even more pronounced.
Each of these factors—disability claims, schooling, and retirement—reflects weakness in the labor market.
Disability Insurance Claims Rising. The Current Population Survey data showing rising disability claims tracks closely with Social Security Administration (SSA) data. SSA data shows the number of workers applying for SSDI benefits has been increasing, and that increase has accelerated in the recession. By the end of 2001, the SSA paid out disability benefits to 5.3 million workers and granted disability status to an average of 57,600 people per month.[11] By December 2007, those figures had grown to 7.1 million workers collecting SSDI and an average of 68,900 new disability benefits awards per month. During the recession, SSDI use has increased even more rapidly. By July 2012, fully 8.8 million workers were collecting disability benefits and an average of 82,400 new beneficiaries were joining each month.[12] Over the past decade, the number of workers collecting disability insurance has risen by 3.5 million—66 percentage points. Of that increase, 1.7 million workers (31 percentage points) came after the recessionbegan.
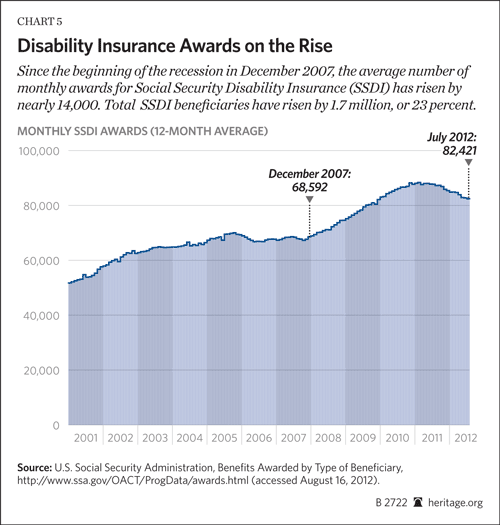
Americans have not become sicker over the past 10 years. Surveys show that Americans’ health has improved. Mortality rates have fallen, too. Advances in medical technology allow most Americans to live healthier and better lives.[13] Nonetheless, disability insurance claims continue to rise.
Studies show that a significant number of workers who apply for disability benefits are not entirely disabled. They have medical conditions that qualify them for benefits, but under other circumstances they could work at some type of job. Given the option of receiving benefits, however, they take them.[14] The effect is particularly pronounced for lower-income workers, who are much more likely to be affected by a difficult job market: SSDI benefits represent a significantly larger proportion of their potential earnings. In a recession, layoffs increase—especially among less skilled workers—and finding work becomes particularly hard. This leads many workers who lose their jobs to apply for disability benefits instead.
Unfortunately, very few of these workers will ever return to the labor force. The overwhelming majority of people who leave the disability insurance program do so because they either qualify for Social Security retirement benefits (53 percent) or because they die (37 percent). Just 9 percent of SSDI beneficiaries who leave the system do so because their health has improved enough so that they no longer qualify for benefits.[15] Even fewer workers voluntarily leave disability insurance to work. Congress created the “Ticket-to-Work” program in 1999, which allowed SSDI beneficiaries to return to work while keeping their health coverage. Over the next seven years, fewer than 1,400 claimants used the program to return to work.[16]
The decrease in labor force participation as workers apply for disability benefits is probably permanent. In addition to hurting the economy, this decrease adds to the severe strain on Social Security’s finances. The government currently spends $128 billion a year on SSDI payments—more than one of every six Social Security dollars—and pays tens of billions more for health benefits for SSDI beneficiaries.[17] The Social Security Disability Insurance trust fund is now rapidly running out of money.
School Enrollment. The proportion of workers who are outside the labor force and enrolled in school has also risen sharply in the recession. Together, the increase in individuals enrolled in school and the increase in workers collecting disability benefits account for virtually all of the non-demographic decrease in labor force participation. Like disability insurance, this reflects the weakness of the labor market—especially for younger workers.
The recession hit younger people particularly hard. Hiring fell sharply, and there are now fewer job openings. Young people face competition from more experienced workers for existing openings. As Table 2 shows, employment has fallen substantially more among 16-to-24-year-olds than among older workers.
The weak economy mechanically increases the proportion of workers who are outside the labor force and enrolled in school. Many students who would have formerly taken part-time jobs now cannot find work, and have stopped looking. Thus they go from being classified as employed to being outside the labor force.
The weak economy also encourages potential students to attend, return to, or remain in school. Education can help workers find jobs in a difficult economy. Further, one of the greatest costs of obtaining an education is the opportunity cost of going to school. Most students cannot work full-time jobs while studying full-time. They forgo the income they could have earned in order to study. In a recession, when job opportunities decrease, this opportunity cost falls. It becomes relatively less expensive to go to school: Students only lose money by not working if they could have found a job in the first place. A weak economy will cause many people to attend school that would not otherwise.
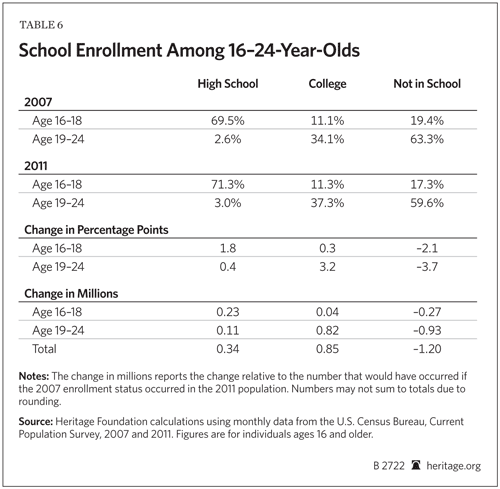
The Current Population Survey only asks those between the ages of 16 and 24 directly about their school enrollment.[18] As a result, it is only possible to determine the portion of this increase that comes from higher school enrollment for youth.
Table 6 shows how school enrollment has changed, since the recession began, for 16-to-18-year-olds and for 19-to-24-year-olds. Both high school and college enrollment have increased by two to three percentage points. Overall, there are 340,000 more young people enrolled in high school, and 850,000 more young people enrolled in two-year and four-year colleges than if enrollment rates had not increased—1.2 million more students in total. The number of youth in school and not participating in the labor force has increased by 1.6 million.[19] Thus, among younger workers, three-quarters of the net school-related decrease in labor force participation stems from increased school enrollment. The remaining one-quarter comes from young people who are unable to find part-time jobs while in school.
Unlike workers who collect disability insurance, students are very likely to return to the labor force when they complete their studies. When they do, they will probably have greater earning potential. The recession has increased the number of people who do not participate in the labor force and who are in school. However, as long as these students are gaining valuable skills from their studies, this is unlikely to negatively affect the economy in the long term.
Retirement. Decreasing retirement rates reflect a combination of the long-term shift to 401(k)-style defined-contribution (DC) retirement plans and the weaker economy. Defined-benefit (DB) pension plans provide workers with a fixed pension upon retirement. Once an employee with a DB pension qualifies for his maximum benefit, he has no financial incentive to keep working. His retirement income will not increase. Workers with a 401(k) plan, however, have strong incentives to keep working past their official retirement age. Each extra year of work adds to their savings and enables them to accumulate a larger nest egg. At the same time, delayed retirement allows workers to delay drawing down their savings. The increased use of DC pensions encourages employees to delay retirement.
The recession has amplified that incentive. The stock market has not performed as well as many workers nearing retirement age had expected. They are now delaying retirement in order to accumulate more savings and make up their losses.
Long-term retirement rates will probably continue to fall, even as demographic changes increase the number of retirees. The Congressional Budget Office predicts that the number of workers per Social Security beneficiary will fall from the current 3-to-1 ratio to 2-to-1 over the next 25 years.[20] Those not participating in the labor force can only consume the wealth produced by those working in it. An aging population means that older workers will either have to accept a lower standard of living in retirement—there are fewer workers to support their consumption—or delay their retirement in order to accumulate larger savings.
Stalled Job Creation
What has caused the labor market weakness that has both kept unemployment high and depressed labor force participation? The immediate answer seems obvious: job losses. Thousands of companies have gone out of business or downsized, laying off millions of workers and increasing unemployment. While this answer contains a large element of truth, layoffs and job losses are not the main reason unemployment remains high.
Layoffs surged at the start of the recession, rising from 5.7 million in the fourth quarter of 2007 to 7.6 million in the first quarter of 2009, a 34 percent increase.[21] Between 2007 and 2009 16 percent of American workers went through at least one layoff.[22]
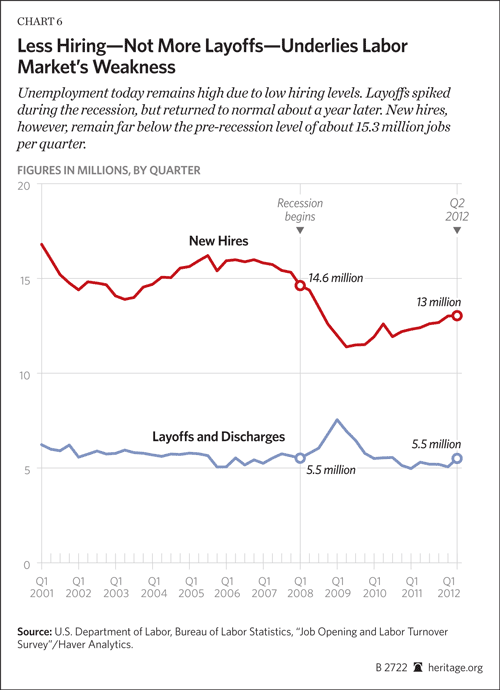
Since then, however, layoffs have returned to normal levels. In the first quarter of 2012, employers laid off 5.5 million workers.[23] Employees with jobs today are, in fact, slightly less likely to lose them than they were when the recession began.
Unemployment remains high because new job creation dropped when the recession began and has not recovered. Employers hired 13 million new employees in the second quarter of 2012—15 percent fewer than the 15.3 million new workers hired in the last quarter of 2007. Unemployment remains high primarily because businesses are creating fewer new jobs—not because of increased layoffs.
Note to Congress
Job creation and new hiring remain low for several reasons. The most prominent are the lingering effects of the collapse of the housing bubble and resulting financial crisis, as well as the domestic consequences of the economic slowdowns in Europe and China. The U.S. government has also contributed to the problem. Excessive taxes and increased regulation discourage risk-taking and investment. Prominent leaders in Congress have announced their intentions to raise taxes by $500 billion in January 2013.[24] The Administration has increased the regulatory burden facing businesses, especially in health care.
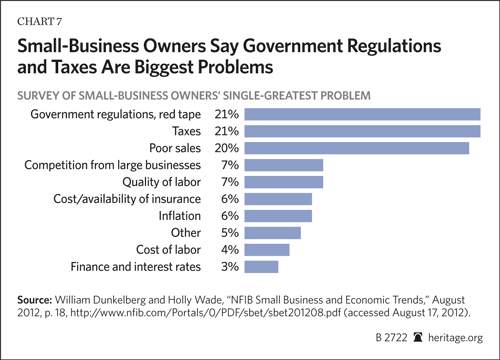
Small-business owners report that tax burden and government red tape are significant problems. In fact, small-business owners are statistically as likely to cite either taxes (21 percent) or regulations and red tape (21 percent) as poor sales (20 percent) as their single greatest problem.[25]
Congress cannot control Europe’s economy or retroactively undo the housing bubble. However, Congress does have direct control over the taxes and regulations it imposes on employers. Congress should commit to not raising taxes and should streamline or eliminate unnecessary regulations. The government should reduce the burden on those who are creating jobs during the weakest labor market in two generations.
Conclusion
The economy has barely recovered from the Great Recession. More than four years after the recession started, unemployment remains above 8 percent. Even this unemployment rate does not fully measure the weakness in the economy. Labor force participation has fallen by about two percentage points since the recession began. Some of that decrease is due to demographic factors, primarily the beginning retirements of baby boomers. But such demographics explain only one-fifth of the decrease—a weak labor market explains the remaining four-fifths of the drop in labor force participation.
The workers who have dropped out of the labor force for economic reasons are primarily engaged in one of two activities: collecting disability benefits or studying in school. Many workers have turned to disability benefits for income in the recession. This has increased the number of disability beneficiaries by 1.5 million since the recession began. These workers will probably remain permanently outside the labor force. Many other potential workers are now outside the labor force but attending school, partly reflecting the difficulty of finding work: Many students who would like part-time jobs cannot find them. Others have decided to enroll in or remain in school during the down economy. Increased high school and college enrollment rates among 16-to-24-year-olds have increased school attendance by 1.2 million.
The labor market remains weak not because of layoffs—which have sunk to pre-recession levels—but because job creation and new hiring have fallen. The housing bubble and European economic crisis continue to hold back the economy, ailments that Congress can do nothing about. Congress can do something about the tax and regulatory burden it imposes on businesses. Small-business owners report that taxes and regulations are as great a problem to them as poor sales. Congress should prevent taxes from rising and streamline unnecessary and overly burdensome regulations. The weakest labor market in two generations is no time to make it more difficult for businesses to expand and create jobs.
—James Sherk is Senior Policy Analyst in Labor Economics in the Center for Data Analysis at The Heritage Foundation. The author is grateful to Heritage Foundation intern Stephanie Jaczkowski for her assistance with this report.
Appendix
Methodology
The principal data source for this report was the 2007 and 2011 monthly micro-data from the Current Population Survey conducted by the Bureau Labor Statistics in conjunction with the Census Bureau. Variable construction was a large part of the analysis.
Employment status was measured using a constructed variable combining two survey responses. One variable (PEMLR) classified respondents as “employed–at work,” “employed–absent,” “unemployed–on layoff,” “unemployed–looking,” “not in labor force–retired,” “not in labor force–disabled,” and “not in labor force–other.” The two employed and unemployed responses were combined to create single “employed” and “unemployed categories.” Another variable (PENLFACT) asks people outside the labor force what they are doing: disabled, ill, in school, taking care of home or family, in retirement, or other. The responses to these “not in the labor force” questions were combined with the responses to PEMLR to create one variable that classified workers under eight different possible employment statuses: (1) employed, (2) unemployed, (3) not in the labor force–retired, (4) not in the labor force–disabled, (5) not in the labor force–ill, (6) not in the labor force–taking care of family, (7) not in the labor force–at school, and (8) not in the labor force–other. The analysis presented in Tables 1 to 5 uses this constructed variable.
To control for demographic changes, Heritage Foundation analysts divided the population by male and female, by three age categories (16–24, 25–54, and 55+), and by five educational attainment categories (less than a high school degree, high school degree, some college, bachelor’s degree, or graduate degree). Workers with an associate’s degree were classified as having “some college” education. These three groupings produced 3 x 2 x 5 = 30 possible sex/age/education cells.
To control for demographics and produce Tables 4 and 5, Heritage Foundation analysts calculated the employment status of the adult population in 2007 and 2011 in each of these cells, as well as the proportion of the overall population they represented (i.e., women ages 25–54 with some college education made up 7.9 percent of the adult population in 2007 and 7.7 percent in 2011). Heritage analysts then constructed a hypothetical 2011 employment status by taking a weighted average of the cell-specific employment statuses in 2011, using the proportion of the overall population in each cell in 2007 as the weights instead of the proportion in each cell in 2011 (i.e., 7.9 percent instead of 7.7 percent). This yields a hypothetical employment status for the economy assuming the sex/age/education makeup of the U.S. had not changed in the recession.
Except in the SSA administrative data in Chart 5, the changes in the number of people reported for a given employment status are relative to the number of people that would have been in that status in 2011 if the labor participation rates had not changed. For example, Table 2 shows a 1.5 million person increase in disability insurance recipients. Current Population Survey data show that 12.2 million people were on SSDI in 2007 and 14.1 million people on SSDI in 2011—a 1.9 million person increase. However, the adult population also grew from 231.9 million to 239.6 million people. This would have increased the number of SSDI recipients even if the rate of SSDI receipt had not changed. The 1.5 million figure accounts for this population growth. It shows how many more people are on SSDI now than would have been the case if SSDI rates had remained at their 2007 level.


