Abstract: The annual federal budget deficit is projected to reach 8.3 percent of gross domestic product (GDP) by 2020—more than three times the historical average of 2.3 percent. This dramatic increase in the federal deficit will be exclusively the result of increasing spending, not declining revenues (or the 2001 and 2003 tax cuts). Rapid growth in Social Security, Medicare, and Medicaid costs and interest payments on the national debt will cause virtually all of this new spending. Any sustainable fix must therefore address the source of the problem—rapidly rising entitlement spending.
The surging budget deficit will likely dominate the national economic debate for years to come. Even after the recession ends, persistent trillion-dollar deficits are projected to double the national debt by the end of the decade. In the absence of reform, the financial markets will eventually respond by withdrawing capital, pushing up interest rates, and demanding immediate budget reforms—much like Greece is currently experiencing.
Putting the federal budget on a sustainable path will require drastic reforms. Balancing the budget by 2020 would require either eliminating one-third of all spending, raising taxes by 50 percent, or a combination of the two. This enormous budget constraint will set the framework for all budgeting decisions—from taxes to health care, from education to Social Security.
Finding a solution to growing deficits requires first correctly diagnosing their cause. Both recent and future budget deficits have been blamed largely on the 2001 and 2003 tax cuts, and to a lesser extent on the war on terrorism, but the data contradict these myths. In reality, spending is almost exclusively the problem:
- The 2001 and 2003 tax cuts were responsible for just 14 percent of the swing from the projected cumulative $5.6 trillion surplus for 2002–2011 to an actual $6.1 trillion deficit. The vast majority of the shift was due to higher spending and slower-than-projected economic growth.
- President Barack Obama’s assertion that most future deficits will result from the 2001 and 2003 tax cuts, the wars in Afghanistan and Iraq, and the Medicare drug entitlement is based on faulty methodology, but is still wrong even using that methodology.
- Above-average spending, not below-average revenues, accounts for 92 percent of rising budget deficits by 2014 and 100 percent by 2017.
- Nearly all rising spending will occur in Social Security, Medicare, Medicaid, and net interest payments.
Deficit reduction efforts should focus on the source of the problem: rising entitlement spending. Any attempt to split the difference between broad-based tax hikes and spending cuts should be rejected outright as a false solution.
Dissecting the Myths
The data contradict many popular myths about federal tax cuts and the rapidly expanding federal deficit.
Myth #1: The 2001 and 2003 tax cuts wiped out the $5.6 trillion surplus for 2002–2011.
Fact: They caused just 14 percent of the swing from projected surpluses to actual deficits.
The budget surplus peaked at $236 billion in 2000. However, Senator John Kerry (D–MA), among others, has criticized President George W. Bush for having “taken a $5.6 trillion surplus and turned it into deficits as far as the eye can see.”[1] The critics have pointed specifically to the $1.7 trillion in tax cuts enacted in 2001 and 2003 as the leading creator of deficits. However, the numbers tell a different story.
First, the $5.6 trillion surplus never actually existed. It represents the cumulative 2002–2011 budget surplus projected by the Congressional Budget Office (CBO) in early 2001. Instead, the United States is now set to run a $6.1 trillion deficit for 2002–2011—a swing of $11.7 trillion. The surplus projection itself was completely unrealistic. It assumed that the late-1990s economic and stock market bubbles would continue forever and generate record-high tax revenues. It assumed no recessions, no terrorist attacks, no wars, and no natural disasters. It also assumed that discretionary spending would fall to 1930s levels as a percentage of the gross domestic product (GDP).
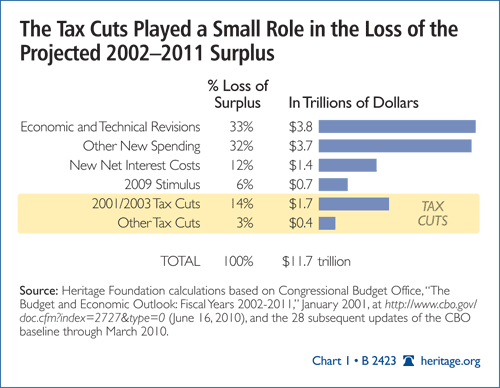
It is possible to diagnose the specific causes of the lost surplus. Since the 2001 budget surplus projection, the CBO has published 28 baseline updates. Each update specified the causes of the deteriorating surplus or expanding deficit since the previous update. Combined, the 28 updates identify the causes of the $11.7 trillion swing. As Chart 1 shows, these causes are:
- Economic and technical revisions ($3.8 trillion or 33 percent of the swing). Most of these arose from CBO’s early 2001 budget projections understandably not anticipating two recessions and two major stock market corrections over the decade.
- The 2001 and 2003 tax cuts ($1.7 trillion or 14 percent). These tax cuts receive most of the blame for the lost surplus, but are responsible for just one-seventh of it.[2] And the tax cuts for “the rich”—those earning more than $250,000 annually—account for just 4 percent of the saving.
- The 2009 stimulus ($0.7 trillion or 6 percent). The stimulus plays a significant role in the 2009 through 2011 budget deficits, but a small role in the overall deficits over the decade.
- Other new spending ($3.7 trillion or 32 percent). Defense spending accounts for $2 trillion, other discretionary spending for $700 billion, and new entitlement spending for $1 trillion. The largest entitlement expansions came from the new Medicare drug entitlement, financial bailouts, farm subsidies, and refundable tax credits.[3]
- New net interest costs ($1.4 trillion or 12 percent). Instead of the federal government paying off the entire national debt by 2009 as the CBO had projected in 2001, rising debt meant steeply rising net interest costs.
- Other tax cuts ($0.4 trillion or 3 percent). This includes the 2008 tax rebates, annual tax extension packages, and the patches to the alternative minimum tax (AMT).[4]
The 2001 and 2003 tax cuts accounted for just 14 percent of the swing from surplus to deficit. Even if these tax cuts had never been enacted, spending and economic factors would have guaranteed more than $4 trillion in deficits over the decade, and kept the budget in deficit every year except 2007.[5]
President Bush’s spending increases played a much larger role in the budget deficits. However, this does not mean that the Democrats, who criticized President Bush for not increasing spending enough, would have been any more responsible. They responded to President Bush’s $400 billion Medicare prescription drug bill with their own $800 billion proposal. They demanded even larger spending hikes than the President’s historic budget increases for education, health research, and veteran benefits. Finally, the largest supplemental appropriations for the wars in Iraq and Afghanistan were provided after the Democrats won control of Congress.[6]
Myth #2: Future deficits are “the result of not paying for two wars, two tax cuts, and an expensive prescription drug program.”
Fact: These policies play a relatively minor role in the growth of future deficits.
During his 2010 State of the Union Address, President Obama asserted:
At the beginning of the last decade, America had a budget surplus of over $200 billion. By the time I took office, we had a one-year deficit of over $1 trillion and projected deficits of $8 trillion over the next decade. Most of this was the result of not paying for two wars, two tax cuts, and an expensive prescription drug program.[7]
In other words, according to President Obama, the massive budget deficits are President Bush’s fault, but the data do not support this assertion. President Bush implemented the three policies mentioned by President Obama in the early 2000s. Yet by 2007—the last year before the recession— the budget deficit had stabilized at $161 billion. Since the combined annual cost of these three Bush-era policies is now relatively stable, they cannot have suddenly caused a trillion-dollar leap in budget deficits beginning in 2009.[8]
President Obama made this claim by comparing the costs of the three policies against a “current-policy budget baseline”—a snapshot of what the budget would look like for the next decade if today’s tax and spending policies are maintained. The President’s claim assumes that the cost of these policies (more than $4 trillion) comprises more than half of the projected $8 trillion baseline deficit over 10 years.
The first problem is the President’s current-policy baseline deficit of “$8 trillion over the next decade.” He likely began with the 10-year, $9 trillion deficit in the White House’s budget baseline released in 2009 and then subtracted his own stimulus law that had already been incorporated.[9]
Yet this $8 trillion baseline vastly understated the 10-year budget deficit. It assumed trillions more in tax revenues than the CBO baseline assumed under the same policies. It also assumed that spending growth on regular discretionary programs, which has doubled over the past decade, would slow to approximately 2 percent annually for most of the decade. This smaller baseline deficit makes the cost of the wars, tax cuts, and Medicare drug entitlement appear larger in proportion to the deficit.
A more realistic and up-to-date measure would begin with budget data from the more neutral CBO. According to CBO data, maintaining today’s tax and spending policies, assuming a gradual troop drawdown in Iraq and Afghanistan, will produce $13 trillion in deficits over the next decade.[10]
In contrast, the 10-year cost of extending the tax cuts ($3.2 trillion), the Medicare drug entitlement ($1 trillion), and Iraq and Afghanistan spending (approximately $500 billion, assuming a gradual troop drawdown) adds up to $4.7 trillion, a little more than one-third of the $13 trillion in baseline deficits.[11] (See Chart 2.) This contradicts the President’s claim that most of the deficits result from those three policies.
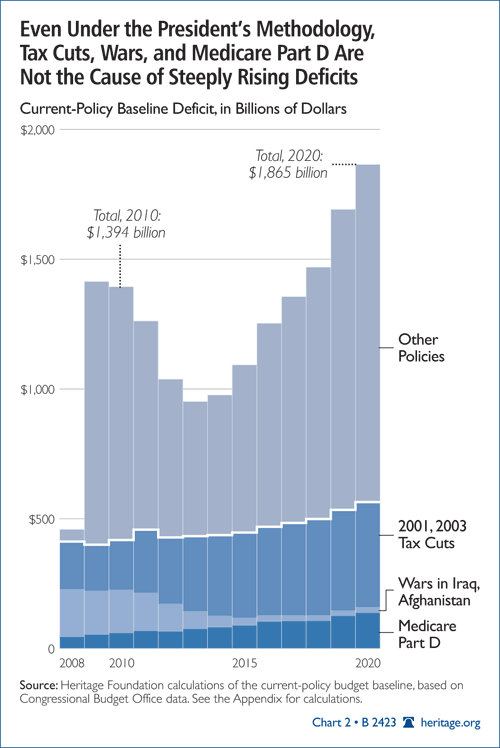
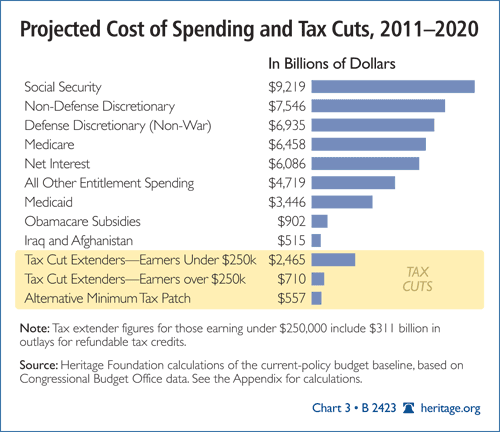
However, the larger problem is that the President’s entire methodology fails basic statistics. With Washington set to collect $33 trillion in taxes and spend $46 trillion over the next decade, how does one determine which spending programs “caused” the $13 trillion deficit? By the President’s methodology, one could blame any $13 trillion group of spending programs (or tax cuts) for the entire budget deficit. For example, the President could have blamed much of the 10-year budget deficit on Social Security (10-year cost of $9.2 trillion), antipoverty programs ($7 trillion), net interest on the debt ($6.1 trillion), or non-defense discretionary spending ($7.5 trillion).[12] (See Chart 3.) There is no legitimate, mathematical reason for President Obama to ignore all of these more expensive policies and single out the $4.7 trillion in tax cuts, the funding for the wars in Iraq and Afghanistan, and the Medicare drug entitlement. A better methodology would focus on which program costs are actually growing and pushing the deficit up.
Finally, there is some hypocrisy at work. President Obama criticizes President Bush for “not paying for two wars, two tax cuts, and an expensive prescription drug program.” Yet he would extend $4 trillion of these policies (while repealing $700 billion in tax cuts) without paying for them either. By his own faulty logic, he is almost as irresponsible as President Bush.
Myth #3: Declining revenues are driving future deficits.
Fact: Rapidly increasing entitlement spending will cause nearly 100 percent of rising long-term deficits.
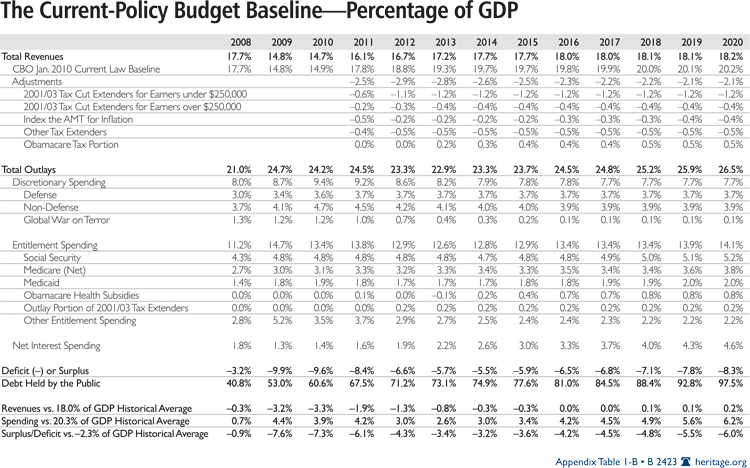
The proper way to diagnose the cause of long-term deficits is to measure taxes and spending against their historical averages. This identifies the moving variable that is causing the rising deficits. In this instance, it shows that runaway entitlement spending is overwhelmingly driving long-term deficits.
Over the past 50 years, Washington has collected an average of 18.0 percent of GDP in revenue, spent 20.3 percent of GDP, running a sustainable deficit of 2.3 percent of GDP. Annual figures have not deviated much from these averages. Even as tax rates fluctuated, tax revenues rarely deviated by more than 1 percentage point from 18.0 percent of GDP. The composition of spending has shifted dramatically from defense to entitlements, yet total spending has nearly always remained within 2 percentage points of 20.3 percent of GDP. Total spending and revenues have remained remarkably stable for the past 50 years.
Revenue stability should continue. Using CBO data, the current-policy budget baseline shows that tax revenues—currently down due to the recession—are projected to rebound to their historical average as the economy recovers. In fact, 2020 tax revenues are projected at 18.2 percent of GDP—slightly above the historical average.[13] This estimate assumes that the 2001 and 2003 tax cuts will be extended and the alternative minimum tax patched.
Yet spending stability has ended. Baseline spending is projected to leap to 23.7 percent of GDP by 2015 and to 26.5 percent by 2020—levels not seen since World War II. (See Chart 4.)
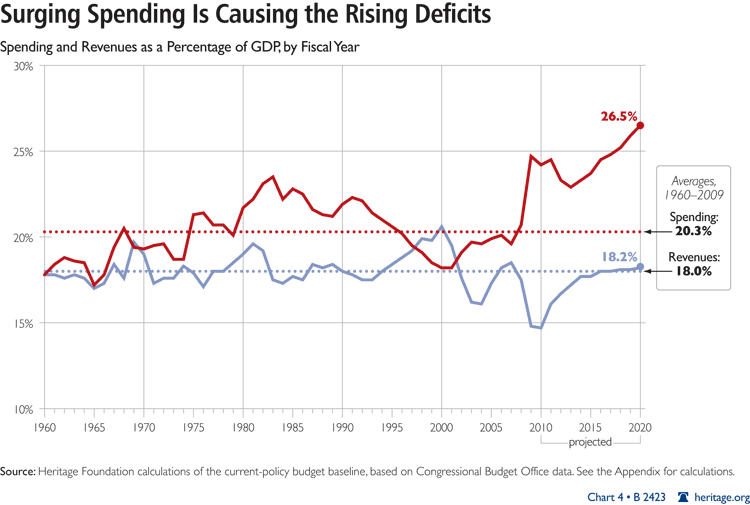
Thus, the 2020 budget deficit is projected at 8.3 percent of GDP—6.0 percentage points above the historical average. This will be the net effect of spending rising to 6.2 percentage points above the historical average, compared to tax revenues rising to 0.2 percentage point above the historical average.
The discrepancy is projected to grow over time. The CBO’s long-term budget projects that tax revenues will continue growing over the next 75 years, reaching a record 22 percent of GDP. However, spending will rise to an unfathomable 67 percent of GDP.[14]
Simply put, higher spending, not declining tax revenues, are causing the rising long-term budget deficits. Even if the 2001 and 2003 tax cuts and the AMT fix are extended, revenues will remain above the historical average and eventually reach record levels. This is true by any measure—nominal dollars, inflation-adjusted dollars, and percentage of the GDP.
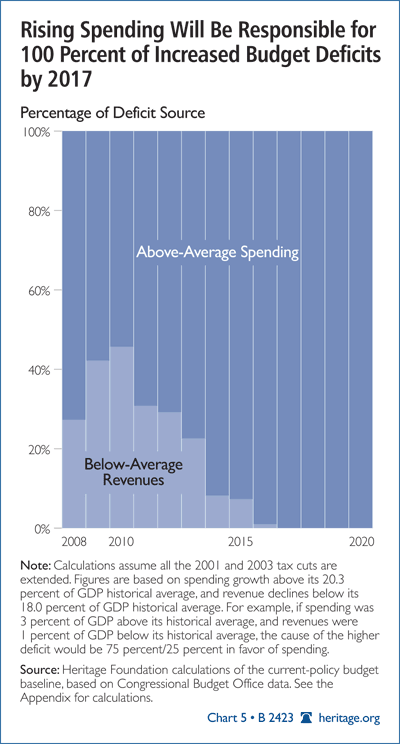
Entitlement Spending Dominates Spending Growth. Even within spending, the cause of rising long-term deficits can be identified. Between 2008 and 2020:
- Social Security, Medicare, and Medicaid costs are set to increase by 2.6 percent of GDP, and
- Net interest costs are projected to rise by 2.8 percent of GDP. (See Chart 5.)[15]
This 5.4 percent increase explains nearly the entire increase in the budget deficit by 2020. Even that assumes that Congress will not reverse the modest reductions in the Medicare growth rate that are supposed to partially offset the costs of the new health care law.
If these four costs simply remained at their 2008 percentages of GDP, then the 2020 projections would show revenues at 18.2 percent of GDP, spending at 21.1 percent of GDP, and the deficit at 2.9 percent of GDP—close to the historical averages.[16] The long-term budget deficit problem is an entitlement spending problem.
This can be shown another way. Over the next decade, the annual cost of Social Security, Medicare, Medicaid, and net interest is projected to surge from $1.6 trillion to $3.5 trillion. This nearly $2 trillion budget increase will dwarf the budget increase for defense ($314 billion) as well as the extensions of the 2001 and 2003 tax cuts for those earning more than $250,000 ($98 billion) or less than $250,000 ($306 billion).[17] Thus, the vast majority of deficit expansion will come from Social Security, Medicare, Medicaid, and net interest.
Splitting the Difference or Addressing the Source
Having established that spending is causing the expanding long-term budget deficits, the next question is how to fix that problem. Lawmakers seeking deficit reduction will not find any easy targets. Defenders of each spending program will surely claim some special status that should exempt their program from reforms. Defenders of current tax policies will point out the negative economic consequences of large tax hikes. As the debate proceeds, two competing reform frameworks will likely emerge:
- A “split the difference” approach that closes half the gap with tax increases and half with spending cuts; and
- An “address the source” approach that targets the policies that are actually driving the deficit up.
Most people argue that the “split the difference” approach seems moderate and reasonable. By reforming all tax and spending policies equally, Congress would not single out any one policy. Conservatives and liberals could compromise in a bipartisan show of strength. However, politicians should not take the path of least resistance with a problem of this significance. A solution sustainable over the long term must address the budget deficit at the source. After all, when a family purchases a larger home than it can afford, the proper response is not to obtain second jobs, put the kids to work, and drastically cut back on groceries, electricity, and medical care. The proper response is to address the source of financial distress by moving back to a smaller home.
Similarly, the nation’s rising long-term budget deficits are almost exclusively the result of Washington making entitlement commitments that the nation cannot afford. Therefore, the presumption must be to pare back these commitments to an affordable level. Yet “split the difference” essentially lets most of the entitlement spending growth off the hook and passes a significant burden onto taxpayers and onto federal programs that have succeeded without raising costs. With Social Security, Medicare, and Medicaid costs projected to rise by 10 percent of GDP by 2050,[18] splitting the difference would still require by far the largest tax increase in American history, leaving spending and taxes at levels never seen before during peacetime. It would allow expanding entitlement programs to transform the entire federal budget.
This approach is also unsustainable over the long run. Even if lawmakers broadly raise taxes and reduce spending to balance the budget in the short run, their failure to address the problem at its source means that entitlement costs will likely continue to grow quickly. This would in turn require continuous additional spending cuts and tax hikes elsewhere to keep the budget under control.
Finally, splitting the difference sends the wrong message to future lawmakers by rewarding policies that aggressively increase the short-term budget deficit. Liberal lawmakers could enact large new spending bills without paying for them, believing that much of the future deficit reduction will be split across tax hikes and other spending programs, effectively locking in much of the targeted spending increase—the “feed the beast” strategy. Conservative lawmakers could deeply cut taxes without paying for them on the assumption that half of the resulting deficits will eventually be closed by spending cuts—the “starve the beast” strategy. In either case, the “split the difference” approach to deficit reduction would sacrifice other budget priorities to make room for the new, unaffordable policy.
Can Washington Return to the 2001 Balanced Budget Levels?
Many lawmakers and commentators have stated that the budget was balanced as recently as 2001 and have asked why it cannot be brought back into balance at those levels. Of course, lawmakers are free to alter any policy to achieve such a budget, although significantly reducing net interest costs would require major deficit reduction.
Virtually all deficit reduction in the 1990s originated from just three sources:
- Higher revenues, mostly from a temporary stock and economic bubble.
- Lower defense spending following the end of the Cold War, and
- Net interest savings resulting from less borrowing, a result of the other two factors.
The rest of the federal budget merely remained level as a share of the GDP throughout the decade, which itself may be considered an accomplishment for lawmakers.
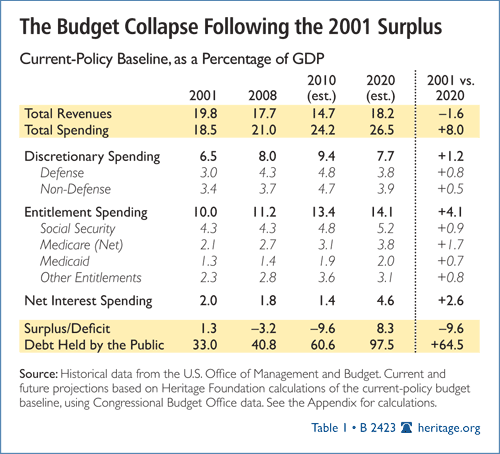
Returning to those budget levels would not be easy. The stock market bubble is unlikely to return, nor would that be desirable. The 9/11 attacks ended the era of massive defense spending cuts, higher debt has brought higher net interest costs, and 10,000 baby boomers per day are retiring into Social Security and Medicare. Overall, the difference between 2001 and 2020 can be explained as follows:
- The 2001 tax revenues were bubble-inflated (down 1.6 percent of GDP),
- 2001 defense spending was as at prewar levels (up 0.8 percent of GDP),
- Social Security, Medicare, and Medicaid costs are growing (up 3.3 percent of GDP),
- Presidents Bush and Obama hiked domestic discretionary spending (up 0.5 percent of GDP),
- Other entitlement spending is rising (up 0.8 percent of GDP), and
- Rising debt means rising net interest costs (up 2.6 percent of GDP).1.
As a result, a budget surplus of 1.3 percent of GDP in 2001 is set to become a deficit of 8.3 percent by 2020. (See Table 1.)
1.Historical data from Office of Management and Budget, Historical Tables, Budget of the United States Government, Fiscal Year 2011 (Washington, D.C.: U.S. Government Printing Office, 2010), pp. 24–25, Table 1.2, and p. 146, Table 8.4, at http://www.whitehouse.gov/omb/budget/fy2011/assets/hist.pdf (June 14, 2010). Current and future projections based on Heritage Foundation calculations of the current-policy budget baseline, using Congressional Budget Office data. See the Appendix for the calculations.
What the Deficit Commission Should Do
President Obama’s Commission on Fiscal Responsibility and Reform, known popularly as the “Deficit Commission,” has begun assembling recommendations to reduce the budget deficit to 3 percent of gross domestic product by 2015 and to address long-term deficits.
The commission should target the historical levels of taxes (18.0 percent of GDP) and spending (20.3 percent of GDP). Thus, successful reforms would:
- Reform Medicaid and bring long-term sustainability to Social Security and Medicare. It may be possible to squeeze enough savings from other sources to meet the 2015 deficit target, but the swelling cost of these three programs would quickly devour those savings and continue expanding the budget deficit. Thus, the commission should look beyond 2015 and seek entitlement reforms that bring long-term sustainability to the federal budget.[19]
- Reopen the health care law. While most of the current and future entitlement growth comes from Social Security, Medicare, and Medicaid, some of it comes from Obamacare. In fact, much of the law merely shifted spending from Medicare to new health subsidies. Even in the unlikely event that all of the scheduled Medicare cuts actually take place and new health subsidies are not expanded, the CBO estimates that Obamacare would expand federal spending by $382 billion through 2019 and substantially more thereafter.[20] The necessary bipartisan budget reform must include bipartisan health care reform.
- Offer specific spending reforms, not just numerical targets. In 1982 and 1990, bipartisan budget deals coupled immediate tax increases with vague promises of distant spending cuts to meet preset targets. Predictably, the spending cuts were rarely implemented. Long-term spending targets and caps are an important part of budget reform, but they are hollow if not accompanied by specific, credible proposals to reform federal spending programs. Rather than punt the tough spending decisions, the commission should make specific proposals in its report to Congress and the President.
- Avoid tax increases. Low tax revenues are not the problem. Even if the 2001 and 2003 tax cuts are extended, revenues are still projected to rise above the historical average. Furthermore, America simply cannot tax its way out of this problem. Financing the projected 10 percent of GDP long-term cost increase for Social Security, Medicare, and Medicaid would require permanently raising taxes by $12,000 per household (adjusted for both inflation and income growth).[21] Such steep tax rate increases would devastate families, businesses, and the economy.
Even the “split the difference” policy of equal tax hikes and spending cuts would eventually push taxes up to near-European levels. Congress is already examining a European-style value-added tax (VAT)—a type of national sales tax— that would allow Congress to keep spending, rather than confront the unsustainable spending trends. Drowning the next generation of Americans in tax hikes is no better than drowning them in debt. Rather than simply raising taxes alongside rising spending, the deficit commission should recommend paring back the burgeoning spending programs. - Bring budget transparency. Social Security and Medicare face a staggering $46 trillion in unfunded obligations over the next 75 years. Yet these figures do not appear anywhere in the budget that Congress must approve annually. The commission should strongly recommend that Congress disclose all unfunded obligations in its annual budget and vote to acknowledge and approve the long-term consequences of their budget decisions. In addition, they should require that new proposals be scored over the long term, not just over the next 10 years, and create a long-term budget for entitlement programs.
Conclusion
Growing long-term budget deficits are exclusively the result of rising spending, not declining revenues. Thus, common sense suggests that most reforms should occur on the spending side. Given the magnitude of the long-term spending increase, even splitting the difference between spending cuts and tax increases would leave the highest sustained spending—and tax burden—in American history. Permanently transforming the federal government in this manner would slow economic growth and harm families and businesses.
Rapid growth in Social Security, Medicare, and Medicaid costs and interest payments on the national debt will cause virtually all of this new spending. The annual cost of these four expenditures will surge from $1.6 trillion this year to $3.5 trillion in 2020. This will cause massive budget deficits in the next decade and must be the focus of any serious effort to reduce the budget deficit.
—Brian M. Riedl is Grover M. Hermann Research Fellow in Federal Budgetary Affairs in the Thomas A. Roe Institute for Economic Policy Studies at The Heritage Foundation.
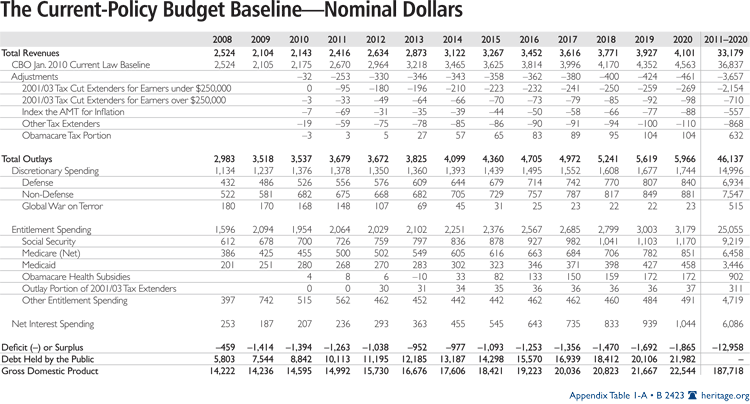
Appendix
Methodology
The purpose of this study was to create a budget baseline reflecting an extension of current tax and spending policies. The budget baseline is presented in Appendix Table 1.
Revenues
Revenue calculations begin with the January 2010 CBO current-law baseline and incorporate extensions of:
- The 2001 and 2003 tax cuts,
- The AMT patch, and
- Other expiring tax cuts that are typically extended annually, all using January 2010 and March 2010 CBO data.
The calculations also incorporate the CBO estimate of revenues from the new health care law through 2019, with the 2020 figure estimated.
Discretionary Spending
Discretionary spending figures are from the CBO’s January 2010 alternative scenario, which assumes that regular discretionary appropriations grow with the nominal GDP and that Iraq and Afghanistan spending remains on the “fast drawdown” scenario.
Entitlement Spending
Entitlement spending figures are the CBO’s January current-law baseline, adjusted to reflect:
- The annual Medicare physician payment fix,
- The outlay effects of 2001 and 2003 tax cut extenders, and
- The new health care law.
Medicare spending is net of offsetting receipts.
Net Interest Spending
Net interest spending figures are from January 2010 CBO current-law baseline, adjusted to include the CBO estimate of the interest costs of all of the above adjustments.
Historical Averages
Historical tax and spending averages are the averages for 1960 through 2009.