
The 2010 edition of “Federal Spending by the Numbers” shows spending and deficits continuing to grow at a pace not seen since World War II. Washington will spend $30,543 per household in 2010—$5,000 per household more than just two years ago. While some of this spending is a temporary result of the recession, President Obama’s latest budget would replace this temporary spending with permanent new programs. Consequently, by 2020—a time of assumed peace and prosperity—Washington would still spend nearly $36,000 per household, compared to $25,000 per household before this recession (adjusted for inflation).
Since 2000, spending has grown across the board. Entitlement spending has reached a record 14 percent of GDP. Discretionary spending has expanded 79 percent faster than inflation as a result of large defense and domestic spending hikes. Other spending categories that have grown rapidly since 2000 include: anti-poverty programs (89 percent faster than inflation), K–12 education (219 percent), veterans spending (107 percent), and Medicare (81 percent). And despite all the pressing national priorities, lawmakers approved over 9,000 earmarks last year at a cost of $16.5 billion. Simply put, all parts of government are growing.
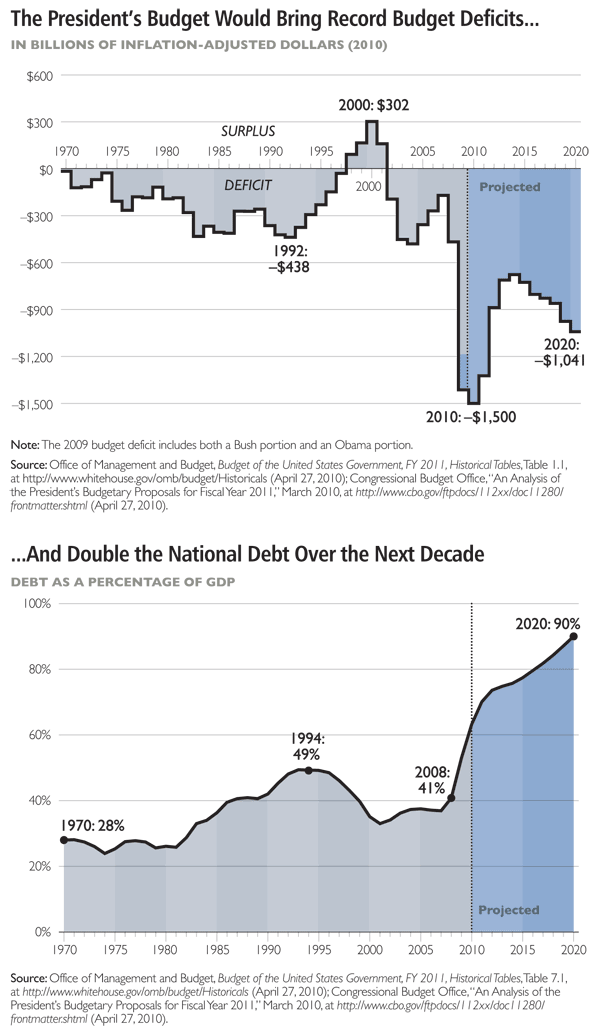
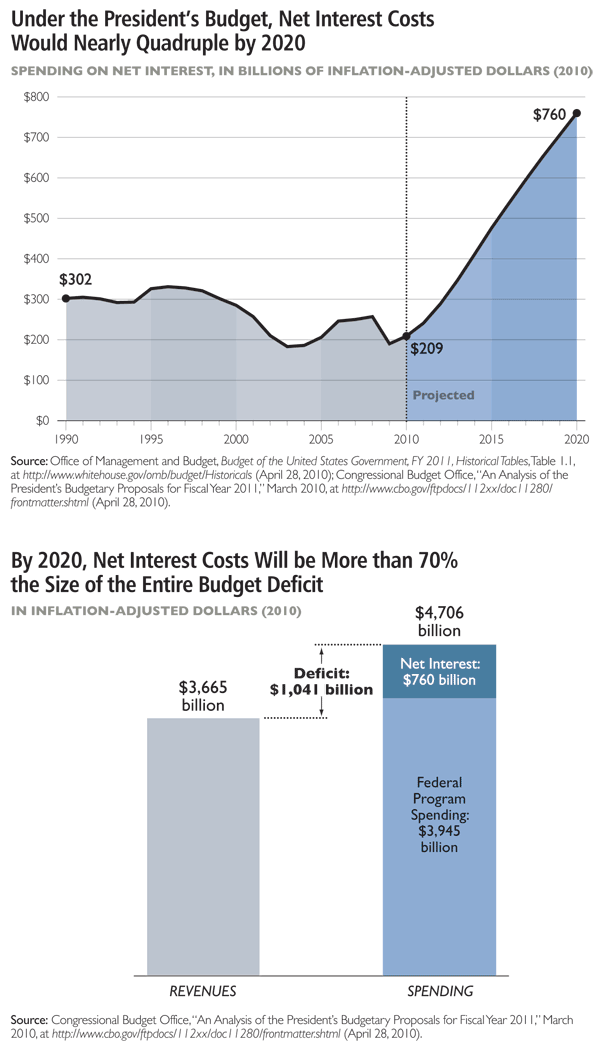
Consequently, Washington’s 2009 budget deficit is estimated at $1.5 trillion ($12,664 per household). While deficits naturally rise during recessions, one would expect them to eventually return back to the $100 billion to $400 billion range that prevailed before the recession. However, the President’s budget shows annual budget deficits averaging just under $1 trillion for the next decade—a level of borrowing that would cause the national debt to double. These deficits would not only raise interest rates, they would also nearly quadruple the net interest costs of the national debt over the next decade.
Of course, not all future spending is inevitable. In the 1980s and 1990s, Washington consistently spent $21,000 per household (adjusted for inflation). Simply returning to that level would balance the budget by 2012 without any tax hikes. Alternatively, returning to the $25,000 per household level (adjusted for inflation) that Washington spent before the current recession would likely balance the budget by 2019 without any tax hikes.
This year’s edition updates all spending figures. It includes a new page showing that 90 percent of the rising long-term budget deficits are driven by rising spending, and just 10 percent of the rising deficits are caused by falling revenues. An additional graph shows the changing composition of federal spending since 1962, as entitlements have crowded out defense.
Overall Budget Trends
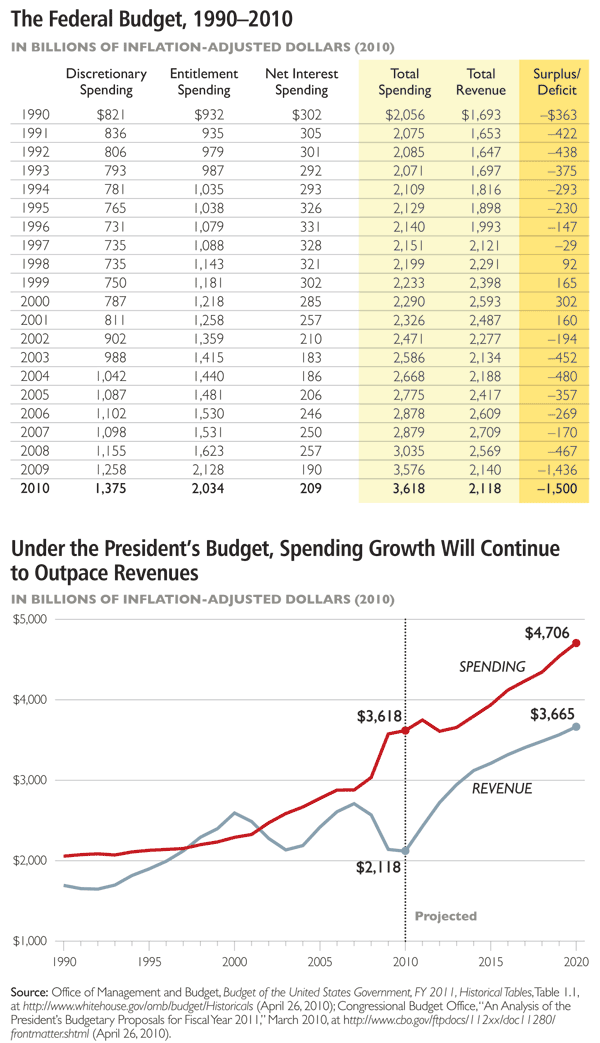
- Under President Obama’s budget, Washington is projected to spend $3,618 billion, raise $2,118 billion, and run a $1,500 billion deficit in 2010.
- Tax revenues strongly correlate with economic growth. The recession is chiefly responsible for collapsing revenues.
- Spending has increased 19 percent faster than inflation since 2008.
- The projected $1,500 billion budget deficit represents a post–World War II record 10.3 percent of GDP. More than 41 cents of every dollar Washington spends in 2010 will be borrowed.
Overall Spending Trends
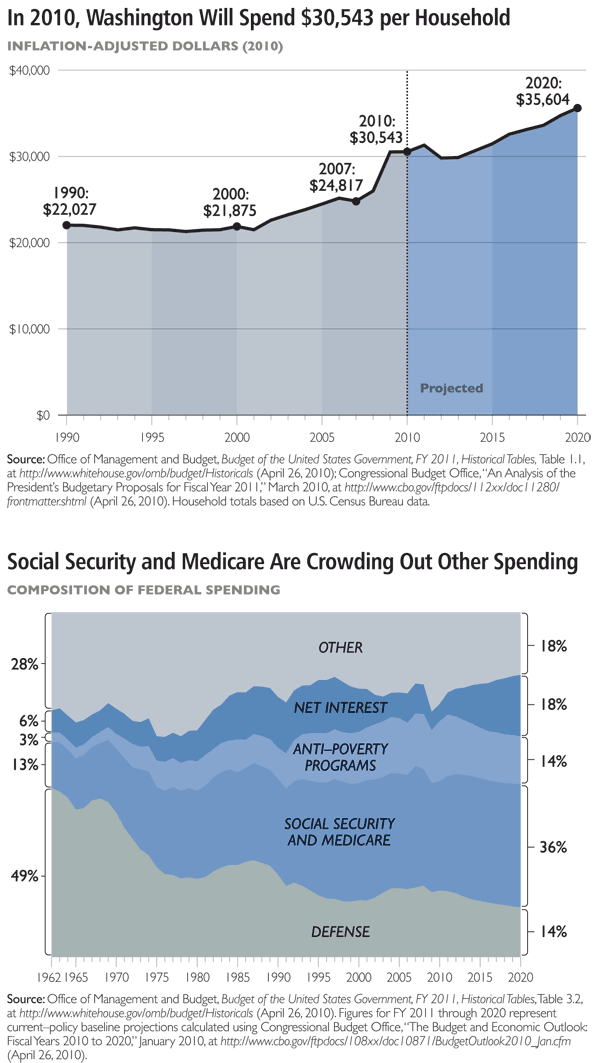
- From 2000 to 2010, real federal spending will have increased from $21,875 per household to $30,543 per household.
- In 2010, the federal government will spend $30,543 per household, collect taxes of $17,879 per household, and run a budget deficit of $12,664 per household.
- Under President Obama’s budget, deficits from 2010 through 2020 would total $82,219 per household.
- Surging Social Security, Medicare, and net interest costs are set to crowd out spending on other programs.
-
Where Is All the Money Going?
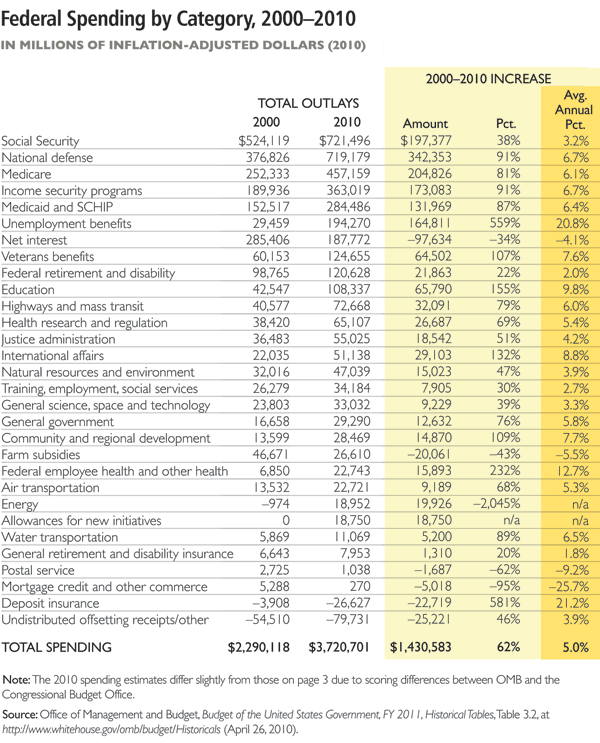
- Federal spending has grown 62 percent faster than inflation since 2000.
- Defense spending has grown 91 percent over its pre-9/11 trough, yet still remains well below the historical average as a percentage of the economy.
- The expensive Medicare drug benefit played a large role in Medicare’s sharp cost increase.
- Anti-poverty spending rose rapidly under President George W. Bush, and has risen again during the recession.
- Unemployment spending is also up due to the recession.
- Energy costs fluctuate yearly, so the rapid growth rate over 2000 is not indicative of a long-term trend.
- Mortgage credit and deposit insurance costs were high in 2009 due to the financial and mortgage bailouts. The low (and occasionally negative) 2010 totals result from recipients repaying a portion of that spending.
- Despite the new spending and deficits, record-low interest rates caused net interest costs to decline. Net interest spending will jump when interest rates rise back to normal levels.
Discretionary Spending
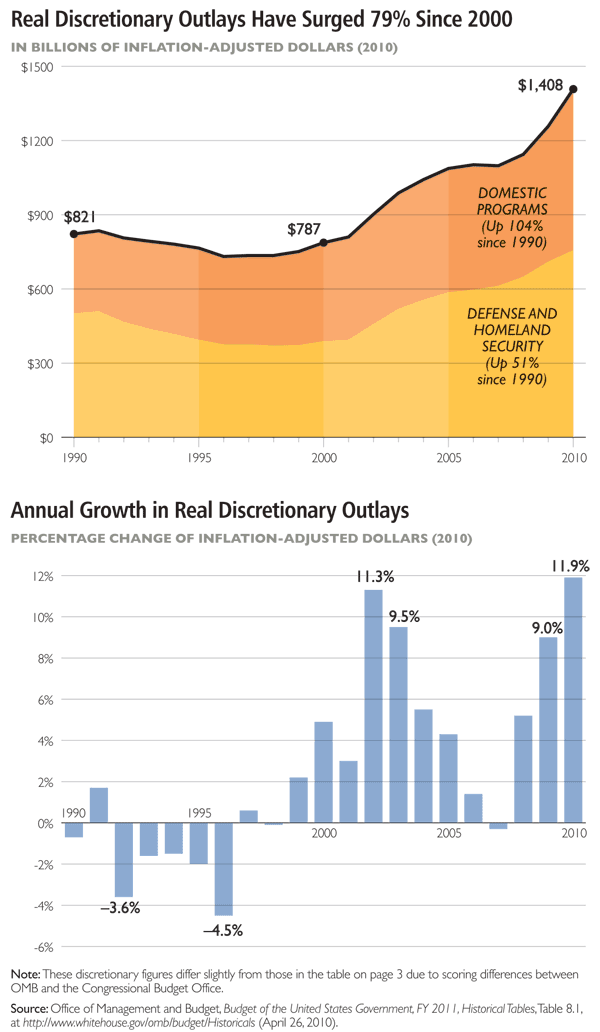
- Discretionary spending is the portion of the annual budget that Congress actually determines.
- Since 2000, discretionary outlays surged 79 percent faster than inflation, to $1,408 billion. The “stimulus” is responsible for $111 billion of 2010 discretionary spending.
- Between 1990 and 2000, $80 billion annually in new domestic spending was more than fully offset by a $100 billion cut in annual defense and homeland security spending, leaving (inflation-adjusted) discretionary spending slightly lower.
- Since 2000, all types of discretionary spending have grown rapidly.
- Overall, since 1990, domestic discretionary spending has risen 104 percent faster than inflation and defense/security discretionary spending has risen 51 percent.
Entitlement Spending
- Entitlement spending is on autopilot, with annual spending determined by benefit formulas and caseloads.
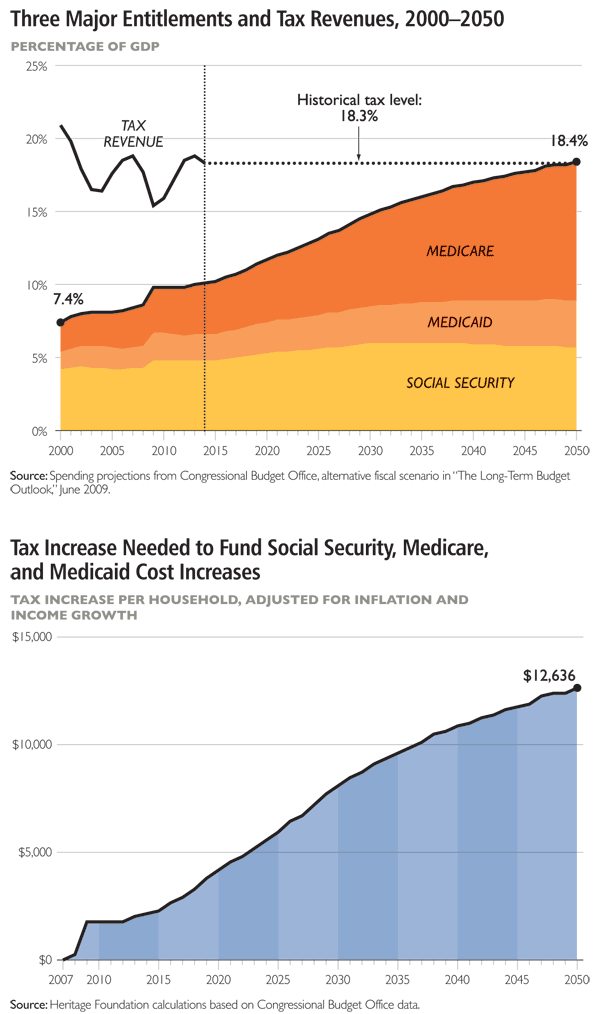
- Entitlements (excluding net interest) account for 56 percent of all federal spending and 14 percent of GDP—up from 10 percent of GDP three years ago.
- The three largest entitlements are Social Security, Medicare, and Medicaid. Their total cost is projected to leap from 8.4 percent of GDP in 2007 to 18.4 percent by 2050.
- Unless those three programs are reformed, policymakers will eventually have to choose from among:
- $12,636 per household by 2050, and further thereafter;
- Eliminating every federal program except Social Security, Medicare, and Medicaid; or
- Increasing the national debt to unprecedented levels that could cause an economic collapse.
Anti-Poverty Spending Is Surging
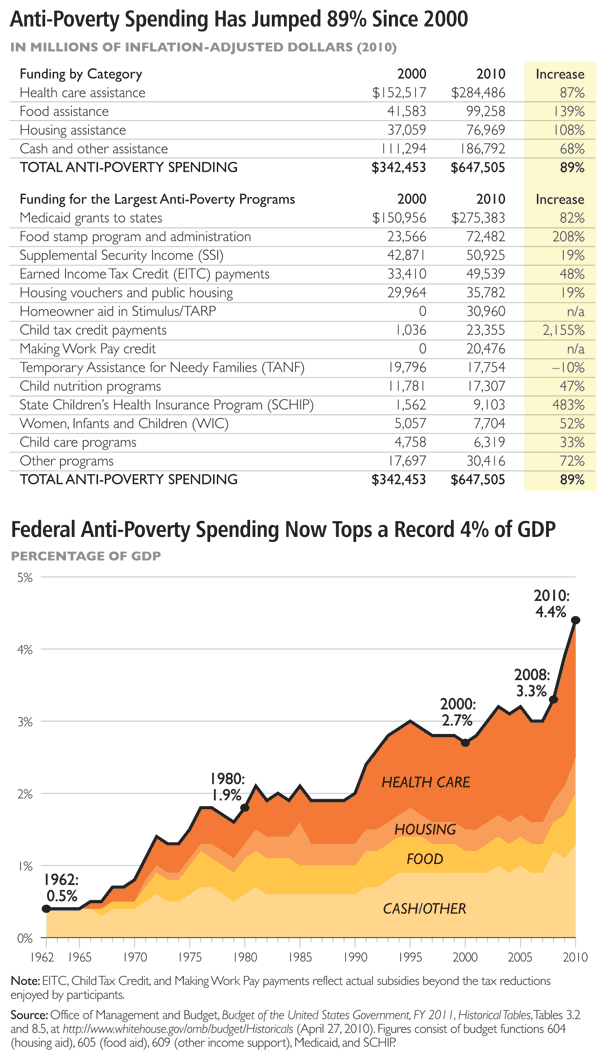
- Anti-poverty spending has surged 89 percent faster than inflation since 2000. Nearly half of this increase occurred in the past two years. President Bush became the first President to spend 3 percent of GDP on anti-poverty programs, and President Obama has already pushed it above 4 percent of GDP. State and local governments spend an additional 2 percent of GDP on these programs.
- Since 2000, Medicaid and Food Stamp rolls have expanded by nearly 20 million. Average benefit levels have grown faster than the inflation rate.
- Program success should be measured by reduced government dependency, not increased spending.
Popular Programs Are Growing Rapidly
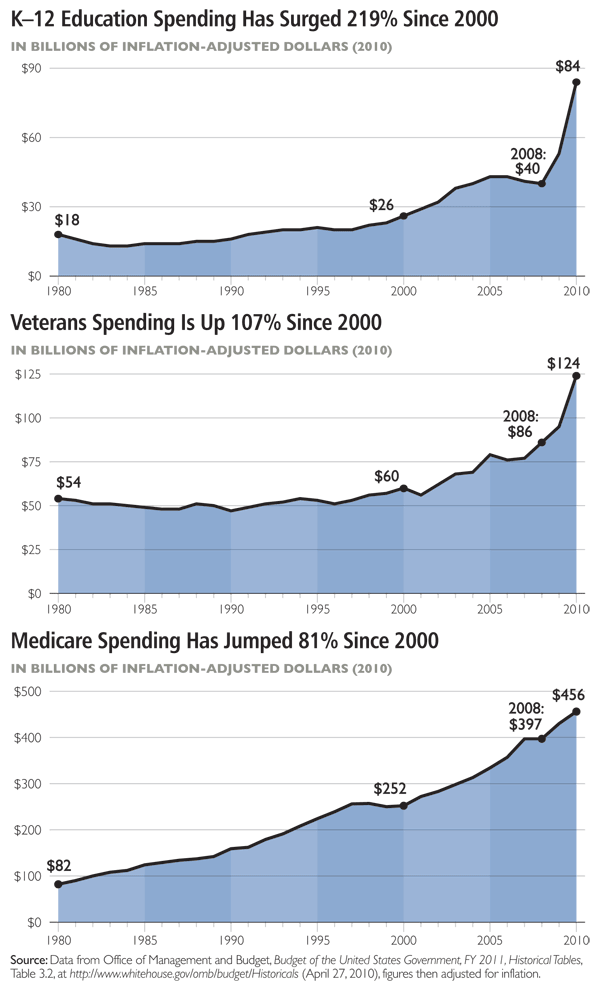
- Lawmakers have had difficulty setting budget priorities in recent years. In addition to funding two wars and the largest anti-poverty budgets in American history, they have increased spending on popular programs like education, veterans benefits, and Medicare at unsustainable rates.
Earmarks
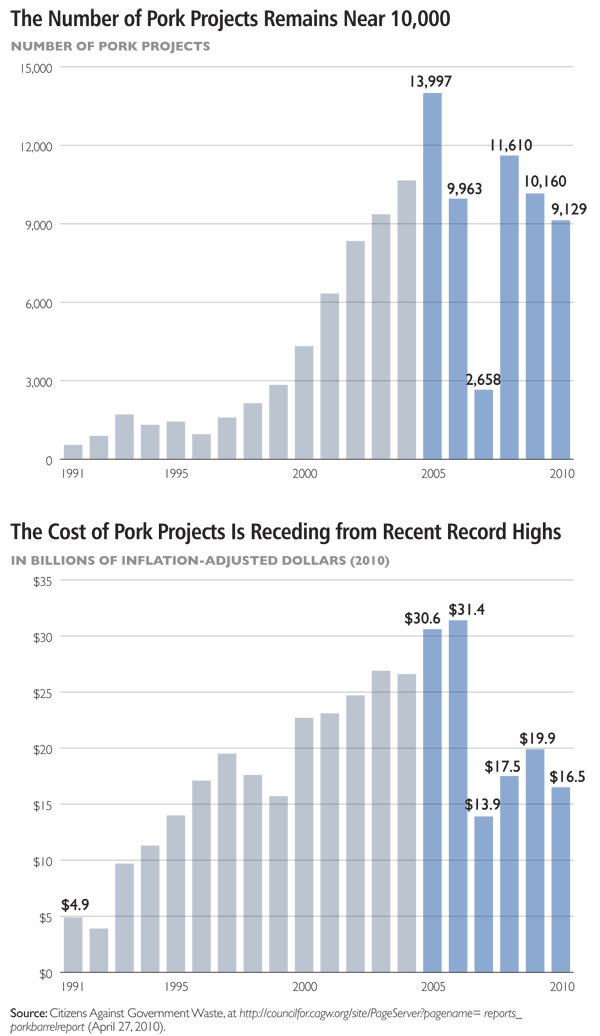
- Earmarks distribute government grants by political favoritism rather than merit. Rather than allow agencies to distribute grants based on merit, or let state and local governments decide how to distribute federal grant dollars within their own communities, lawmakers earmark government grants to recipients of their choosing.
- Consequently, the distribution of government grants now typically depends on politics, campaign contributions, and the committee assignments of local lawmakers.
- President Obama pledged to reduce earmark spending down to the 1994 level of $7.8 billion (in nominal dollars). Instead, he signed $16.5 billion of appropriations earmarks into law last year.
- House Republicans have announced a one-year moratorium on all earmarks. House Democrats have announced a one-year moratorium on earmarks to for-profit companies. The Senate continues to earmark as usual.
- In addition to regular annual appropriations earmarks, the 2005 highway authorization bill contained approximately 6,371 earmarks worth $25 billion in total.
The Consequence of Runaway Spending: Budget Deficits
- From 1989 through 2008, annual budget deficits averaged $210 billion (adjusted for inflation).
- President Bush handed President Obama a $1.2 trillion deficit for 2009. Obama added more than $200 billion to it.
- President Bush’s budget deficits averaged $447 billion. President Obama’s budget shows average deficits of $851 billion over the eight years he would serve if he wins a second term.
- President Obama’s budget would double the publicly held national debt by 2020.
Net Interest Spending
- Despite increased borrowing, record-low interest rates have kept net interest costs down.
- Under the President’s budget, the combination of rising interest rates and a doubling of the national debt would nearly quadruple inflation-adjusted net interest costs over the next decade.
- By 2020, net interest costs would account for a record 16.1 percent of the federal budget and 4.1 percent of GDP. Net interests costs would be nearly three-quarters the size of the entire $1,041 billion deficit.
Spending and the Budget Deficit
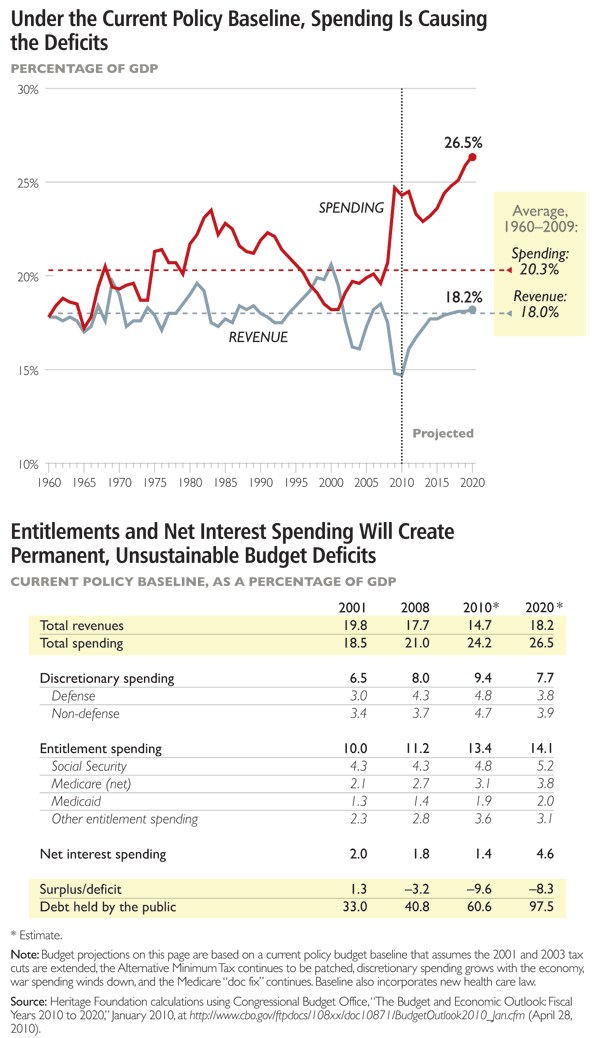
- Rising spending—not low revenues—is driving the long-term budget deficits. By 2020, spending is projected to be 6.2 percent of GDP above the historical average, while projected 2020 revenues are 0.2 percent of GDP above the historical average. Thus, the entire expanded budget deficit will be caused by rising spending, rather than by falling revenues—even if the 2001 and 2003 tax cuts are extended.
- Between 2008 and 2020, the cost of Social Security, Medicare, Medicaid, and net interest is projected to rise from 10.2 percent of GDP to 15.6 percent of GDP—making them responsible for nearly the entire rising budget deficit.
Nowhere to Cut?
- Immediately before the current recession, Washington spent $24,800 per household. Simply returning to that level (adjusted for inflation) would likely balance the budget by 2019 without any tax hikes.
- The federal government made at least $98 billion in improper payments in 2009.
- Washington spends $92 billion on corporate welfare (excluding TARP) versus $71 billion on homeland security.
- Washington spends $25 billion annually maintaining unused or vacant federal properties.
- Government auditors spent the past five years examining all federal programs and found that 22 percent of them—costing taxpayers a total of $123 billion annually—fail to show any positive impact on the populations they serve.
- The Congressional Budget Office published a “Budget Options” series identifying more than $100 billion in potential spending cuts.
- Because of overstaffing, the U.S. Postal Service selects 1,125 employees per day to sit in empty rooms. They are not allowed to work, read, play cards, watch television, or do anything. This costs $50 million annually.
- Washington will spend $2.6 million training Chinese prostitutes to drink more responsibly on the job.
- Stimulus dollars have been spent on mascot costumes, electric golf carts, and a university study examining how much alcohol college freshmen women require before agreeing to casual sex.
- Examples from multiple Government Accountability Office (GAO) reports of wasteful duplication include 342 economic development programs; 130 programs serving the disabled; 130 programs serving at-risk youth; 90 early childhood development programs; 75 programs funding international education, cultural, and training exchange activities; and 72 safe water programs.
- A GAO audit classified nearly half of all purchases on government credit cards as improper, fraudulent, or embezzled. Examples include gambling, mortgage payments, liquor, lingerie, iPods, Xboxes, jewelry, Internet dating services, and Hawaiian vacations. In one extraordinary example, the Postal Service spent $13,500 on one dinner at a Ruth’s Chris Steakhouse, including “over 200 appetizers and over $3,000 of alcohol, including more than 40 bottles of wine costing more than $50 each and brand-name liquor such as Courvoisier, Belvedere and Johnny Walker Gold.” The 81 guests consumed an average of $167 worth of food and drink apiece.
- Improper or fraudulent Medicare spending now totals $47 billion annually—12.4 percent of its budget.
- New York distributed $140 million in stimulus money into the individual accounts of families on welfare, yet neglected to mention it was intended for school supplies. Local ATMs were depleted, and much of the money was reportedly spent on “flat screen TV’s, iPods and video gaming systems” as well as “cigarettes and beer.”
- Washington will spend $615,175 on an archive honoring the Grateful Dead.
- Federal employees owe more than $3 billion in income taxes they failed to pay in 2008.
- Each month, taxpayers provide $40,000 worth of office space, cell phones, staff, and an SUV for former House Speaker Dennis Hastert, who currently works as a lobbyist for private corporations and foreign governments.
- House Speaker Nancy Pelosi and her staff have charged taxpayers $101,000 for “in-flight services”—including food and liquor—during trips on Air Force jets over the last two years. Charges reportedly include “Maker’s Mark whiskey, Courvoisier cognac, Johnny Walker Red scotch, Grey Goose vodka, E&J brandy, Bailey’s Irish Crème, Bacardi Light rum, Jim Beam whiskey, Beefeater gin, Dewars scotch, Bombay Sapphire gin, Jack Daniels whiskey, and Corona beer.”
- The Legal Services Corporation, which is supposed to provide legal services to the poor, has repeatedly ignored warnings to stop spending its money on alcohol. It also funds limousines, first-class airfare, and “death by Chocolate” pastries for its executives.
- The Department of Energy spent nine years and $153 million on an obsolete cyber-security project that was supposed to safeguard America’s nuclear weapons information.
- The stimulus set aside $350 million for a national broadband coverage map—even though one private firm stated it could create one for $3.5 million.
- Fannie Mae—now backed up by taxpayers—paid $6.3 million in legal defense costs for ousted executives such as Franklin Raines. An additional $16.8 million was spent defending Fannie Mae’s regulators in litigation against the former executives.
- The Census Bureau spent $2.5 million on Super Bowl ads, and on-air mentions by sportscasters.
- New documents reveal that the Department of Homeland Security (DHS) lost 1,000 computers in 2008. Not to be outdone, Homeland Security officers lost nearly 200 guns in places like restaurant restrooms, convenience stores, and bowling alleys. Several of the guns ended up in the hands of criminals.
- The State Department will spend $450,000 on art shows in Venice, Italy.
- During a recent three-day conference, NASA spent $62,611 on “light refreshments” for its 317 attendees—$66 per day per person. NASA officials said such expensive snacks were needed to keep its officials from wandering away from the conference.
- NASA spent $500 million constructing a 355-foot steel tower to launch a rocket that is now unlikely to ever be built.
- The Congressional Research Service has confirmed that the new health care law may subsidize Viagra and other sexual performance drugs for convicted rapists and sex offenders.
- Federal agencies are delinquent on nearly 20 percent of employee travel charge cards, costing taxpayers hundreds of millions of dollars annually.
- The Securities and Exchange Commission spent $3.9 million rearranging desks and offices at its Washington, D.C., headquarters.
- Over half of all farm subsidies go to commercial farms, which report average household incomes of $200,000.
- A GAO audit found that 95 Pentagon weapons systems suffered from a combined $295 billion in cost overruns.
- The refusal of many federal employees to fly coach costs taxpayers $146 million annually in flight upgrades.
- Washington spent $126 million in 2009 on projects associated with the Kennedy family legacy in Massachusetts. Additionally, Senator John Kerry (D–MA) diverted $20 million from the 2010 defense budget to subsidize a new Edward M. Kennedy Institute.
- The federal government owns more than 50,000 vacant homes.
- The Federal Communications Commission spent $350,000 to sponsor NASCAR driver David Gilliland.
- Members of Congress have spent hundreds of thousands of taxpayer dollars supplying their offices with popcorn machines, plasma televisions, DVD equipment, ionic air fresheners, camcorders, and signature machines—plus $24,730 leasing a Lexus, $1,434 on a digital camera, and $84,000 on personalized calendars.
- More than $13 billion in Iraq aid has been classified as wasted or stolen. Another $7.8 billion cannot be accounted for.
- Congress recently gave Alaska Airlines $500,000 to paint a Chinook salmon on a Boeing 737.
- The Transportation Department will subsidize up to $2,000 per flight for direct flights between Washington, D.C., and the small hometown of Congressman Hal Rogers (R–KY)—but only on Monday mornings and Friday evenings, when lawmakers, staff, and lobbyists usually fly. Rogers is a member of the Appropriations Committee, which writes the Transportation Department’s budget.
- Washington has spent $3 billion re-sanding beaches—even as this new sand washes back into the ocean.
- The Defense Department wasted $100 million on unused flight tickets and never bothered to collect refunds even though the tickets were refundable.
- Washington spends $60,000 per hour shooting Air Force One photo-ops in front of national landmarks.
- Congress has ignored efficiency recommendations from the Department of Health and Human Services that would save $9 billion annually.
- Taxpayers are funding paintings of high-ranking government officials at a cost of up to $50,000 apiece.
- The state of Washington sent $1 food stamp checks to 250,000 households in order to raise state caseload figures and trigger $43 million in additional federal funds.
- Suburban families are receiving large farm subsidies for the grass in their backyards—subsidies that many of these families never requested and do not want.
- Homeland Security employee purchases include 63-inch plasma TVs, iPods, and $230 for a beer brewing kit.
- The National Institutes of Health spends $1.3 million per month to rent a lab that it cannot use.
- Congress recently spent $2.4 billion on 10 new jets that the Pentagon insists it does not need and will not use.
- Lawmakers diverted $13 million from Hurricane Katrina relief spending to build a museum celebrating the Army Corps of Engineers—the agency partially responsible for the failed levees that flooded New Orleans.
- Medicare officials recently mailed $50 million in erroneous refunds to 230,000 Medicare recipients.
- Audits showed $34 billion worth of Department of Homeland Security contracts contained significant waste, fraud, and abuse.
- The Advanced Technology Program spends $150 million annually subsidizing private businesses; 40 percent of this funding goes to Fortune 500 companies.
- The Conservation Reserve program pays farmers $2 billion annually not to farm their land.
Sources: On file at The Heritage Foundation.
Brian M. Riedl is Grover M. Hermann Research Fellow in Federal Budgetary Affairs in the Thomas A. Roe Institute for Economic Policy Studies at The Heritage Foundation.


