The 1960s War on poverty was intended to eliminate child poverty nationwide through a variety of income transfers and human development programs. However, during the first three decades of the War on poverty, there was little net decline in the child poverty rate. In 1965 (the year when the first War on poverty programs were initiated), the child poverty rate was 20.7 percent.[1] Thirty years later, in 1996 (the last year before the implementation of welfare reform), the child poverty rate was only slightly lower at 19.8 percent.[2]
The lack of progress in reducing child poverty since 1965 can be explained in part by the erosion of marriage and the growth of poverty-prone single-parent families. Two sets of facts make this point clear:
- The poverty rate for all children in married-couple families is 8.2 percent. By contrast, the poverty rate for all children in single-parent families is four times higher at 35.2 percent.[3]
- The number of single-parent families has grown considerably since the onset of the War on Poverty. In 1960, less than 12 percent of children lived in single-parent families. By 2000, that figure had more than doubled, rising to 27.6 percent.
This CDA Report answers the question: What share of the current level of child poverty in the United States can be attributed to the growth of single parenthood since the 1960s? Or, phrased in a slightly different way: What would the child poverty rate be today if single-parent families had remained at the levels that existed before the beginning of the War on poverty?
To answer the question, the authors attempted to simulate the effects of higher marriage rates using data from the U.S. Bureau of the Census for the year 2000. To accomplish this, a portion of single parents were matched with potential spouses of the opposite sex who were identical in age, race, and level of education. Once the couples had been paired, we hypothetically joined or "married" these couples into one household. We then determined whether the newly joined household would be poor based on the couple's combined income.
The Effect of the Decline of Marriage.
As this Report shows, this analysis found that the decline of marriage since the 1960s has been a substantial factor behind the current high levels of child poverty. Specifically, if marriage were restored to 1960s levels:
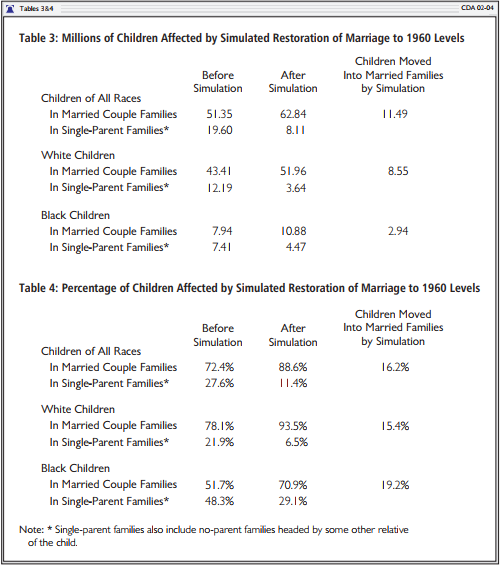
- The number of children living in single-parent homes would be cut by nearly 60 percent. The number of children living in married couple families would increase by almost 11.5 million, and the number residing in single-parent homes would be reduced by a corresponding amount. These 11.5 million children represent 16.2 percent of all children.
- Among the 11.5 million added children residing in married-couple homes in this scenario, the poverty rate would fall by 80.4 percent. Some 34.2 percent of these children are now poor and live in single-parent homes. If their parents were married to spouses with matching demographic characteristics, only 6.7 percent of these children would remain poor.
- Overall, restoring marriage to 1960 levels would remove more than 3 million children from poverty nationwide. The U.S. child poverty rate would fall by nearly a third, from 15.7 percent to 11.2 percent.
The decline in marriage since the inception of the War on poverty in the 1960s has clearly contributed to child poverty. Overall, our analysis shows that child poverty would be nearly a third lower today if the traditional two-parent family had not deteriorated over the past three decades.
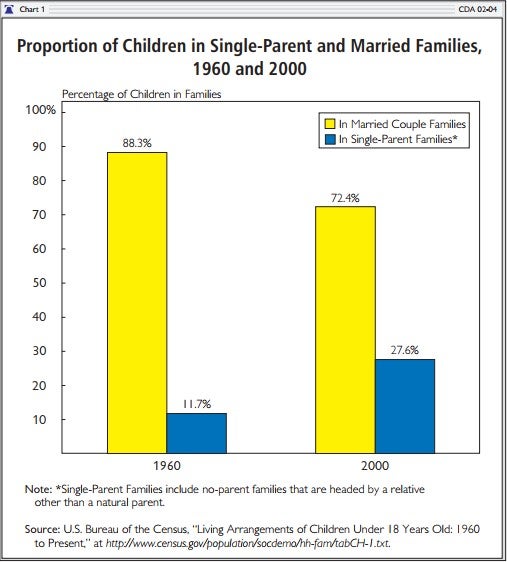
Before the War on poverty began in the mid-1960s, traditional husband-wife families comprised the vast majority of families with children. Indeed, over 88 percent of all children resided in a married-couple family, according to data from the 1960 decennial Census of Population and Housing.[4] By 2000, this demographic statistic had changed significantly: Around 72 percent of all children lived in married-couple families. In four decades, American family structure changed, and more than a tenth of all children shifted from two-parent to single-parent families.
Research shows that children born or raised in single-parent families[5] are more at risk for a wide range of social maladies, including poverty, welfare dependency, academic failure (or sub-par academic achievement), and crime.[6] marriage might be seen as a kind of social inoculant that helps protect children from these social ills, although it does not absolutely guarantee protection.
The most publicized of these social maladies is poverty. Moving from a single-parent to a married family is a straightforward way to rise above the poverty threshold. Only one additional family member is added, but the total family income might double or more, depending on the level of work participation exhibited by the husband and wife. This is the premise on which this research is based. Specifically, if single parents with children were "married" to similar single persons of the opposite gender, what would happen to the poverty rate of children nationwide?
The database used for this analysis is the Census Bureau's Current Population Survey (CPS), a monthly survey representative of all households nationwide. Well over 60,000 households are surveyed each year for the CPS. The March 2001 supplement, also known as the annual demographic file, includes extensive questions on family demographic characteristics and previous year income that make it useful for social analyses, such as this one.[7]
To determine the economic effects on poverty levels if marriage were restored to 1960 levels, we paired 7.6 million single parents with similar non-married persons within the CPS to form 7.6 million new simulated "marriages." In creating these simulated marriages, we attempted to mimic socially realistic marriage patterns. Single mothers were paired with non-married men who were identical in race, age, and level of education.[8] Similarly, single fathers were paired with non-married women who were identical in race, age, and level of education. This way, the single parent would be "married" to someone within his or her own social demographics. For example, a young single mother with a low level of education was matched to a similar young male who also had low educational attainment. (For additional detail on the matching/marrying procedure, see the Technical Appendix.)
When a simulated married family is created, a new total family income variable is also created by combining the original incomes of the two "partners." Any cash welfare assistance is subtracted from the total money income of the newly created family, since most individuals lose their cash welfare/Temporary Assistance to Needy Families (TANF) assistance benefits when they marry
The analysis next takes into account the very large differences in earnings between married and non-married men. Analysis of the CPS data reveals that married men, on average, earn 40 percent more than non-married men who are similar in race, age, and education. The higher earnings of married men are attributable to two factors: a selection effect and earnings inducement.[9] Selection effect refers to the fact that women tend to marry men who are similar in race, age, and education; but within these boundaries, there is a greater tendency for women to marry men with higher earnings potential. Earnings inducement refers to the obvious fact that married men who have families to support tend to have greater commitment to the labor force and careers than do similar non-married men; consequently, the earnings of married men are generally higher.
To compensate for both the selection effect and the earnings inducement, we have modestly increased the wages of husbands in the simulated married households. To make this adjustment, we first calculated the difference in earnings in the CPS between married and non-married men, holding constant race, age, and education. We then raised the earnings of husbands in the simulated married families by half of this difference in married and non-married wages. As a result of the adjustment, the average increase in earnings of men in simulated marriages was 20 percent. It is important to note that even after this adjustment, the earnings of husbands in simulated marriages remained below those of actual married men who are identical in race, age, and education. Our methods of adjusting male wages due to marriage closely follow those of Dr. Robert Lerman of the Urban Institute in his influential article on marriage and poverty.[10] However, our wage adjustment is more modest than the one used by Dr. Lerman.
Measuring Poverty.
After simulating a higher level of marriage in society, we calculated the effect of increased marriage on child poverty. The Census Bureau measures poverty by comparing a family's income to specific poverty income thresholds. If a family's total income is less than the official poverty threshold for a family of that size, the family is considered poor. In 2000, the poverty income threshold for a family of four was $17,463.[11]
The apparent poverty rate varies greatly depending on which resources are counted as part of a family's income. The most common census poverty figures are based on a family's "money income." Money income includes income from wages and salaries, interest, dividends, unemployment and workers compensation, Social Security, cash welfare, such as TANF benefits and Supplemental Security Income (SSI), veterans' and survivors' benefits, disability payments, pensions, rents/royalties, educational assistance, alimony, and child support. Critically, money income excludes many forms of welfare, such as the Earned Income Tax Credit (EITC), food stamps, public housing, and Medicaid benefits
Our analysis first determined the impact of altering marriage levels on child poverty using the money income measure of income. We then redid the analysis using a broader definition of income that includes the EITC and the value of food stamps.
Effects of Restoring marriage to 1960 Levels (by Cash Money Income Measure)
As Chart 1 shows, the proportion of children in single-parent families rose substantially from 1960 to 2000. In 1960, only 11.7 percent of children were in single-parent or other "broken" home settings, a percentage that ballooned to 27.6 percent by the year 2000.
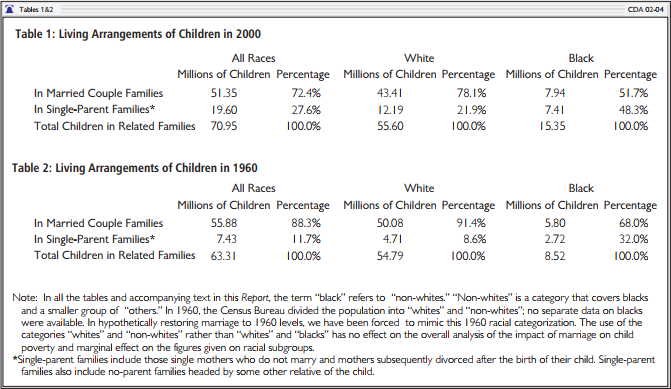
As Table 1 and Table 2 show, if marriage were restored to 1960 levels, the percentage of children residing in married-couple families would rise from 72.4 percent to 88.3 percent. A total of 11.49 million children would reside in married-couple families rather than single-parent homes. (See Table 3 and Table 4.) Among black children, the share residing in married homes would rise from 51 percent to 71 percent; nearly 3 million additional black children would reside in married-couple homes.[12]
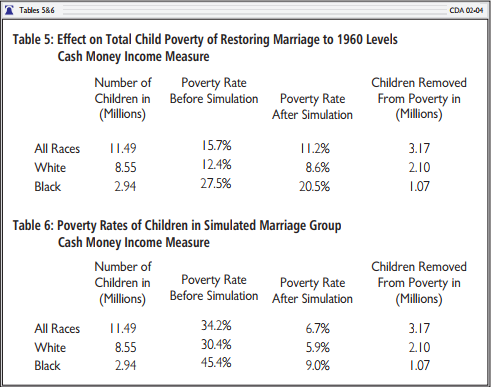
Table 5 shows that restoring marriage to 1960 levels would have a considerable impact on child poverty. Using the money income definition of income, the child poverty rate is now at 15.7 percent. However, if marriage were restored to 1960 levels, the total child poverty rate would be cut by nearly a third to 11.2 percent. Restoration of marriage to 1960 levels among blacks would have a similar effect; their child poverty rate would fall by nearly a third from the current level of 27.5 percent to 20.5 percent.
Effects on Children Moved into marriage
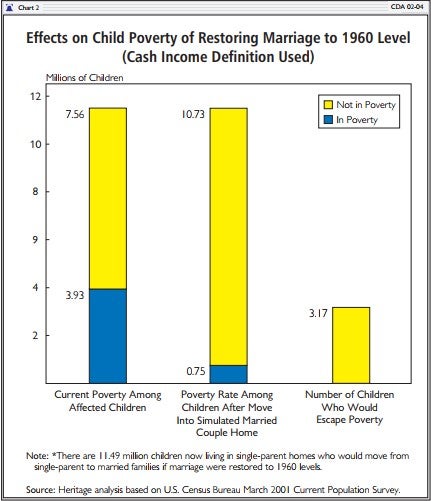
As noted, restoration of marriage to 1960 levels would move 11.49 million children from single-parent homes into married-couple homes. The reduction of poverty within this group of children is striking. As residents in single-parent homes, the current poverty rate of these children is 34.2 percent. Our analysis matched single parents with demographically similar spouses to create simulated married-couple homes. Table 6 shows that, when the 11.49 million children are placed in these simulated married-couple homes, their poverty rate falls to 6.7 percent. Thus, marriage cuts poverty among the affected children by a full 80 percent (from 34.2 percent to 6.7 percent).
Among the 11.49 million children moved into married families, about 3 million are black children. The poverty rate among these children is 45.4 percent before marriage and 9.0 percent after marriage; thus, marriage reduces poverty among the affected black children by 80 percent.
Effects of marriage on poverty Using an Expanded Definition of Income
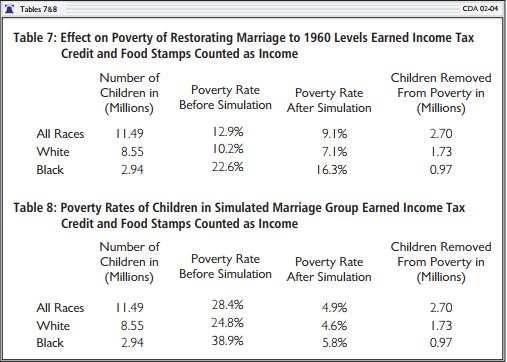
As the final step in our analysis, we calculated the effects of marriage on poverty using an expanded definition of income. The Earned Income Tax Credit and food stamps were counted as part of a family's financial resources when determining whether the family was poor.[13] Naturally, poverty rates both before and after the marriage simulation were lower according to this method of measurement.
Using the expanded definition of income, the current child poverty rate is 12.9 percent. If marriage were restored to 1960 levels, the rate falls to 9.1 percent. A total of 2.7 million children would be removed from poverty. Among black children, the poverty rate falls from 22.6 percent to 16.3 percent, a drop of 28 percent. (See Table 7 and Table 8.)
These results are consistent with other microsimulation models of marriage and poverty. In an influential 1995 article entitled "The Impact of the Changing U.S. family Structure on Child poverty and Income Inequality," Dr. Robert Lerman of the Urban Institute estimated that restoring marriage to 1971 levels would have reduced child poverty in 1989 by approximately 23 percent.[14] Our analysis for this Report differs from that done by Dr. Lerman in two respects. First, due to the difference in years of comparison (2000 to 1960 rather than 1989 to 1971), our analysis moved more children from single-parent to simulated married homes. Second, Dr. Lerman's analysis employed a larger adjustment in male wages due to marriage than we did.
More recently, Adam Thomas and Isabel Sawhill of the Brookings Institution simulated marriage rates similarly by restoring marriage to 1970 levels.[15] Using money income to gauge poverty, the Thomas and Sawhill simulation would drop the child poverty rate from 18.3 percent to 14.8 percent, a 19.1 percent change. As noted above, the Heritage analysis drops the child poverty rate from 15.7 percent to 11.2 percent, or nearly a 30 percent change. The difference with our analysis can be explained in part by the fact the Brookings analysis raised marriage to 1970 levels, whereas this Heritage analysis raises marriage to the higher 1960 levels; thus, we moved more children from single-parent to married families. In addition, the Brookings analysis made no adjustment at all for the effects of marriage on male wages, through either a selection effect or earnings inducement. As a consequence, Thomas and Sawhill underestimate the impact of marriage on poverty.
While statistics on child poverty tend to garner the most press coverage, this social indicator does not change in a vacuum. The decline in the marriage rate since the inception of War on poverty in the 1960s has contributed significantly to the high levels of child poverty over the past few decades. By the estimates in this Report, when poor single mothers are married to single men of similar age, race, and education, their marriage lifts the family out of poverty in about 80 percent of cases. Overall, child poverty would be nearly a third lower today if the traditional two-parent family had not deteriorated between 1960 and 2000.
Robert Rector is Senior Research Fellow, Kirk A. Johnson, Ph.D., is a Senior Policy Analyst in the Center for Data Analysis, and Patrick F. Fagan is William H. G. Fitzgerald Research Fellow in family and Cultural Issues, at The Heritage Foundation.
Child poverty is calculated for all children living with relatives. Children living in foster care situations, in group homes, in other institutional-like settings, and without relatives are excluded from this analysis.[1]
As noted in the methodology section, the authors "married" single parents to similar single individuals in the March 2001 Current Population Survey (CPS) file. The matching/marrying simulation was accomplished in three stages.
First, any single individual who indicated that he or she was an opposite sex "unmarried partner" of the head of a given CPS household was coded as a cohabitor and "married" to the head of the household.
Second, we stratified the remaining single parents and single men/women without children in the home according to the following criteria:
- Sex (two categories: male/female);
- Age range (eight categories ranging from 18-24 to 55-59);
- Race (three categories: white, black, and other); and
- Educational attainment (three categories: high school dropout, high school graduate, and at least some college).
Using all the possible combinations of these four criteria, we created 144 social/demographic partitions for single parents with children and a matching set of 144 partitions for individuals without children.
Third, we randomly selected a number of remaining single parents to be married or matched. Since our analysis sought to restore marriage to 1960 levels, only about 60 percent of single parents were selected for simulated marriage. The selected single parents were matched against single persons of the opposite gender in a corresponding age, race, and education partition. For example, single black female parents between the ages of 25 and 29 were matched with single black males in that age cohort and without children. When there were multiple eligible single persons within a partition, the individuals to be married were also selected at random. Since there typically were far more single individuals without children than there were single parents, many single individuals were not matched and married to anyone.[2]
Marital Effects on Earnings.
After individuals were placed in simulated marriages, male wages were adjusted. The procedures used closely followed those employed by Urban Institute economist Robert Lerman in previous research on this topic. Lerman applied human capital modeling techniques to the issue of marriage and child poverty. He notes that married men, especially those with the responsibility of supporting children at home, earn more than single men, even after controlling for race, education, and work experience.[3] In his simulations of child poverty and inequality, he adjusts the earnings of single men who are hypothetically "married" to take into consideration the effect of marriage in increasing earnings.[4]
In order to simulate the effect of marriage on earnings, Lerman uses a Tobit censored regression model, named for Nobel laureate James Tobin, who first considered the approach.[5] A Tobit regression censors any observations below some prescribed threshold. Since this analysis is interested in positive earnings only, the Tobit model censors earnings less than zero by coding them at zero.[6]
Following Lerman, a set of six models was constructed for the purpose of simulating the earnings behavior of married husbands compared with single men. These six models estimated the following:
- Single white male earnings;
- Single black male earnings;
- Single other race male earnings;
- Married white male earnings;
- Married black male earnings; and
- Married other race male earnings.
The independent variables used in each of the Tobit models included years of education, number of children at home, work experience,[7] and work experience squared.[8] The gap between the expected married male wage and the expected single male wage was then calculated. In order to produce a conservative estimate of the effect of marriage on male wage, we then cut the calculated wage gap factors in half. (Lerman did not make this reduction.) Next, the earnings of the newly married husbands in the simulation were increased by this reduced amount, yielding an average earnings increase of 20 percent.
Finally, the incomes of both partners in the simulated marriage were then combined into a single family income, and the new family income was compared to the official poverty income thresholds for a family of that size.


