
(Archived document, may contain errors)
August 2,1991
HUNGER AND MALNUTRITION AMONG AMERICAN CHILDREN
INTRODUCTION
A startling number of children are in danger of starving... one out of eight children is going hungry tonight.
So began a CBS Evening News broadcast last March 27th.
Its headline-grabbing conclusion came from a survey conducted by the "Food Research Action Center" (FRAC), a liberal advocacy group, and sponsored by Kraft General Foods, Inc one of America's largest food processing companies As it turns out, FRAC claimed that one of eight children in America had been hungry" at some time during the prior year, not each night, as CBS reported. Yet the mistake made by CBS has passed into press and political folklore as conventional wisdom.The FRAC study received saturation coverage in.the press, including stories in the Boston Globe, the Chicago Tribune, the Christian Science Monitor the New York Times, USA Today, and the Washington Post.
Subjective Questions. What is worse, CBS not only exaggerated the study's conclusion, the study itself is flawed and completely contradicted by serious, scientific surveys. Unlike other studies, the FRAC survey did not measure actual food consumption or physiological indices of nutritional status among poor persons. Instead, FRAC asked American families highly subjective questions about whether they would like to have more or a wider variety of foods
1 Media Rd Center, "Media Eat Up Hunger Study," Media Wad, April 1991 p. 1.
Disproving FRAcs conclusions (and the press distortions of them) are extensive, scientific surveys conducted by the Food and Nutrition Service of the U.S.
Department of Agriculture and the U.S. Department of Health and Human Services. These studies actually measure the levels of food consumption and malnutrition in America. Among their findings There is little evidence of hunger or insufficient caloric intake among poor children. The Atlanta-based Centers for Disease Control, the federal agency that monitors disease, reports that poor children are no more likely to experience clinical thinness (very low body weight relative to height) than are children in the general population.
There is no evidence of protein deficiency among American adults or children, rich or poor, according to the Centers for Disease Control 1976-1980 Health and Nutritional Examination Survey, which measures protein levels in the blood.
Protein, vitamin, and mineral consumption by poor children under age six are in almost all cases well above recommended norms, according to a 1985 United States Department of Agriculture survey of the actual food consumption of these children. Little difference was found between the level of nutriments consumed by poor and affluent children.
Overweight not underweight is a major problem in the U.S. according to Nutrition Monitoring in the United States, a joint report of the U.S. Department of Health and Human Services and the U.S. Department of Agriculture. Being overweight is far more prevalent among the poor than among the affluent. Some 40 percent of poor adult women are overweight. Being overweight, as it is widely recognized contributes to such serious medical problems as heart disease, high blood pressure, diabetes, and some types of cancer. The major nutrition-related health problems among poor Americans are not due to hunger or undernutrition.
Other FRAC findings and statements are as unreliable as its statements on nutrition. FRAC, for example, claims that the recent ostensible increases in hunger result from spending cuts on food assistance during the Reagan presidency. In fact, federal, state, and local spending levels, measured in inflation-adjusted 2 U.S. Department of Health and Human Services and US. Department of Agriculture, Nutrition Monitoring in the United States A Report from the Joint Nutrition Monitoring Evaluation Committee. DHHS Publication No PHS) 8612
55. Public Health Service (Washington, D.C U.S. Government Printing Office, July 1986 p. 52 2 dollars, increased in the 1980s. Last year, government spending on food assistance was 68 percent higher in constant dollars than in 1975.
Overall, there is no evidence of protein or calorie deficiency among poor children or adults? Some poor children may experience shortfalls in specific minerals or vitamins but similar shortfalls will occur among higher-income children as well. FRACs claim that poor families suffer from chronic empty stomachs and physical food shortages is belied by the high rate of obesity among poor adults as well as the high level of protein and meat consumption among poor persons.This pattern of food consumption is relatively expensive and is unlikely to occur among households that consistently run out of food to eat.
Abundant Reliable Data. The findings of the FRAC study survey are already being used by Representative Leon Panetta, the California Democrat, to justify increased spending on food assistance. In fact, FRAC is promoting state policies to address problems which do not really exist. Instead of relying upon answers to leading questions, such as those posed by FRAC, federal policy makers and citizen groups concerned about Americas poor should base policy on the scientific data abundantly available from government agencies like the departments of Agriculture and Health and Human Services. Such reliable data enable policy makers to determine what nutritional deficiencies actually exist and to address genuine health problems arising from obesity and overconsumption of unhealthy foods such as fat rather than allegedly widespread hunger As serious, the unsubstantiated and then distorted FFWC claims distract from the real problems facing poor families and children: escalating crime, growing illegitimate birth rates and family disintegration; prolonged welfare dependence and the virtual collapse of the work ethic throughout low-income communities and government schools t hat can no longer even protect the physical safety of poor children, let alone educate them HOW FRAC DISCOVERED WIDESPREAD HUNGER In contrast to the surveys conducted by the U.S. Department of Agriculture USDA) and the Centers for Disease Control (CDC the FRAC study did not actually measure food consumption, physiological status, or obesity. FRAC merely asked parents vague and subjective questions Example: Thinking about the past 12 months, did you ever rely on a limited number of foods to feed your children because you were running out of money to buy food for a meal?
3 Undernutrition likely will occur among poor children who are victims of chronic child abuse. Under-nutrition also may appear among adults who abuse alcohol or drugs or who are mentally ill. However, these problems are not due to failure of government food programs and are unlikely to be resolved by changes in food assistance Policy 3 Example: Thinking about the past 12 months, did you or adult members of your household ever cut the size of meals or skip meals because there was not enough money for food?
Clear and concrete questions, such as the number of times children were forced to skips meals entirely due to a lack of food, were not asked. Instead, the FRAC questions focus mainly on whether a family would like extra money to buy more different, or better quality food. Predictably, such leading questions led FRAC to discover that many low-income households were hungry.The same method led FRAC to conclude that more than 5 percent of families With incomes over 25,000 per year were hungry as well! Complained Mickey Kaus in the New Republic: The whole project oozes phoniness proposes, for example While FRACs survey questions were vague, its policy proposals are not. FFUC An aggressive publicity program to promote use of the Food Stamp program to combat putative hunger Increasing funding of the Women, Infants, and Children (WIC) food program until all eligible families receive aid Expanding the School Breakfast program, noting that while nearly all schools offer free lunches to poor children, many do not offer free breakfasts.
FRACs claim that one-third of families eligible for Food Stamps do not receive them is correct. But this does not necessarily mean that there is a real need for these families to begin receiving them. USDA studies conducted during the Carter Administration, when there was also concern that Food Stamps were not reaching many eligible families, found that families eligible for Food Stamps, but not participating, generally had hi g her incomes than families which did receive food stamps. On average these non-participating families would have been eligible to receive only a small amount of Food Stamp aid. Moreover, the USDA study did not find these families to be malnourished; in fact , the study found few significant nutritional differences between eligible but non-participating families and families actually receiving Food Stamps. 7 4 Food Research and Action Center, A Survey o/ Childhood Hunger in the United States, Community Childhood 5 Mickey Kaus, Facts for Haw The New Republic, May 20,1991, p. 23 6WIC is not an open-ended entitlement program. Its funding is limited by annual appropriations and is not hunger sufficient to provide benefits to all theoretically eligible persons. FRAC seeks to expand WIC funding to cover all eligible persons 7 US. Department of Agriculture, Human Nutrition Information Service, Food Consumption and Dietory Levels of Low-Income Households November 1979 Match 1980 (Washington, D.C U.S. Department of Agriculture 1987 pp. 23-25 4 Misguided Proposal. Likewise, FRACs proposed expansion of WIC is misguided. Most poor families eligible for WIC already receive assistance, but other families earning up to $24,000 per year are also eligible for WIC aid. FRAC seeks to expand WIC assistance provided to these higher income families. But the needy families to which FRAC wishes to extend WIC services and many now receiving WIC have money taken out of their paychecks to pay federal taxes. A family of four earning $16,000 per year now pays about $2,000 to the federal government in taxes. A family earning $24,000 per year pays $5,1
27. Thus, in effect, FRAC proposes taking money out of a family's paycheck through taxes on Friday and then giving them free orange juice through WIC on Monday. To the extent that these families find it hard to afford food, the obvious alternative is simply to reduce their taxes.
FRAC urges expansion of the School Breakfast Program, arguing that poor children w ho eat breakfast will be less fatigued and will learn more during the school day. But research has shown that the availability of the School Breakfast program at a school does not increase the probability that poor students at that school will eat breakfast, nor does active participation in the breakfast program in crease a poor child's overall nutritional intake. 8
THE MYTH OF AMERICAN MALNUTRITION The FRAC report defines hunger as a physical condition that comes from not eating enough food due to insufficient economic resources According to FRAC, hunger is a state of chronic mild undernutrition. 10 Malnutrition is caused by the significant over- or under-consumption of nutriments. The human body requires three basic types of nutriment: calories (fuel for t he body proteins (the amino acids that are the building blocks of bone and tissue and minerals and vitamins (the catalysts for vital body functions).
Americans at different income levels. The federal government establishes a poverty income threshold each year and families with incomes below this threshold are defined as poor. In 1989 the poverty income threshold for a family of four was 12,6
75. Children living in these families, according to the data, consume high levels of calories, protein, vitamins, and minerals.
The federal government compiles its nutrition data through detailed and precise surveys that, of course, are far more elaborate and exact than FRACs vague questions. Since the 1930s, in fact, the U.S. Department of Agriculture has conducted food consumption surveys, extensively interviewing representative house holds Detailed scientific data exist on the consumption of these nutrients by I 8 Barbara Devaney and Thomas Fraker, The Dietary Impacts of the School Breakfast Program, American Agriculture Economics Association, 1989, pp. 932-948 9 Survey of childhood Hunger in the United States, op. cit p. 2 10 Ibid 5 to determine how much food is consumed on various days throughout the year.
These surveys permit comparisons of average food consumption in households from different socio-economic strata.
In 1985, the USDA thoroughly surveyed the food consumption and nutritional status of pre-school children and young mothers. It found little evidence of under nutrition among the poor.To the contrary, it found that children in low-income families consume food with just about the same nutritional content as do children in affluent American families.
Example: Children in families with incomes below 75 percent of the poverty level (roughly $ 8,242 for a family of four in 1985) consume 54.4 grams of protein per day, compared with 53.6 grams for children in families with incomes above 300 percent of poverty (roughly $33,000 for a family of four in 1985).
Example: Black pre-school children consume 56.9 g rams of protein per day compared with 52.4 grams for white children.13
Example: Children in the central cities consume slightly more protein and calories than do children in the suburbs
ll The USDA food consumption data not only show that the average consumption of nutriments between poor and higher-income children is similar, but also that the variances from the average intakes in both income groups are similar. This reinforces the argument that poor children are not significantly undernourished relative to higher income children. 12 Human Nutrition Information Service, U.S. Department of Agriculture, Low Income Women 19-50 Years and Their Children 1-5 Years, 4 Days: 1985, CSF I1 Report 85-5 (Washington, D.C U.S. Department of Agriculture 1988 p 50. Human Nutrition Information Service, U.S. Department of Agriculture, Women 19-50 Years und Their children 1-5 Years, 4 Days: 1985, CSF I1 Report No. 85-4 (Washington, D.C U.S. Department of Agriculture, 1987 p. 42 l3 Women IPSO Yeam, op. cit p. 42 14 hid 6 As
Table 1 indicates, average consumption of nutrients is very high for pre-school children in families of all income classes. Indeed, for children living in families with incomes below 75 percent of the poverty level, average daily protein consumption is 211 percent of recommended USDA Recommended Daily Allowances (RDA)
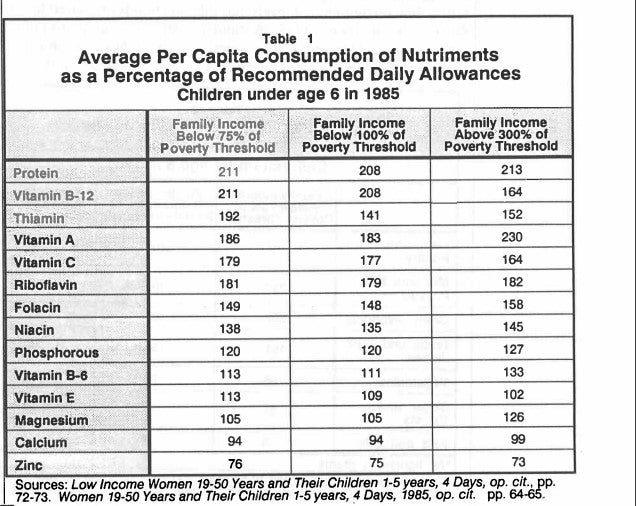
Essential minerals and vitamins, meanwhile, are consumed by children in both high and low income families at levels often as much as 50 percent above USDA standards. In only a few instances does nutriment consumption fall below recommended levels. This is true of calcium consumption, which for both poor and high income families is slightly below the USDA level. Average zinc consumption also falls below recommended levels, but this shortfall is unrelated to income class.16 Since the recommended USDA standards for consumption of minerals and vitamins, are set above the levels need ed for good health for most persons, an average deficiency does not necessarily indicate significant nutritional problems
36. Women 79-50 Years and Their Children 1-5 years, 4 Days, 1985, op. cit. pp. 14d 16 Low Income Women 19-50 Years, op. cit p 73. Women 19-50 Years, op. cit p. 65.The 1985 food consumption survey also shows iron deficiency in all income classes. However, the USDA determined that the recommended daily allowance for iron per young children had been set too high. A new recommended daily iron intake for young children was established in 198989. According to this standard, the average intake of iron of both poor and non-poor children was sufficient.
17 Nutrition Monitor, 1986, p. 29.The federal government has a complex process of evaluating the nutritional status of the American population.The USDA food consumption surveys provide preliminary data on the nutrient intakes of various groups. If a group's average intake of a nutriment falls below the Recommended Dietary Allowance (RDA this is not a definite indication of a nutritional deficiency. States the Nutrition Monitor: "... mean intakes of population groups falling well below the RDA can be taken as a rough indicators that further examination of the status of the population is needed Monitor, 1989, op. cit p 16. Additional information on a group's nutritional status can be provided by hematological and biochemical tests, clinical examinations and body structure data. These will show clearer evidence on nutritional deficiency
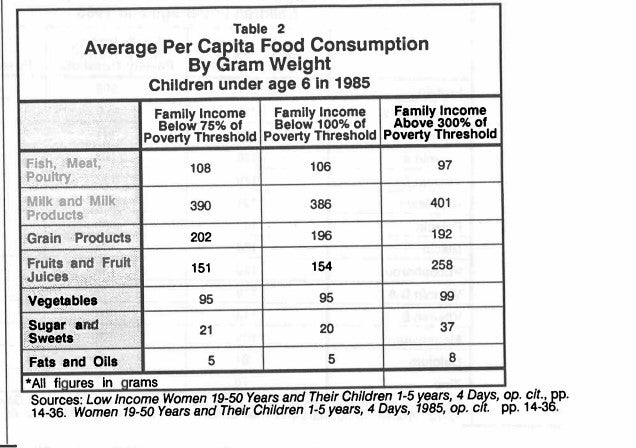
Table 2 shows the types of food consumed by poor and affluent children. As it turns out, poor children actually eat more fish, meat and poultry than do children in higher-income families. In other foods, the general consumption pattern is similar for both economic groups. Though higher-income family children do consume much higher levels of fruit and fruit juice, lower consumption by poor children does not result in Vitamin C deficiency
THE SCIENTIFIC SEARCH FOR SIGNS OF MALNUTRITION
The federal government supplements its extensive food consumption surveys with periodic physiological surveys of Americans. Between 1976 and 1980, for instance, the Centers for Disease Control conducted the National Health and Nutrition Examination Survey II (NHANES II) analyzing blood, urine, and physical characteristics in the U.S. population. Based on a representative sample of tens of thousands of Americans, the NHANES II data were used to gauge levels of vitamin, mineral and protein intake.
Protein. As part of the 1976-80 NHANES II survey, CDC offices analyzed the bloods most common protein, serum albumin. Low levels of serum albumin are the strongest indicator of protein-caloric malnutrition. Protein deficiency is dangerous; it retards growth, impairs mental functions and causes fatigue. Starva tion, in fact, results from massive and prolonged protein-caloric deficiency.
The NHANES II survey found protein deficiency in only 19 individuals out of the 15,457 persons in the representative sample surveyed. This is less than one-tenth of 1 percent.There were no differences, moreover, between races or between poor and non-poor persons. Thus concluded the Nutrition Monitoring Update, a joint report prepared by the Department of Health and Human Services (HHS) and the USDA in 1989: "Protein is not considered to be a current public health issue... there is no evidence of health problems associated with deficiency or excess." 19 The report added that protein deficiency in America is "essentially non-existent." Those few instances when it does occur are not linked to poverty. Indeed, poor as well as affluent Americans have protein-rich diets in comparison with the rest of the world.
20 18 Nutrition Monitoring in the United States:1986, op. cit., p. 65 19 Life Sciences Research Office, Federation of American Societies for Experimental Biology, Nutrition Monitoring in The United States: An Update on Nutrition Monitoring, Report prepared for the U.S. Department of Agriculture and the U.S. Department of Health and Human Services (Washington D.C.:U.S. Government Printing Office, September 1989 p. 51 20 Robert Rector, Kate Walsh O'Beirne, and Michael McLaughlin, How Poor are Americas Poor? Heritage Foundation, Backgrounder No. 791, September 21,1990 9 Minerals and Vitamins. NHANES II analyzed children's blood for a variety of mineral and vitamin deficiencies. Such deficiencies were found to be rare and largely unrelated to economic status. Example: NHANES II found no evidence of low levels of serum Vitamin C among children under eleven. While from 1 percent to 2 percent of American teenagers have low serum Vitamin C levels, this actually is more common among non-poor than poor teenagers?l A deficiency slightly more prevalent among children from poor families is low serum zinc levels; yet even this is found in only among 2 percent to 3 percent of all children Iron Deficiency. Iron is the nutrient most commonly deficient in America, as it is in most other developed nations. As a key component of hemoglobin, iron is essential to blood's ability to absorb and deliver oxygen to the body. Iron deficiency most frequently occurs in periods of rapid body growth, like infancy, adolescence and pregnancy, and can reduce work performance, cause fatigue, impair mental activity, and increase susceptibility to infection.
During the early 1970s there was concern that iron deficiency was causing high rates of anemia (low blood cell levels per volume of blood fluid) among poor young children.This concern prompted the Centers for Disease Control in 1974 to begin monitoring anemia among those low-income pre-school children deemed at high nutritional risk. In 1975, the CDC found a 7.8 percent incidence of anemia in this group. By 1985 anemia among low-income children had been more than halved down to 2.9 percent.= The anemia rates for poor children are now quite low, though still slightly higher than the anemia rates for middle-class children.24 Part of the decline in anemia is a result o f the expanded Women, Infants and Children program. Yet the most dramatic reductions in anemia from 1975 to 1985 occurred among poor children before their enrollment in WIC. Similar reductions in anemia occurred among middle class children not eligible for WICZ These dramatic improvements resulted from increases in iron levels in the general food supply and from changes what young children were eating.These improvements in high- and low-income families included: greater frequency and duration of breast feeding, increased substitution of iron-fortified infant formula for non-fortified milk, and increased use of iron-fortified cereals 21 Nutrition Monitor in the United States: 1986, op. cit p. 148 22 aid, p. 186 23RayYip et d Declining Prevalence of Anemia Among Low-Income Children in the United States," JM UInterView with Dr. Ray Yip of the Centers for Disease Control, July 17,1991 25 Ray Yip et ul Declining Prevalence of Anemia in Childhood in a Middle-Class Set- A Pediatric Success 26 "Declining Prevalence o f Anemia Among Low-Income Children op. cit p. 1622 September 25,1982258 pp. 1619-1623 Stow Pediam'cs, September 1987:80 No. 3 pp330-334 10 While CDC data from the mid 1970s show significant declines in anemia among children from poor families after hose children began participation in WIC, CDC data from the 1980s show WIC playing a diminishing role. The difference in anemia rates among poor children prior to enrollment in WIC and the anemia rates of such children after participation in WIC shrank between 1 975 and 198Xn This suggests that the increased level of iron nutrients consumed by children in general has meant that WIC has played a less significant, though still important, role reducing iron deficiency among the poor in recent years MALNUTRITION AND BODY STRUCTURE The effects of malnutrition are evident not only in blood chemistry but also in a child's body structure. Body weight relative to height, for instance, is the best indicator of adequate caloric intake.28 A child who consumes far too few calories will have low body weight relative to height, a condition known as thinness or wasting.29 In detecting malnutrition, therefore, surveys of body structure are important supplements to food intake studies.
The CDC in 1973 began monitoring thinness or wasting among poor children. The CDC data show that thinness is no more common among impoverished children than among the general population. Concludes the Nutrition Monitor report produced by the USDA and HHS in 1986: Wasting does not constitute a significant health problem among Americas impoverished children.
Poor girls have roughly the same level of general body fat as non-poor girls of the same age up to their early teenage years. After that, poor girls begin adding markedly more body fat and are more likely to become obese than are non-poor girls. By contrast, poor boys have slightly less body fat than more affluent boys up to the teen years, but after that have roughly the same body fat?1 30 27 &id 28 Nutrition Monitoring in the United States: 1986, o p. cit p. 51 29 Nutrition Monitor, 1986, op. cit p. 198 30 Bid, p. 199 31 Stanley M. Garn et al Differential Fatness Gain of Low Income Boys and Girls, The American Journal of Clinical Nutrition, August 1981: 34 pp. 1465-1468 11
While the N"ES II survey did find that poor children were roughly per cent, or a half inch, shorter than non-poor children of the same age: the survey found no consistent evidence linking lower height to lower levels of nutrition. The Monitor Update report cautions that many factors may contribute to the relative shortness of poor children.
Parents' height, genetically transmitted to offspring, is the strongest determinant of a child's height. Poor children, on average, have shorter parents than non-poor. children.
A child's height and growth may also be reduced by: emotional disturbances triggered by unstable family structure smoking by a mother during pregnancy, exposure to parental smoking in the home during childhood, and low birth weight. Unstable families, smoking during pregnancy and in the household, and low birth weight all are more common among children from poor families than those from non-poor families P 34 35 HUNGER AND OBESITY IN AMERICAN FAMILIES FRAC and others-citing hunger as one of America's most pressing problems typically paint a dismal picture of millions of malnourished poor families with bare cupboards and empty refrigerators, of parents who skip meals so that children may eat, and of children going to bed on empty stomachs 32 Based on children aged 6 to 11 33 D . Yvonne Jones et al Influences in Child Growth Associated With Poverty in the 1970s; an Examination of Es I and NHANES 11, Cross-Sectional U.S. National Survey 1-3 The American Journal of Clinical Nutrition, October 1985.42 pp. 714-724 34 Bid p. 721 35 George R. Kerr et al Height Distributions of US. Children: Associations with Race, Poverty Status and 36 Nutrition Monitoring in the United States: 1989 op. cit p. 86 37 Peter C. Elwood et al Growth of Children From 0-5 years: With Special Reference to Mother' s Smoking in 38 Nancy J. Binkin et ul Birth Weight and Childhood Growth Pediubics, 1988:82 No 6, pp. 828-834 Parental Size Growth, 1982% pp. 135-149 Pregnancy,"Ann& of Human Biology 1987:14 No. 6, pp. 543-557 12
This picture, however, is contradicted by all available facts, particularly the high prevalence of obesity among poor adults. Persons who consistently lack enough food to eat become underweight, but being underweight is not a problem among the poor. By contrast, clinical obesity is a genuine, serious health problem among poor adults? Nearly 40 percent of all poor adult women are overweight; a poor adult woman, moreover, is 40 percent more likely to be overweight than a non poor woman.40 Overweight is particularly severe among black women. States the Nutrition Monitor, Obesity is more prevalent among the poor indicating an imbalance of energy intake to energy expenditure. Many of the health problems of the poor are related to obesity.excessive weight or obesity con tributes to high blood pressure, diabetes, cardio-vascular disease, and some types of cancer. By contrast, there is no indication among the poor of any prevalence of the medical problems caused by consistent caloric insufficiency.
It is possible, of course, to be overweight and malnourished. T his could occur through the over-consumption of calories and the under-consumption of minerals protein, and vitamins, but government surveys indicate that this probably is not what is happening.They reveal that when the poor suffer vitamin and mineral shortages, they do so in ways similar to upper-income adults. 43
Efficient Purchasers. There is also no evidence that poor families are forced by financial pressures to eat cheap and unhealthy foods. To the contrary. Surveys find that poor households purchase foods quite efficiently. In fact, the poor generally buy more protein and other nutriments per dollar of food expenditure than do 39 Nutrition Monitoring in the United States: 1989 op. cit p. I1 32 40 Nutrition Monitoring in the United States: 1986 op. cit p. 302 41 Each individual has an energy balance: the relation between food energy (calorie) intake and energy expenditure. Energy expenditure is determined by the bodys base metabolic rate plus the level of physical activity. Consistent doridenergy intake in excess of energy expenditure causes Overweight.This does not mean that overweight persons ndy eat more than other individuals but simply that their caloric consumption is greater than their specific energy expenditure. However, an overweight person cannot be c onsistently hungry in the conventional sense of having insufficient bulk food and calories to consume. Ibid, pp. 51-63 42 Ibid, p. 2 43 Human Nutrition Information Service, U.S. Department of Agriculture, Nationwide Food Consumption Survey Continuing Swey of Food Intakes by Individuals Men IPSO Yem, Z Day:Z985, NFCS, CFSll Report No. 85-3 Washington D.C.:U.S. Department of Agriculture, 1986 Low Income Women IPSO Yem and Women IPSO Yem, op. cit. See also Shiriki Kamanyika, Obesity in Black Women, Epidemiolo g ical Review, Vol. 9,1987, pp 39-45. typical affluent households.u Poor households, moreover, generally do not eat more fat as a share of total diet than do non-poor~households~s And poor households actually eat less unhealthy cheap simple sugars and slight ly more corn plex carbohydrates a healthy food item than do affluent households.46 Poor persons actually have lower levels of serum cholesterol relative to higher income persons of the same gender, age, and race.
That children in poor families do not suffer from food shortages and recurring calorie deficiency is,confirmed further-by surveys of the types of food eaten by poor families. As shown in Table 2, poor children on average eat more meat products than do higher-income children, while the average protein intake of poor children and adults is well above recommended standards. Much of this protein comes from meat, which today is eaten by poor households to about the same extent that it is by higher-income households.a Meat is relatively expensive. The high consumption of meat by the poor reflect's the poor's preference for meat over the much less expensive grain products, which provide a healthful source of bulk food and calories 47
CUTS IN FOOD AID
America's putative hunger problem is blamed by FRAC and others on the Reagan Presidency's putative cuts in food and welfare programs. In fact, total spending on federal and state welfare programs in constant dollars during the Reagan Presidency jumped by 18 percent from 1980 to 1988, reaching a grand total of $184 billion per annum. 5o Aggregate spending on food assistance programs, measured in constant dollars by both federal and state governments also increased during the 1980s. After peaking during the recession of the mid 44 Nutrition Monitoring in the United State s : 1986 op. cit p. 56,68 45 hid, p. 75 46 hid, P. 87 47 Nutrition Monitoring in the United States: 1989 op. cit pp. I1 72-74 48 Rector, O'Behe, and McLaughlin, op. cit 49 Calories are a cheap nutriment. According to USDA, grains can supply one-fourth of a five-year-old child's calorie needs for roughly 17.cents a day. This is not to suggest that poor children should increase grain consumption, but it is simply intended to indicate that once a child's protein, mineral, and vitamin requirements have been met, as is the case with the average poor child, the marginal cost of providing extra calories is very low. Therefore it is unlikely for pr children to have very high intakes of protein, minerals and vitamins while suffering from calorie insufficiency. It is very unlikely for poor children to have the same level of meat consumption as an afnuent child while still being calorically deprived or going to bed on an empty stomach 50 Rector, O'Beirne, and McLaughlin, op. cit 14 1980s food assistance remained at $24.4 billion in 1990. Adjusted for inflation this was 15 percent higher than spending in 1980 and 68 percent higher than spending in 1975.
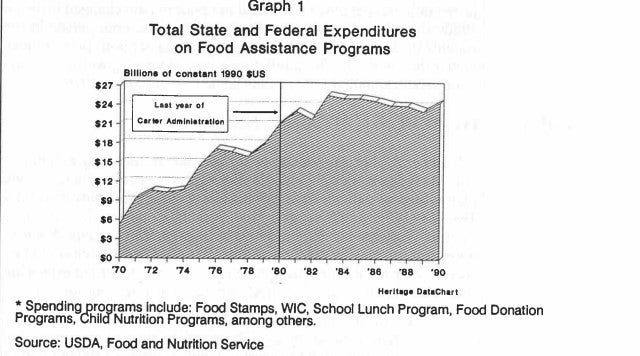
'l Graph 1 Total State and Federal Expenditures on Food Assistance Programs Bllllona Of O OnllMI lSS0 ws 27 70 72 74 78 78 '80 '82 '84 '88 '88 '90 Herllagr DrtrChrrt Spending ro rams include: Food Stamps, WIC, School Lunch Program, Food Donation Programs ildlNutriiion Programs, among others.
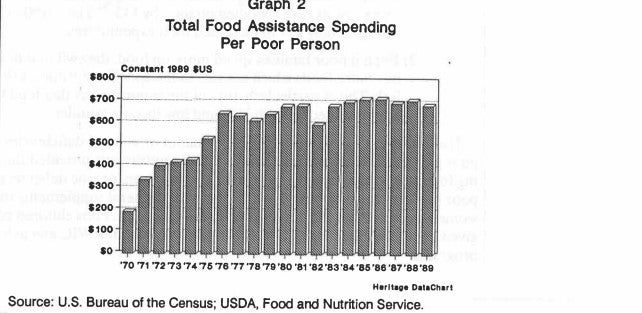
Source: USDA, Food and Nutrition Service Graph 2 Total Food Assistance Spending Per Poor Person Conatant l989 (US 800 70 71 72 73 74 76 76 77 78 79 '80 '81 '82'83'84'86'88'87 '88 '89 Herltwe Data Chart Source: U.S. Bureau of the Census; USDA, Food and Nutrition Service 51 Expenditure figures provided by the Food and Nutrition Service of USDA. Fwes have been adjusted for inflation according to the Bureau of Labor Statistics Consumer Price Index for food consumed in the home 15 An analysis of per capita spending yields similar results. Graph 2 shows total spending on food assistance per poor person between 1970 and 1989 (the last year for which data on the number of poor persons are a~ai1able.f~ In inflation-adjusted dollars, spending on food aid per poor person changed little during the 1980s; the value of government food assistance per poor person in 1989 remained roughly the same as in 19
80. However, food aid per poor person today is far higher than in the 1970s. In inflation-adjusted terms, government food aid per poor person equalled $687 in 1989 compared to $529 in 1975?3 POLICIES TO MEET NUTRITIONAL NEEDS In general, poor Americans, young and old are relatively well nourished. Some poor Americans appear to have deficiencies in specific minerals or vitamins but higher-income persons have deficiencies in these same nutriments. Example: the 1985 Food Consumption Survey indicates that some low-income and high-income mothers consume insufficient levels of calcium, iron and zinc. Some poor and non poor children may be deficient in zinc. But there is little reason to believe these specific nutriment shortfalls, will be addressed by the broad expansion of food programs recommended by FRAC. There are two reasons for this 1) Giving a family food aid does not necessarily increase how much a family spends on food. Research by the Congressional Budget Office finds that the average family receiving 100 in Food Stamps decreases its cash spending on food by 43. Thus $100 in food aid results in only $57 in increased food expenditures 2) Even if poor families spend more on food, they will not necessarily buy more foods which are rich in the specific nutriments that they lack. This is particularly true of those nutriments that tend to be underconsumed by both high and low income families I The way to correct potential specific vitamin or mineral deficiencies among poor persons is to increase the levels of these nutriments provided through existing food programs. Example: potential calcium, iron, or zinc deficiencies among poor mothers could be addressed by providing mineral supplements to these women as part of the WIC and Food Stamp programs. Poor children could be given increased zinc through foods provided through the WIC and School Lunch programs 52 The figures in graph 2 are intended to show trends in expenditures relative to the poverty population, not absolute benefit levels. Because some food assistance goes to persons with incomes above the poverty level, the figures should not be construed to represent the average value of food assistance received by poor persons 53 Expenditure totals provided by Food and Nutrition Service, USDA. All figures are in 1989 dollars 54 Congressional Budget Office. "The Food Stamp Program: Income or Food Supplementation Washington D.C US. Government Printing Office, January 1977 16
CONCLUSION At the turn of this century, as many as 10,000 Americans died annually from pellagra, a disease caused by vitamin B deficiency. Such diseases caused by under nutrition have all but disappeared in America. U.S. Department of Agriculture and Centers for Disease Control surveys meanwhile find no evidence of significant widespread undernutrition and few significant differences in food consumption and nutritional intake between poor children and upper-income children.
Major nutrition-related health problems in America are caused by excessive food consumption, not by food shortages. And being overweight is far more common among poor families than among non-poor: 40 percent of poor adult women are overweight.
Among poor children there are few nutritional deficiencies: some may suffer shortfalls in nutriments such as iron and zinc. Similar deficiencies, however, occur among the non-poor.The most effective way to deal with specific mineral and vitamin deficiencies among poor children is to increase the levels of these minerals and vitamins in foods already provided under the WIC and School Lunch programs.
American poor children and their families face overwhelming problems: escalating crime, disintegrating families, prolonged welfare dependance, and collapsing public schools. Chronic widespread undernutrition, however, is not a problem among poor children. FRACs policy proposals are defined to combat a problem that does not exist. The FRAC research only distracts attention from the serious problems that face poor families today.
Robert E. Rector Policy Analyst 55 Nutrition Monitor 1986, op. cit p. 120 17


