
In 2014, Seattle already had the highest minimum wage in the country, $9.47 per hour. It voted to raise the minimum to $15 per hour over the course of several years. Thankfully, the city commissioned University of Washington (UW) economists to study the unfolding policy and its results, using high-quality state data.
The most recent of the UW studies was released last week, and found that the minimum wage cut total low—and moderate—wage work hours by 10 percent. Most of the lost work hours were due to lost jobs. Some workers got raises; others lost their jobs.
The UW findings imply that the minimum wage eliminated about 1.5 percent of all jobs in Seattle, even though it had only reached $12 per hour for most workers. However, like other studies, these estimates are context-specific and statistically imprecise and should be used with caution, especially as the UW team continues to refine its methods.
What does make this study special is that it sheds new light on earlier studies that used inferior data—and shows how economists have misinterpreted earlier results. By directly measuring the paychecks of affected workers, the UW research offers a conceptual ceiling on the minimum wage that all sides of the debate should agree on: when a minimum wage fails to raise the total earnings of affected workers, it is a bad policy.
The Scene
Seattle is growing gangbusters. From 2014 to 2016, the population grew 5.5 percent and employment covered by the UW team’s research grew 13 percent, continuing a torrid trend.
Seattle’s growth has been the result of an excellent local policy decision: to permit construction in response to rising rent. Seattle is the reigning building-crane capital of America, and has added over 5,000 apartments each of the last couple years.
If a high minimum wage could work anywhere, it would be here. Local unemployment is extremely low. And wages are high: in the UW team’s data, just a quarter of jobs in Seattle paid below $19 per hour; nationwide, about half of all jobs pay less than $19.
The Policy
Seattle’s minimum wage increase is being phased in over multiple years at several different levels. Table 1 from the UW study shows the detailed phase-in plan, which differs by employer size and by whether employees are tipped or receive medical benefits.
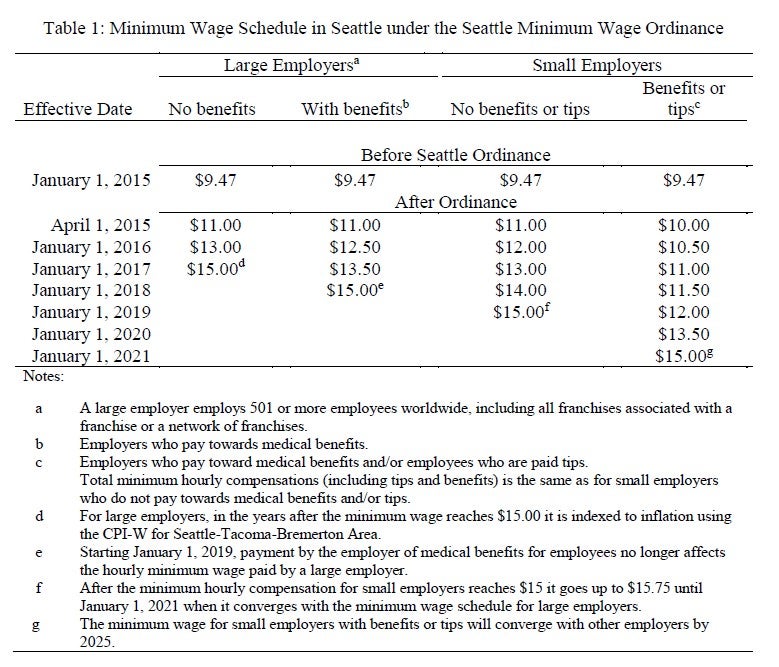
In 2016, when the UW study period ended, employers of over 500 employees faced a minimum wage of $13 per hour (or $12.50 if they offered medical benefits). Smaller employers could pay $12 per hour, or $10.50 for those offering medical benefits or tips.
By 2019, most workers will be receiving $15 per hour or more. The minimum wage will keep rising in the future, since it is pegged to a too-high measure of inflation. In real terms, the minimum wage will be around $19 by 2050.
Knowing that the damning UW report was in the works, the mayor’s office reached out to Michael Reich at the University of California at Berkeley. The Berkeley team did not have specific data on hourly wages, so they used employment in restaurants, especially fast-food establishments, as a proxy for minimum wage employment. As the mayor’s office hoped, the Berkeley team found no significant change in restaurant employment.
The UW team was able to show that Berkeley’s results are correct as far as they go—but that the data available to the Berkeley team was too shallow, and thus its policy conclusions were wrong.
The Study
The UW team attempted to tease out the effect of the minimum wage increase on wages, jobs, and hours in Seattle by comparing it to a weighted average of several other locations that had similar trends up until 2014. The key assumption is that those trends would have remained similar if not for Seattle’s policy change.
Results
Examining the first year of the policy, UW found that low earners earned just as much at a $9.47 minimum wage as they did a year later at $11. Since there are efficiency, fairness, business and consumer costs to having minimum wages, $9.47 was clearly a better minimum wage for Seattle than $11.
Extending the analysis to 2016, low earners were even worse off. UW found that there were 6 to 10 percent fewer low—and moderate—wage jobs available by October 2016 than if the minimum wage had remained at $9.47 per hour. Total hours in such jobs were about 10 percent lower and the average hourly wage in such jobs was about 3.6 percent higher. The total effect on low—and moderate—wage payrolls was a decrease of about 6 percent.Statistical imprecision means that the particular employment, hours, and payroll estimates should be followed by a mental “plus or minus 3 or 4 percent.”
Limitations
Even with superior data, the UW team could not identify job location for most multi-site employers, nor do their data cover people who work on 1099 contracts. Statewide, the study included 62 percent of employees.
The UW team persuasively argues that they would have found greater job loss if they had been able to include multi-site employers. In a 2016 survey of 500 affected business owners, 52 percent of multi-site employers said that they had reduced the number of minimum-wage full time workers in the last year; 45 percent of single-site employers said the same.
A more serious data limitation facing the UW team was the lack of comparable data from outside Washington State. Their methodology— synthetic control—relies on finding other localities with unchanged minimum wages that have similar underlying trends to the “treatment group” of Seattle.
Intuitively, one would expect to find comparable trends in similar high-growth tech hubs. But those are scattered around the country; Washington only has one big city.
Technical questions
The UW and Berkeley studies both relied primarily on “synthetic control” methods. However, the UW team did not use any covariates to identify the control group for each of its estimates. As Gregor Pfeifer and others showed in a recent paper, altering the set of covariates can substantially change synthetic control estimates.
The Berkeley study is at an advantage in its ability to draw a control group from around the country, where there are other rapidly-growing tech hubs. Regrettably, the donor counties seem largely dissimilar to Seattle. Lee County, Florida, with a median wage a third lower than the Seattle area’s, is one of the counties on which Berkeley’s methodology leans heavily.
Rethinking Previous Work
There are many studies of specific minimum wage increases, each with its own results and arguments about methodology. What makes the UW study different is that it can show how researchers with shallower data would—errantly—arrive at the conclusion that large minimum wage increases do not lead to substantial job losses.
Since most researchers do not have data on hourly wages, they use approximate low-wage employment with a sector (usually restaurants or fast food) or demographic group (usually teenagers) that has a lot of low-wage work.
Showing the superiority of their data, the UW team analyzed Seattle’s restaurant sector. They found, the same as the Berkeley team, that there was no statistically significant job loss in the restaurant sector overall. The statistical imprecision was quite large—neither study could statistically rule out ample job losses or job gains in the sector.
But UW’s wage and hour data allowed them to look under the hood. What they found was that there was a drop in low—and moderate—wage employment in the restaurant sector just as large as anywhere else (although imprecisely estimated). Total hours dropped about as much as jobs did; there was no apparent change in average hours per worker in the restaurant sector.
Elasticities
Economists use elasticities to neatly summarize how much a change in one thing (say, wages) affects another thing (say, hours worked). Elasticities in minimum wage studies are highly contextual: they depend on the duration of the study period, the size of the region that raised its minimum wage, and how high the minimum wage was to start, among other factors.
The UW team presented its results in conventional ways, and then in unconventional ways. Using the common method in previous studies (which, recall, do not usually have wage data), they find that a 37 percent increase in the top statutory minimum wage (from $9.47 to $13) led to a 10 percent decrease in hours. That is represented by an elasticity of -0.27. That estimate is statistically imprecise enough that the true elasticity could be anywhere from -0.05 to -0.5, even if one fully accepts the methodology as correct.
The elasticity for total employment relative to the top statutory minimum wage, which would be closest to what several previous studies estimate, is -0.16.
Such an estimate would not be atypical; what is different is the interpretation. The logic of minimum wage increases has been, “Raising minimum wages by 37 percent is absolutely worthwhile at a cost of just 6 percent of affected jobs.”
But with data on hourly wages, the UW researchers show that wages of affected workers (which includes those with wages as high as $19 per hour) rose by only 3.6 percent. Unlike other estimates in the paper, this one is very precisely estimated—plus or minus just 0.14 percentage points.
The authors do not report the elasticity of total low and moderate wage payrolls to the statutory minimum wage change, but it is easily calculated: a 6.5 percent decrease in payrolls divided by a 37 percent increase in the top statutory minimum wage implies an elasticity of -0.18. Since the relevant minimum wage for most workers was not the top minimum wage, this elasticity is actually an underestimate.
Although statistically imprecise, this final elasticity means that each 10 percent increase in the statutory minimum wage cost low-wage workers as a group 1.8 percent of their weekly earnings.
Interpreting earlier work
Because the rich Seattle data shows (quite precisely) the translation from a statutory wage elasticity to a received wage elasticity, it gives us a rough benchmark against which to consider previous papers that estimated only the former.
In the Seattle case, a statutory wage elasticity of -0.08 was associated with a -0.97 received-wage elasticity. If the distribution of low hourly wages is reasonably similar elsewhere, small statutory elasticities will also imply much larger received-wage elasticities.
Next steps
The UW team closes its paper with a tantalizing promise of future work that links the employment and wage data to state administrative data on demographics and welfare. Given how little is understood about the demographic and individual impacts of minimum wages, its future work could be an even larger advance.
The UW team also needs to improve its methodological approach to be more certain that its control group is well chosen. Adding covariates to the synthetic control method is the most obvious way to improve the methodology. They can also add to readers’ understanding by reporting more descriptive statistics and robustness tests. For example, it would be valuable to know if the changes in employment patterns are similar at continuing firms or concentrated in new firms and closing firms.Conclusion
The most compelling evidence in the UW study is not the fancy statistical footwork; it’s the blunt data and simple survey results.
When asked in early 2016, almost half of affected employers, including multi-site companies, said that they had reduced full-time minimum wage employment in the past year.
Lo and behold, single-site companies in Seattle had 6,000 fewer jobs paying below $19 per hour in 2016 than they had in 2014. The same companies added 50,000 jobs paying $19 an hour or more.
The goal of the fancy statistics is to estimate what would have happened in the absence of a minimum wage increase. What the raw evidence shows us is that the statistics are not sussing out some invisible trend, or suggesting that growth ought to have been a little higher than it was. The statistics are rather confirming that the obvious interpretation is correct: low wage workers have been completely left out of Seattle’s boom.
Empirical economists on both left and right agree that a low enough minimum wage will have no discernible impact and a high enough minimum wage will hurt those it intends to help. The debate is not over the theory, it is over the level of minimum wage where the lost paychecks start to cancel out the gained raises. With apologies to O. O. McIntyre, we have established what kind of woman the labor market is; now we are haggling over the price.
The evidence from Seattle suggests that the minimum wage became too high to help its intended beneficiaries somewhere in the vicinity of $10 per hour. Since there are few U.S. cities with higher median wages or lower unemployment, the rush to raise minimum wages to double-digit levels around the country is badly misguided and will hurt low-wage workers along with, obviously, everybody else.


