Unable to enact cap-and-trade legislation, even when he was supported by filibuster-proof majorities in Congress, President Barack Obama famously claimed, “Cap and trade was just one way of skinning the cat; it was not the only way.”[1] The primary alternative way to skin the cat is regulation by federal agencies, especially by the Environmental Protection Agency (EPA). A disturbing tool used to justify an increasing number of costly regulations is something called the social cost of carbon (SCC) that, for regulatory benefit-cost analysis, assigns a dollar cost to every ton of CO2 emitted, which can dramatically tilt the cost-benefit calculus toward more expensive regulation.
The regulatory use of the SCC is disturbing because the method for determining the value of the SCC, despite the seemingly sophisticated process for estimating it, is almost completely arbitrary. It is a classic case of “garbage in, garbage out.” Others have ably pointed out the fundamental and fatal flaws in the damage functions of the computer models used to estimate the SCC.[2] The damage functions are the very core of the models, and the models cannot provide meaningful SCC estimates without theoretically and empirically sound damage functions.[3] In addition, the process appears to have suffered from assumptions that are biased to give exaggerated values of the SCC. However, the EPA (the primary keeper of the SCC) appears to be completely immune to these criticisms.
This paper takes a different approach to show that the SCC estimates are so unstable regarding reasonable changes in assumptions as to make the SCC entirely unsuitable for regulatory policy even if the core damage function were actually legitimate.
Estimating the Social Cost of Carbon
The SCC is a statistic used by several agencies within the federal government to quantify the economic damages associated with carbon dioxide emissions.[4] These metrics are estimated through the use of three integrated assessment models (IAMs)—the Dynamic Integrated Climate-Economy (DICE) model; the Climate Framework for Uncertainty, Negotiation and Distribution (FUND) model; and the Policy Analysis of the Greenhouse Effect (PAGE) model.[5] As with any statistical models, these IAMs depend on a variety of assumptions. In an earlier study, we examined the DICE model and found it to be extremely sensitive to assumptions. As a result of this sensitivity, we have recommended that the DICE model not be used as a source for justifying trillions of dollars of economic regulations.[6]
In this study, we perform a similarly rigorous analysis of the FUND model. Developed by Richard Tol and David Anthoff, the FUND model is another IAM used for estimating the SCC. Just like the other IAMs used by the EPA, the FUND model’s estimates of the SCC are based on Monte Carlo simulations.[7] The EPA reports averages and 95th percentile values over the course of these simulations. As we did with the DICE model, we performed a sensitivity analysis, examining how simple changes to a few fundamental assumptions (in particular, discount rates and equilibrium climate sensitivity distributions) affect these estimates.
Unlike the DICE model, however, the FUND model allows its estimates of the SCC to be negative. We also investigated this negativity. The Interagency Working Group’s (IWG’s) recent report, used for justifying the SCC as a basis for pervasive regulation,[8] glosses over this fact without discussing its implication in detail. Thus, in addition to the above analysis, we also estimate the probability that the SCC can be negative and discuss the resulting implications. Some of these results were presented as a component of a public comment regarding the SCC that we submitted to the Office of Management and Budget (OMB) earlier this year.[9]
An Overview of the FUND Model
In the FUND model, a series of equations and probability densities represent “projections of populations, economic activity and emissions, carbon cycle and climate model responses, and estimates of the monetized welfare impacts of climate change” to estimate the SCC.[10] Each SCC estimate is based on the averaging of 10,000 Monte Carlo iterations based on a number of variables, including different potential values of how much warming a doubling of CO2 will generate. This distribution, known as the equilibrium climate sensitivity (ECS) distribution, statistically models the probability of different temperature increases caused by a doubling of CO2 emissions. The model is estimated over five different scenarios projecting economic growth.
Discount Rate. As discussed in our DICE model analysis, economists often call upon cost-benefit analysis to decide whether an action or rule has net economic benefits.[11] The objective is to use measures of costs and benefits closest to those of the people actually affected by the action.
Due to the fact that people prefer benefits earlier instead of later and costs later instead of earlier, it is necessary to normalize costs and benefits to a common time whenever these costs and benefits occur at different times. For example, few people would accept an offer of $4 per year for the next 25 years in exchange for $100 immediately, in part because there is a risk that the full $100 would not be repaid and in part because there are opportunities to earn a positive return that would repay more than $100 over time. In addition, interest rates (or discount rates) manifest the human desire for benefits now and costs later.
The discount rate is a choice made a priori by the researcher. For example, if a 7 percent discount rate makes people indifferent to a benefit now versus a benefit later (for example, $100 today versus $107 a year from now), then 7 percent is the appropriate discount rate to use.
The OMB has stipulated that government agencies should bound their cost-benefit analyses by using discount rates of 3 percent per year and 7 percent per year.[12] The OMB directive allows the use of additional rates when justified. However, the EPA ignored the OMB’s recommendation and instead used rates of 2.5 percent, 3 percent, and 5 percent per year. We re-estimated the FUND model to regenerate the EPA’s estimates and also to generate estimates using the mandated 7 percent discount rate. Our results are presented in Tables 1 and 2.
Tables 1 and 2 show a number of interesting points. Using the 7 percent discount rate as recommended by the OMB results in an estimated SCC averaging to essentially zero dollars. Thus, under the OMB’s own recommendations, this model suggests that there are no economic damages associated with CO2 emissions.
The average standard deviations are also interesting, quantifying the uncertainty associated with these probability distributions.[13] Although assumptions regarding lower discount rates suggest higher estimates of the SCC than do higher discount rates, the associated standard deviations are, on average, also notably higher. These statistics signify the strong uncertainty associated with the SCC estimates at lower discount rates and, therefore, their lack of reliability.
As a result, these low discount rates result in SCC probability distributions with equally likely (or unlikely) high and low estimates of the SCC. Table 3 shows the average 5th and 95th percentiles, respectively, averaged across all five scenarios.
Under all four discount rates, there is a non-zero probability of negative SCC. The negative SCC would signify a net economic benefit to CO2 emissions (discussed in more detail under the heading “Negativity of the SCC”).
Equilibrium Climate Sensitivity. Although global-warming activists, including President Obama, consistently claim that the science on global warming is settled, anyone who has any familiarity with the scientific process would understand that research is a constant, ongoing process.[14] For instance, one critical component of unsettled science is how much warming will be generated by a given increase in atmospheric CO2 levels. This important (possibly all-important) relationship is called the ECS. The ECS typically gives an expected warming in degrees centigrade for a doubling of atmospheric CO2 levels.
Instead of using a single number, or point estimate, for the ECS, the integrated assessment models use a distribution of possible values for the ECS. In essence, the distribution is a spectrum of values in which potential temperatures are weighted by their probability of occurrence. Because of the myriad factors that affect measured temperatures, estimates of ECS distributions are themselves uncertain and evolve as new data and theory are added to the process.
The IAMs used by the IWG to estimate the SCC are grounded on the specification of such an ECS distribution. Since 2010, the IWG has used an ECS distribution based on an academic paper by Gerard Roe and Marcia Baker published seven years ago.[15] Since then, a number of updated ECS distributions have been estimated, suggesting lower probabilities of extreme global warming.[16]
Further, in the IWG’s original 2013 report,[17] the use of the Roe–Baker distribution in the FUND model was specified incorrectly. After informing them of this misspecification, the EPA corrected the report and opened up the SCC for public comment.[18] We re-estimated the FUND model using two updated ECS distributions from studies in the peer-reviewed academic literature.[19] Tables 5–8 show estimates of the average SCC as well as the average standard deviation across all five scenarios for two more recent choices of ECS distributions compared to the outdated Roe–Baker distribution used by the IWG.
These tables show a number of interesting changes in the SCC. In particular, the average SCC estimate is markedly lower, and sometimes even negative, using these newer ECS distributions. There is also the continued lack of certainty associated with lower discount rates quantified by their high average standard deviations, as was the case with the outdated Roe–Baker distribution.
The IWG reports the overall 95th percentile at the 3 percent discount rate across all three models. The agency uses this statistic to represent an upper threshold on the economic damages associated with CO2 emissions. To illustrate the sensitivity to changes in the ECS distributions, we present both the 5th and 95th percentiles. (See Tables 9 and 10.) These statistics represent the extremities of the distributions modeling the SCC as estimated by the FUND model.
Clearly, the more up-to-date distributions offer vastly different estimates of the SCC. Furthermore, there is more negativity and just as much, if not more, variability of the SCC, especially for the lower discount rates. This variability clearly illustrates the FUND model’s sensitivity to assumptions and resulting unreliability as a meaningful methodology for justifying potentially onerous economic regulations.
Negativity of the SCC. As mentioned, of the three statistical models the EPA uses to estimate the SCC, only the FUND model allows the SCC to be negative. We noticed that the 5th percentiles of the SCC indicate negative estimates of the SCC. A worthwhile exercise for such models is to estimate the probability of a negative SCC. These estimates are given in Tables 11, 12, and 13, averaging across all five of the model’s economic growth scenarios:

All of these probabilities are non-zero. In fact, for the 7 percent discount rate recommended by the OMB, the chance for a negative SCC is nearly 70 percent for 2020. If one were to take these results seriously, they would suggest that CO2 emissions are likely to yield a net benefit. Using the 7 percent discount rate required by the OMB and using the more recent ECS distributions, the FUND model indicates that there is a nearly 70 percent chance that, in addition to their costly compliance burden, climate policies will create economic damage in the future.
The policy prescription implied by negative values of the SCC would be to subsidize CO2 emissions. We do not take such a position here, but merely present these results to illustrate how unsuitable for regulatory purposes a statistical model is that suggests both positive and negative economic affects of global warming.
Charts 1–6 are histograms illustrating the wide range of estimates that the FUND model’s estimates of the SCC can take on for 2020 based on one of the model’s five different economic growth scenarios.[20]
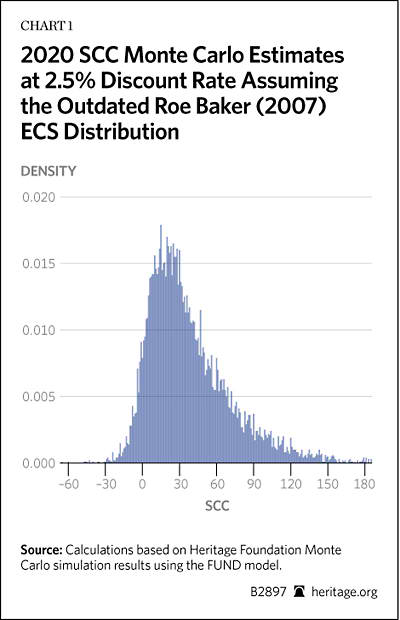
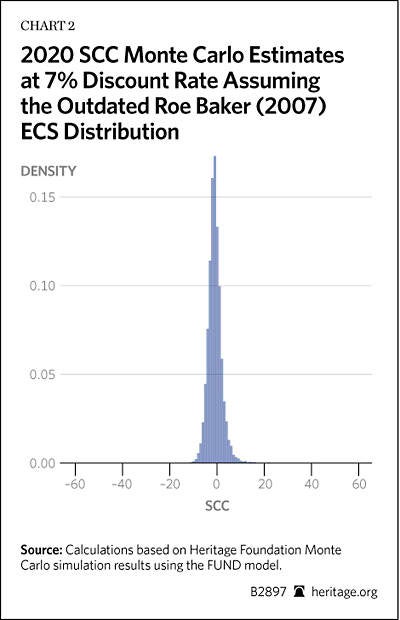
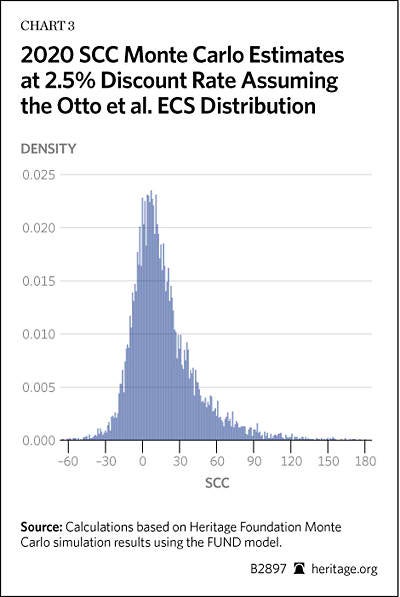
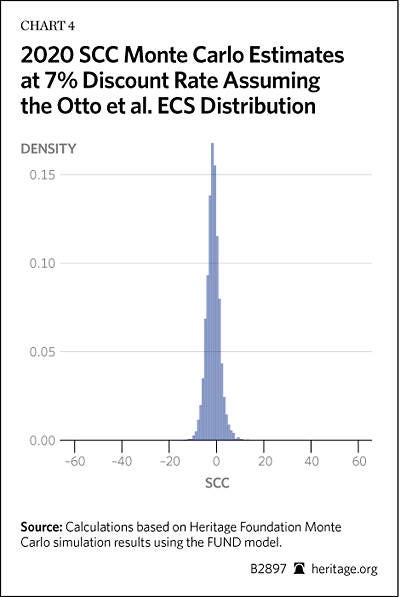
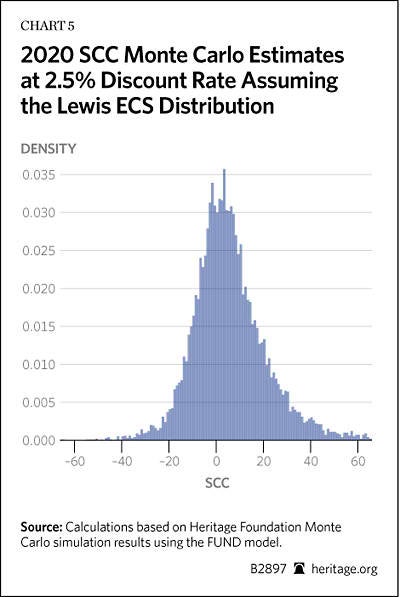
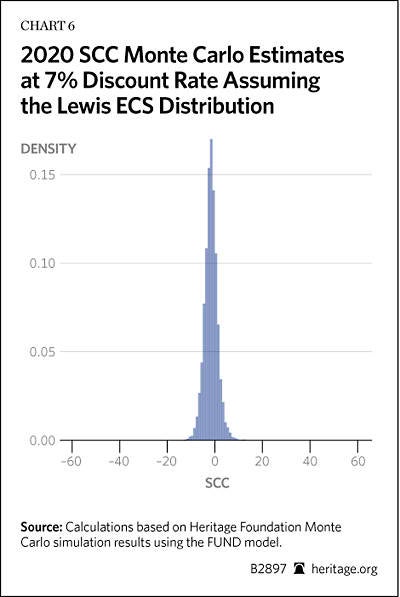
These probability distributions illustrate a number of important aspects regarding the SCC. In particular, for the low 2.5 percent discount rates, Charts 1, 3, and 5 illustrate the great uncertainty associated with such a model. The distributions are greatly spread out and have notable components of their probability mass around zero. Additionally, when compared across different assumptions regarding discount rates as well as equilibrium climate sensitivity, these probability distributions clearly illustrate how the SCC estimates are scattered all over the map with the overall distributions changing markedly after tweaking of the model’s most fundamental assumptions.
Using a model with such uncertainty is a flawed way of devising policy to justify trillions of dollars of economic regulations. Table 14 shows how much the average estimates of the SCC change as a result of simple alterations in ECS distributions and discount rates.
Conclusion
As with any statistical model, IAMs are grounded in assumptions that researchers make. As illustrated here, the FUND model is extremely sensitive to many assumptions. Altering the discount rate to 7 percent as recommended by the OMB and employing more recent peer-reviewed ECS distributions delivers drastically lower estimates of the SCC. Furthermore, changes in the assumptions suggest large probabilities of a negative SCC. Other potential changes, such as altering the end year to something less than the model’s unrealistically distant projections of economic damages (which extend nearly 300 years into the future) as well as alterations to the model’s loss function, have the potential to change the model’s results drastically.[21]
As a result of this sensitivity we conclude, as we did with the DICE model, that the FUND model, although an interesting academic exercise, is at least at this point completely unfit as a tool to justify trillions of dollars of economic regulations.[22]
—Kevin D. Dayaratna is Research Programmer and Policy Analyst, and David W. Kreutzer, PhD, is a Research Fellow for Energy Economics and Climate Change, in the Center for Data Analysis at The Heritage Foundation. The authors would like to thank Pat Michaels and Chip Knappenberger of the Cato Institute for their assistance with this study.


