
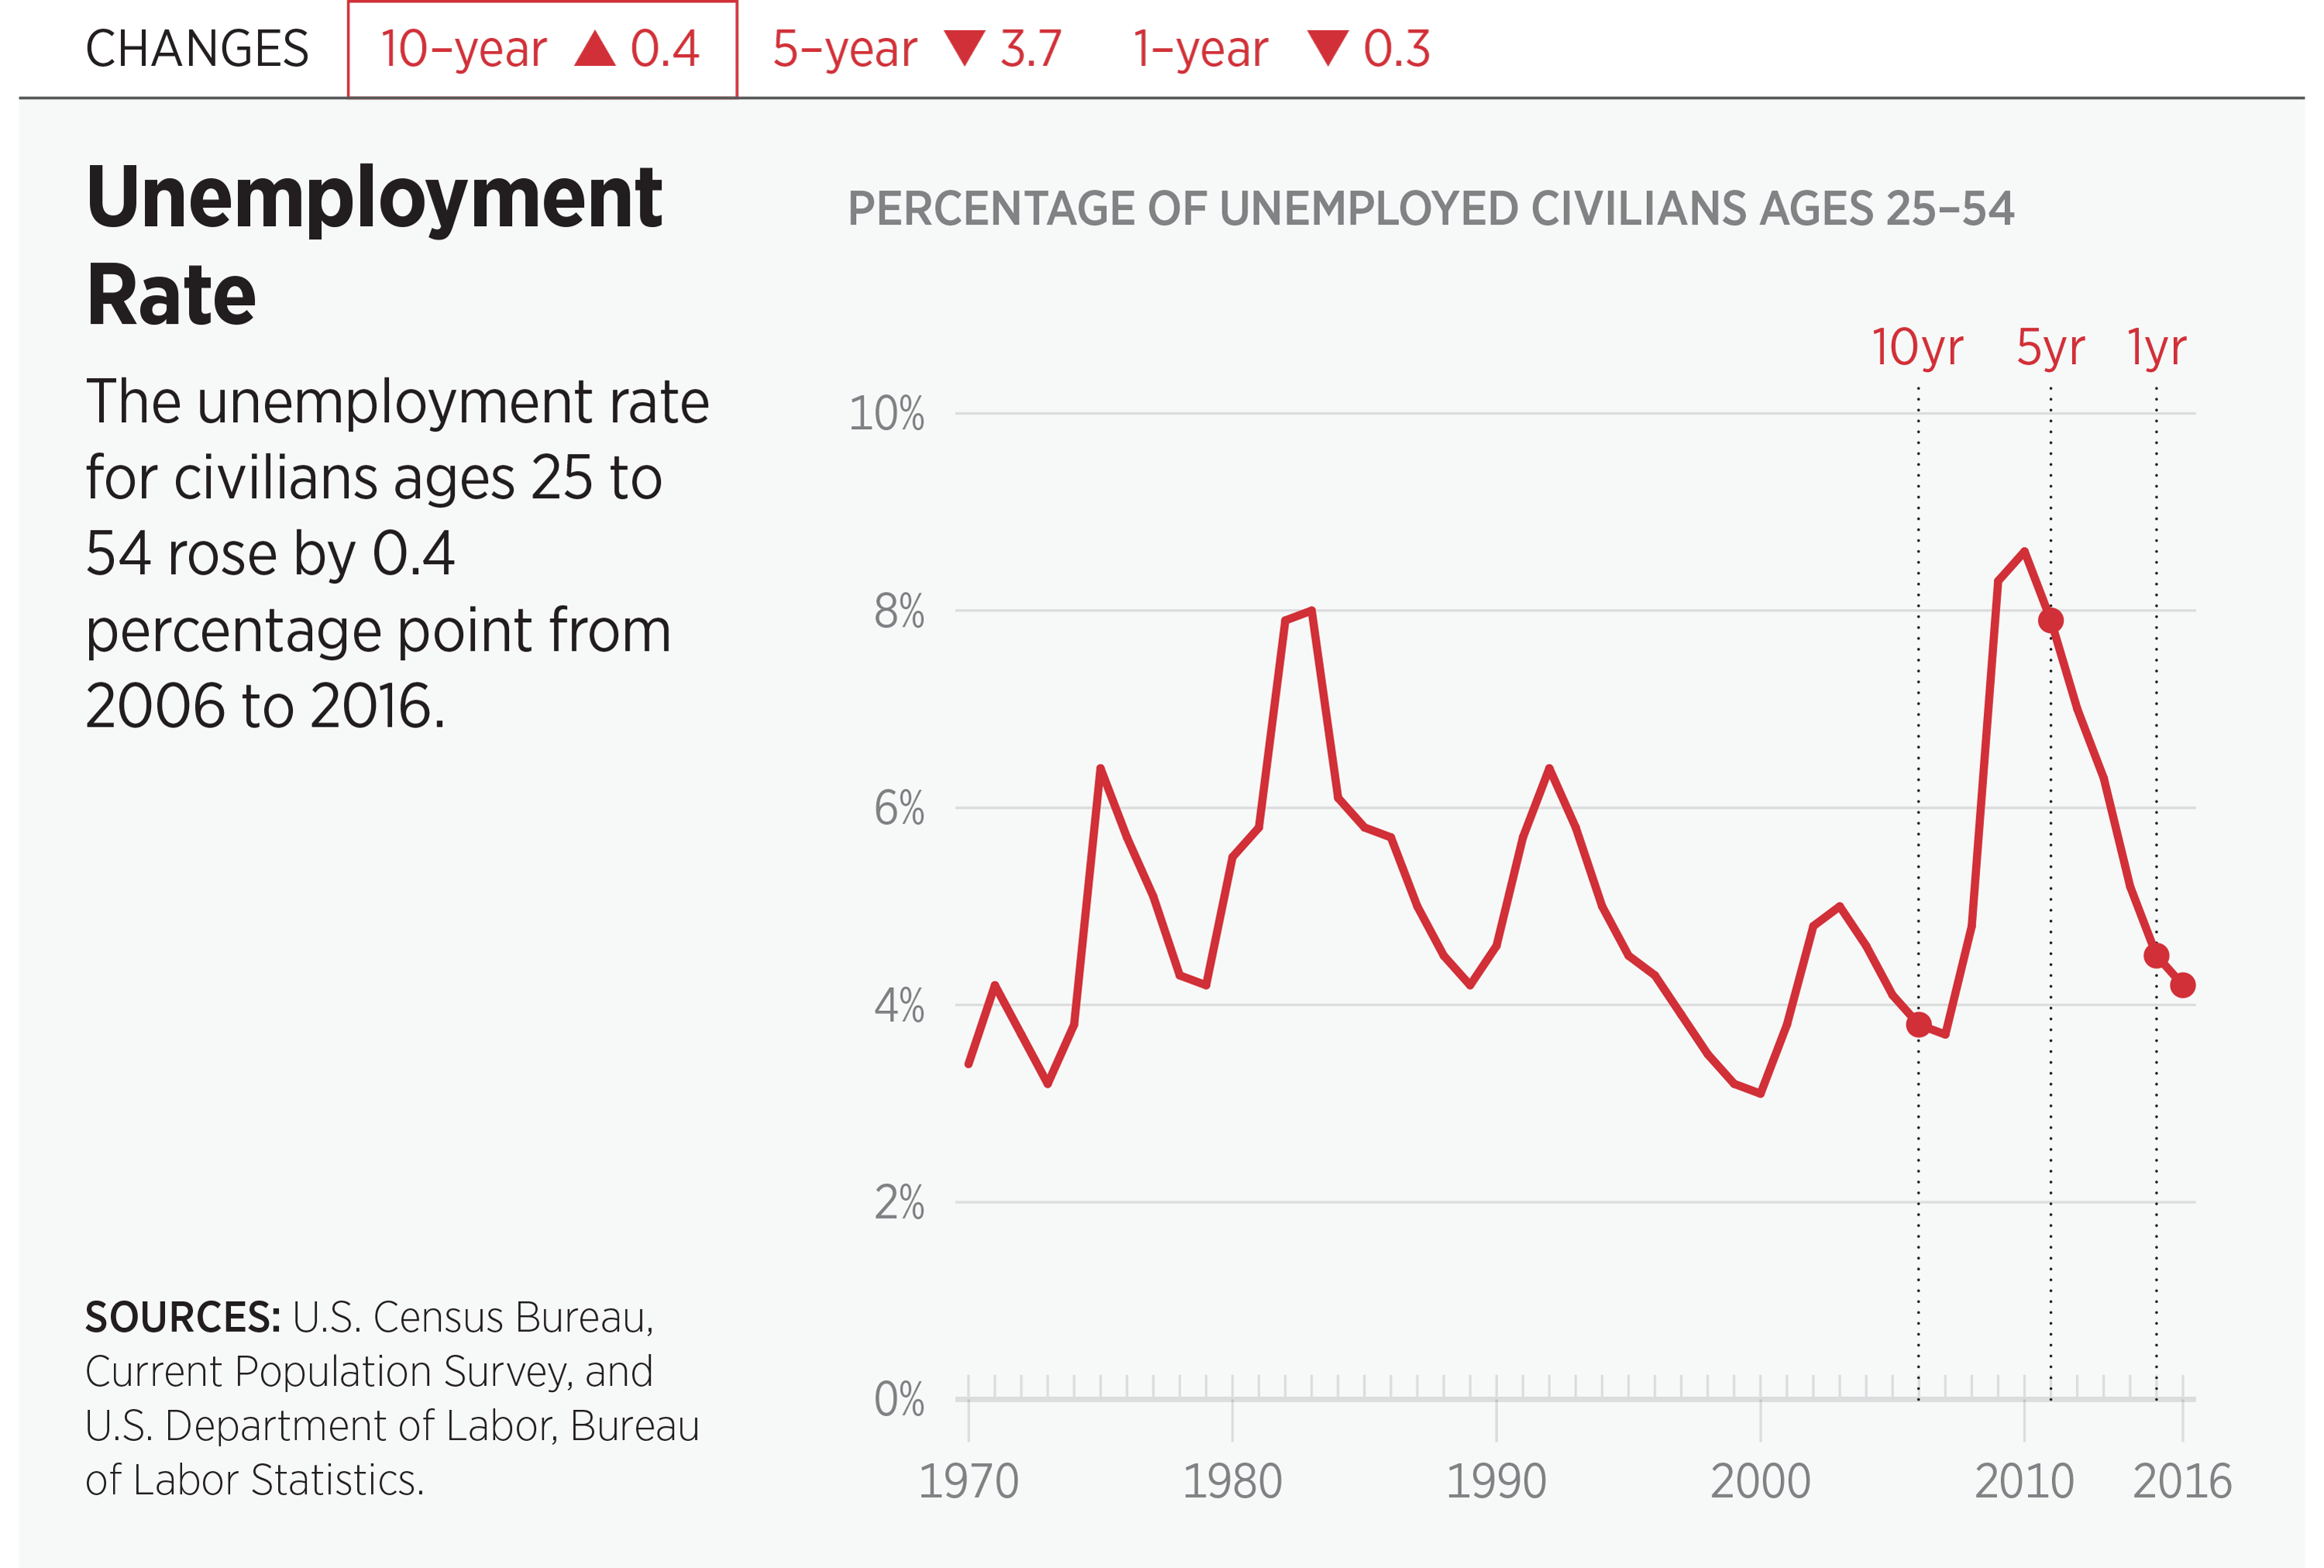
According to the topline unemployment rate, the labor market is doing fairly well. At 4.2 percent, unemployment among individuals 25–54 years old is near its “natural” rate.1 But the unemployment rate does not reveal the millions of people who have dropped out of the labor force, stopped looking for work, or turned to disability insurance as an unemployment or early retirement program.
Consequently, the labor force participation rate (LFPR)—at only 62.8 percent—is 3.4 percentage points lower than it was 10 years ago,2 and 2.2 million more 25-year-olds to 54-year-olds are not participating in the labor force.3 According to the Congressional Budget Office (CBO), if unemployment were at its natural level and labor force participation were at its full potential, there would have been 2.2 million more workers in the first quarter of 2016.
Demographic changes such as the aging and retirement of the baby boomers affect the LFPR, but studies by The Heritage Foundation and the Federal Reserve Bank of Chicago have found that demographic changes accounted for only about one-quarter of the recent decline in labor force participation.4 The remainder stems largely from subpar economic conditions and government policies that together have made it harder to find desirable employment and easier to substitute government benefits for employment.
Although there has been no rise in disability or illness, separate economic studies published by the Manhattan Institute and The Heritage Foundation have found that rising disability insurance claims accounted for about one-third of the decline in labor force participation following the recent recession.5 New and more generous government benefits (such as Obamacare subsidies) have made it easier for people to receive the income and resources they need with less work or even no work at all. Moreover, these benefits result in higher marginal taxes that discourage the already employed from working and earning more.
The CBO has cautioned that higher government debt and higher marginal tax rates (which the CBO projects will increase by 10 percent over the next 30 years) will reduce labor force participation rates and incomes.6 However, the employment situation is not all gloom and doom.
Important gains continue for women, and increasing levels of education and growth in sharing-economy jobs offer hope for the future. Women are now more likely than men to obtain a college degree and increasingly likely to have careers as opposed to just jobs, and their earnings (adjusted for factors such as education, occupation, and experience) are near parity with men’s.7
In addition, while the rise in numbers of young people attending school stems largely from lackluster employment prospects, a more educated workforce leads to higher earnings and economic output.
Finally, although efforts to thwart the growth in sharing-economy jobs (such as Uber and Airbnb) threaten their potential, these jobs provide huge opportunities to meet workers’ demands for flexible work and additional income.8
Despite great potential, government policies—including rising deficits and debt, regulations that impede employment opportunities and earnings growth, increased welfare and transfer benefits that make it easier not to work, and rising marginal tax rates—are holding back employment. A vibrant labor market is a key component of social and economic well-being, and the government should seek to implement policies that promote work opportunities and full employment.
Rachel Greszler is Research Fellow in Economics, Budget, and Entitlements in the Thomas A. Roe Institute for Economic Policy Studies, of the Institute for Economic Freedom, at The Heritage Foundation.
ENDNOTES:
1. Federal Reserve Bank of St. Louis, “Natural Rate of Unemployment (Long-Term),” updated January 25, 2017, https://fred.stlouisfed.org/series/NROU (accessed April 6, 2017).
2. U.S. Department of Labor, Bureau of Labor Statistics, “Civilian Labor Force Participation Rate, 16 Years and over,” https://data.bls.gov/pdq/querytool.jsp?survey=ln (accessed May 15, 2017).
3. U.S. Department of Labor, Bureau of Labor Statistics, ”Civilian Labor Force Participation Rate, Ages 25–54,” and “Civilian Population Ages 25–54,” https://data.bls.gov/pdq/querytool.jsp?survey=ln (accessed May 15, 2017). The number of individuals ages 25–54 who are not in the labor force increased by 2.195 million from 2006 to 2016. Given the population increase of 877,000 among individuals 25–54 years old over that period, the number not in the labor force would have increased by only 296,000—instead of 2.195 million—if labor force participation had remained at 66.2 percent.
4. James Sherk, “Not Looking for Work: Why Labor Force Participation Has Fallen During the Recovery,” Heritage Foundation Backgrounder No. 2722, revised and updated September 4, 2014, http://static.heritage.org/2014/pdf/BG2722_2014.pdf; Daniel Aaronson, Jonathan Davis, and Luojia Hu, ”Explaining the Decline in the U.S. Labor Force Participation Rate,” Federal Reserve Bank of Chicago Essays on Issues No. 296, March 2012, http://www.chicagofed.org/digital_assets/publications/chicago_fed_letter/2012/cflmarch2012 (accessed May 15, 2017).
5. Sherk, “Not Looking for Work: Why Labor Force Participation Has Fallen During the Recovery”; Scott Winship, testimony in hearing, What Lower Labor Force Participation Rates Tell Us About Work Opportunities and Incentives, Joint Economic Committee, U.S. Congress, July 15, 2015, https://www.jec.senate.gov/public/_cache/files/c7145fe1-c2e8-4bc4-af57-a43dfcef6001/jec-testimony-winship.pdf (accessed April 28, 2017).
6. Congressional Budget Office, The 2017 Long-Term Budget Outlook, March 2017, https://www.cbo.gov/system/files/115th-congress-2017-2018/reports/52480-ltbo.pdf (accessed June 8, 2017).
7. CONSAD Research Corporation, An Analysis of the Reasons for the Disparity in Wages Between Men and Women: Final Report, prepared for U.S. Department of Labor, Employment Standards Division, January 12, 2009, https://www.shrm.org/hr-today/public-policy/hr-public-policy-issues/Documents/Gender%20Wage%20Gap%20Final%20Report.pdf (accessed April 28, 2017); Joint Economic Committee, U.S. Congress, “Not Your Mother’s Labor Market,” May 9, 2016, https://www.jec.senate.gov/public/index.cfm/republicans/2016/5/not-your-mother-s-labor-market (accessed April 28, 2017).
8. A recent economic study reported that over 1 million individuals have signed up as Uber drivers. The study valued the unparalleled flexibility of drivers to set their own work schedule at a benefit of $150 per week. See M. Keith Chen, Judith A. Chevalier, Peter E. Rossi, and Emily Oehlsen, “The Value of Flexible Work: Evidence from Uber Drivers,” National Bureau of Economic Research Working Paper No. 23296, March 2017, http://www.nber.org/papers/w23296 (accessed April 7, 2017).