
As the 107th Congress moves closer to completing the fiscal year 2003 budget, a disturbing pattern of budgetary recklessness is emerging. If current estimates hold, the 2000-2003 period will prove to be one of the highest-spending four-year periods in American history -- well above the previous 1996-1999 and 1992-1995 periods.1 In fact, from 2000 to 2003:2
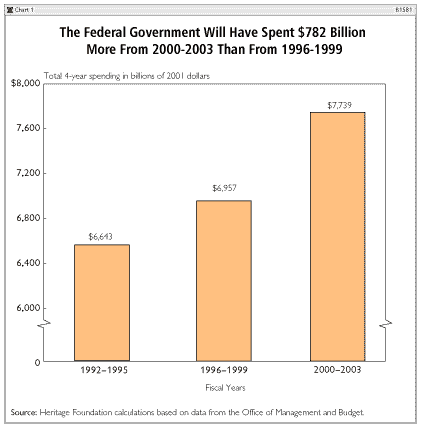
- The federal government will spend $782 billion more than it did during the previous four years -- the largest four-year increase since the 1984-1987 period (in 2001 dollars adjusted for inflation);
- The four-year cost of the federal government will be over $73,000 per household -- a total surpassed only at the height of World War II -- and over $5,000 per household more than during the previous four years;
- For the first time since President Lyndon Johnson's Great Society initiative expanded entitlement programs over 30 years ago, discretionary spending programs will receive even larger increases over a four-year span than those bloated entitlement programs will;
- These colossal spending increases are occurring despite the plummeting of net interest payments by $247 billion over those four years; and
- This rapid expansion of the federal government is causing higher taxes and lower economic growth, and consequently costing jobs and reducing incomes.3
Washington's Spending Spree: $5,006 More Per Household
Substantial increases in federal spending since 2000 have made the reasonably responsible budgets of the late 1990s seem like a distant memory. Congress and the President will spend $782 billion more from 2000-2003 than they did from 1996-1999. (See Chart 1.) These spending increases will cost the average household an additional $5,006 in taxes. (See Chart 2.)
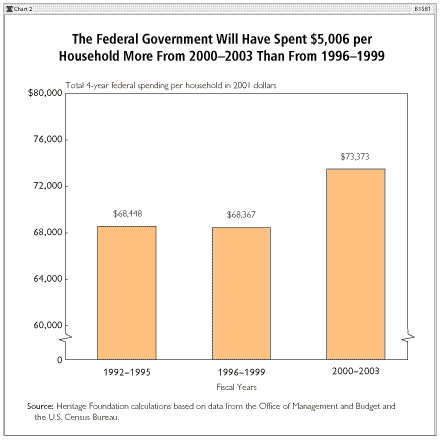
Rarely has the federal government expanded this quickly. Chart 2 also shows that federal spending per household from 1996-1999 was actually $80 lower than it had been during the previous four years, as the Republican takeover of Congress symbolized a national backlash against activist government. Even from 1992-1995, a time of considerable government activism, federal spending was just $2,187 per household higher than it was the previous four years. Not since 1984-1987 has federal spending per household grown faster than the current rate.
Table 1 shows that this increase per household will raise the total four-year cost of the federal government to a staggering $73,373 per household -- again, a level surpassed only during the height of World War II.

Where Is It All Going?
Despite the allure of the easy answer, these spending increases are not the result of a process by which Congress and the President carefully assessed the nation's needs and then decided that one or two vital national priorities were worth $782 billion in additional funding. To the contrary, they are a classic case of death by a thousand blows -- record spending increases for dozens of medium-sized programs across several departments, none by itself fatal but collectively all lethal. These scattered spending hikes are the predictable result of the inability of undisciplined policymakers to set priorities and say no to special interests.
Certainly, some spending has resulted from truly unanticipated emergencies. The September 11 attacks necessitated a defense buildup well above the peacetime levels of the late 1990s. (See Chart 3.) However, the $166 billion total increase in defense spending from 2000-2003 represents just 21 percent of the $782 billion total spending increase, and less than 25 percent of that defense spending increase can be directly attributed to the war on terrorism. While it is easy to blame legitimate national defense spending for Washington's recent spending spree, the 2000-2003 period still would represent the largest four-year per-household spending hike in 15 years even if defense spending had not risen at all.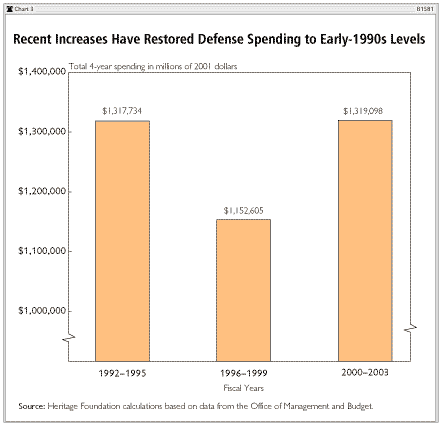
Table 2 shows the program categories that comprise the largest proportion of the four-year spending surge. Not surprisingly, Social Security retains its status as the federal government's most expensive program, with the largest spending increase ($173 billion). The expensive health care entitlement programs, Medicare and Medicaid, also continue their historical record of receiving large spending increases (with Medicaid growing by a much larger percentage). The category of "various income security programs," which includes such programs as Supplemental Security Income (SSI), Temporary Assistance for Needy Families (TANF), and payments from the refundable Earned Income Tax Credit (EITC), also receives substantially more money in 2000-2003 than it did from 1996-1999.
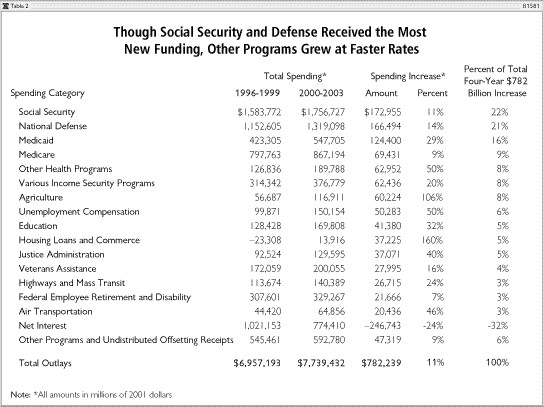
Although these major entitlements together received over half of the $782 billion spending increase, they have been growing at roughly constant rates over the past 15 years, so their growth in funding does not sufficiently explain why recent spending increases are any larger than those of the 1990s. The 2000-2003 binge differentiates itself from past periods by spending enormous sums on traditionally low-cost programs, such as:
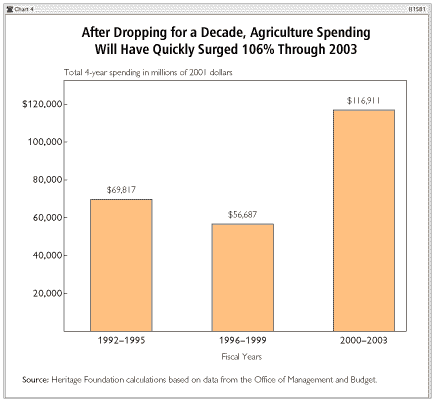
- Agriculture. After reaching $79 billion from 1988-1991, farm subsidies dropped to $70 billion from 1992-1995 and $57 billion for the four years following the 1996 "Freedom to Farm" reforms.4 Unfortunately, Congress overreacted to a slight dip in crop prices by passing a series of massive "emergency" payments, bringing farm subsidies to $117 billion for the period of 2000-2003. (See Chart 4.) These spending increases culminated in the budget-busting 2002 farm bill, which was designed to lock in these high farm subsidy levels permanently.5
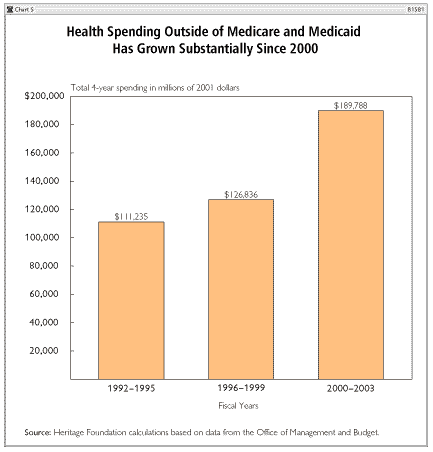
- Health Programs (Other than Medicare and Medicaid). While Medicare and Medicaid receive the most attention from health budget experts, Chart 5 shows the rest of the health budget growing from $127 billion during the period from 1996-1999 to $190 billion from 2000-2003. The doubling of the National Institutes of Health budget accounts for $25 billion of this increase, while the new State Children's Health Insurance Program (S-CHIP) will have spent $13 billion. Other contributors to the expanding health budget include homeland security-related bioterrorism research and subsidies to health service providers.
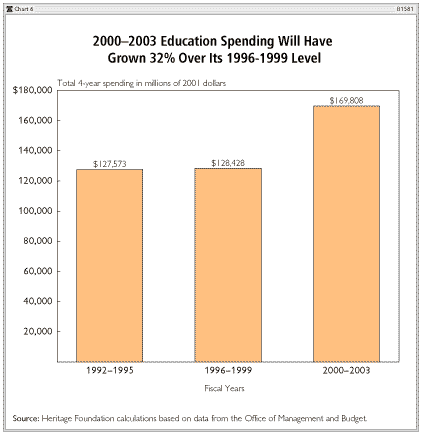
- Education. Despite a lack of persuasive evidence linking educational achievement to school funding, Chart 6 shows federal education funding expanding from the 1996-1999 sum of $128 billion to the 2000-2003 sum of $170 billion. This increase is spread across several areas, including Title I grants for disadvantaged children, special education grants, college student financial aid, and dozens of smaller grant programs. The Leave No Child Behind Act signed by President Bush in January 2002 authorizes additional education funding increases each year through 2007.6
- Unemployment Compensation. As the most economically sensitive entitlement program, unemployment compensation payments will increase from the $100 billion level during the booming 1996-1999 period to $150 billion during the comparatively sluggish 2000-2003 period. (See Chart 7.) Of that $150 billion, $139 billion in unemployment compensation expenditures is occurring automatically without congressional involvement as the pool of unemployed workers signing up for benefits expands. The 2002 economic stimulus bill provided the other $11 billion through a measure extending benefits for 13 additional weeks to those whose 26-week benefit limit had expired.7
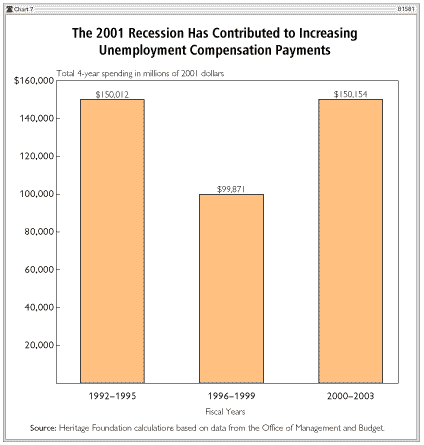
Policymakers often reject blame for rising unemployment expenditures because they did not anticipate the recession and most of the resulting new spending occurred automatically without their intervention. But while those expenditures were unforeseen and mostly inevitable, policymakers set themselves up for this budgetary crisis by overspending on other programs and leaving little room to fund any unanticipated needs comfortably down the road.
Historic spending increases also have been provided to air transportation, highway and mass transit assistance, and the Department of Justice.8
Squandering the "Interest Dividend"
Notably absent from this description of expanding federal spending is interest on the national debt. The most disappointing aspect of the 2000-2003 spending surge is that it is occurring at a time when interest payments will have dropped by $247 billion as a result of the balanced budgets of the late 1990s. Starting out with such an automatic and painless $247 billion spending cut means that budget cutters had the wind at their back for the first time in nearly 50 years.
In the same manner that they wasted the postCold War "peace dividend" with new spending, however, Chart 8 shows Congress and the President squandering this once-in-a-lifetime "interest dividend" with $1.029 trillion in new spending elsewhere in the budget, causing a net increase of $782 billion.
Failing to Reform Entitlements
When examining the $782 billion in new spending, some argue that policymakers should be held accountable only for the increases in discretionary programs, not those in the entitlement programs. They point out that discretionary programs such as national defense have their budgets set each year by Congress and the President, who can trim back any programs with rising costs or declining value.9 Unlike discretionary programs, entitlement programs such as Social Security do not have spending totals set annually. Rather, policymakers decide who is eligible for a program and what the benefit formula will be. For the next several years, total spending is determined by how many eligible individuals enroll in the program and where they fit in the benefit formula.10 Therefore, the argument continues, Congress and the President are responsible for the discretionary spending levels that are set annually, but not for spending on entitlement programs created decades ago and running on autopilot.
There are two problems with this argument. First, requirements that most entitlement programs be rewritten and renewed approximately every three to six years provide Congress and the President sufficient opportunity to trim back their spending levels. Policymakers who added an 80 percent funding increase to the 2002 renewal of farm subsidies should not be let off the hook simply because farm subsidies are classified as entitlements instead of discretionary spending.
Second, policymakers need not even wait for an entitlement program's renewal date to reduce its spending. In its annual budget resolutions, Congress can attach "reconciliation" instructions to go back and reduce entitlement spending. Despite out-of-control spending, neither the House nor the Senate included any reconciliation instructions in its fiscal year 2003 budget resolution.11 This endorsement of current entitlement spending levels earns current policymakers a share of the blame for the programs of their predecessors.
Discretionary Spending Powers increase
Even restricting this analysis to discretionary spending alone does not make policymakers appear any more fiscally responsible. Of the $782 billion in new spending from 2000-2003, $424 billion comes from discretionary programs, while $358 billion comes from entitlement programs -- thus marking the first four-year period since 1967-1970 that new discretionary spending will exceed new entitlement spending. (See Chart 9.)
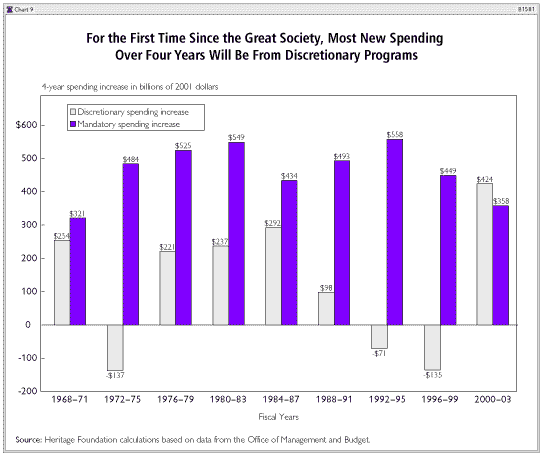
This remarkable development cannot be overstated: For the past 30 years, as entitlement costs soared uncontrollably, not even Washington's biggest spenders allowed their discretionary budgets to grow faster than entitlements over an entire four-year period. That is, until now.
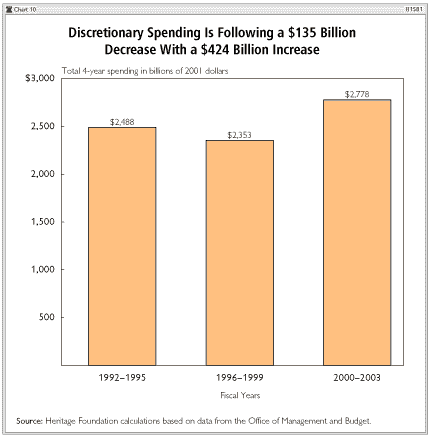
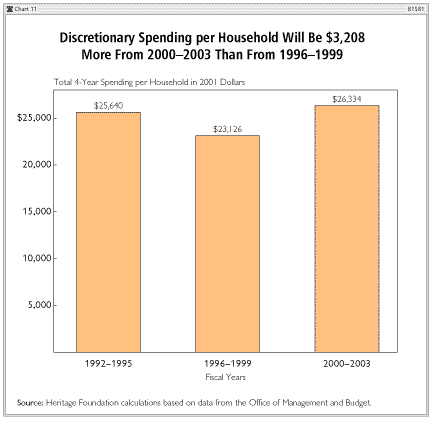
How could discretionary programs, which total just one-third of the federal budget, provide 54 percent of all new spending? Simply by growing 18 percent over 1996-1999 levels, a rate that dwarfs the 8 percent increase in entitlement spending. This increase raised the 2000-2003 total cost of discretionary spending to $26,334 per household -- $3,207 above the 1996-1999 level. (See Chart 10 and Chart 11.)
Although defense spending typically encompasses half of all discretionary spending, even the $164 billion defense increase partially brought on by the war on terrorism cannot match the $260 billion increase in non-defense discretionary spending. Many of the spending categories in Table 1 that were responsible for the overall growth of government -- such as education, health, justice, air transportation, and highway/transit assistance -- are contributing heavily to the discretionary increases.
Few Programs excluded From Spending Spree
Proponents of big government have spent the past four years demanding that Congress and the President substantially increase spending on America's "most urgent" national priority. But what has been this most urgent national priority? Some have said education; others, health research. Still others have said farm subsidies, the war on terrorism, or homeland security. Had policymakers settled on funding one or two of the most important priorities (preferably those for which federal funding actually makes a significant difference), the federal budget would have remained somewhat under control.
But instead of making those difficult but responsible decisions, Congress and the President are simply throwing vast sums of money at all of these categories of programs. The result: an unaffordable "guns and butter" budget.
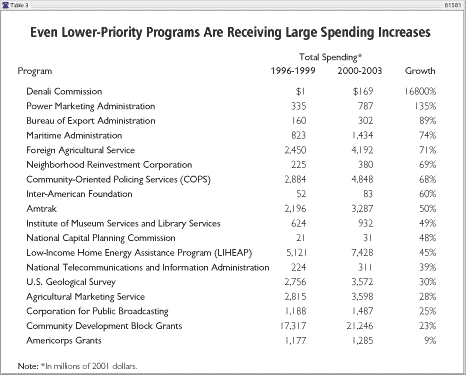
It would be a mistake to assume that Washington spenders are making any distinction between the necessities and unaffordable luxuries. Congress and the President have not even said no to the lower-priority programs in Table 3.
The Consequences Of Unrestrained Spending
Increased government spending has weighed down even further an already sluggish economy and imposed taxes that hinder working families' ability to make ends meet. Growing economies require a base level of government spending on defense and justice to enforce the property rights and rule of law necessary for markets to function. Government facilitation of trade through the provision of roads and other public goods that are difficult for the private sector to provide also boosts economic growth.
Despite the outdated fallacy that government spending stimulates the economy, beyond this basic level, it impedes economic growth for three reasons:12
- Diminishing Effectiveness. Governments often begin their spending on such necessities as defense, law enforcement, and basic public goods. Empowered by the economic growth these services provide, they mistakenly conclude that they can solve any problem. Consequently, they tend to expand their efforts into services that the market is better equipped to provide, such as education, housing, food, and pensions. With each expansion, the government not only blocks the market from functioning, but also becomes less and less effective itself, until it ultimately becomes a barrier to economic growth.
- Politics. Markets use the profit motive to ensure that resources will be allocated efficiently. Businesses seeking profits must consistently respond to consumer demand with quality products at low prices. Governments, by contrast, are monopolies with no real profit motive or incentive to spend money efficiently, so policymakers make re-election their "profit" and consequently allocate resources to even the most wasteful programs that can help ensure their return to office. While innovation and evolving with the changing times are required for businesses to survive, they represent an unnecessary risk for politicians who are guaranteed re-election as long as they do not interrupt the flow of government funds to their districts. The result: While markets helped the Model T evolve into the Porsche and the Apple IIe into supercomputers, the federal government continues to run many of the same obsolete federal agencies it established as far back as the 1800s.
- High Taxes. Increased government spending makes it difficult for working families to make ends meet. Even when the government funds itself by borrowing money, higher taxes will eventually be needed to repay those loans. Had the federal government simply allowed inflation-adjusted spending to remain at its 1996-1999 levels for the following four years, the average household would have $5,006 more to spend on necessities such as health insurance, retirement, housing, or their child's education. Regrettably, those who praise all the items government buys with these tax dollars often ignore these items that are no longer affordable for most overtaxed families.13
In addition to their high cost, taxes hurt the economy by distorting incentives. Families and businesses work, save, and invest because they expect a financial reward. These productive behaviors also make the rest of the nation wealthier by creating additional economic activity. But burdensome tax rates reduce the financial reward for being productive. Consequently, families and businesses cut back their productive behavior to escape taxes, and the entire economy falters.
Current federal expenditures are well beyond the threshold of economic harm. The Joint Economic Committee estimates that from 1801-1996, economic growth was maximized when federal spending equaled 13.4 percent of gross domestic product (GDP), which would equal $1.4 trillion in 2001.14 In 2001, however, the federal government spent 19.1 percent of GDP, or $2 trillion. The resulting decrease in economic growth has had the real effects of costing jobs, lowering incomes, and increasing poverty. What is needed instead is fiscal discipline.
Conclusion
Since 2000, massive spending increases have been added gradually to a diverse group of federal programs, ranging from farm subsidies to education and health care. Without any priority setting or spending discipline among federal policymakers, these increases are estimated to total $782 billion from 2000-2003, costing the average household $5,006 in higher taxes. Unless Congress and the President make a concerted effort to address runaway spending, families will continue to have difficulty making ends meet, and the economy will struggle under the suffocating weight of an ever-expanding federal government.
Brian M. Riedl is Grover M. Hermann Fellow in Federal Budgetary Affairs in the Thomas A. Roe Institute for Economic Policy Studies at The Heritage Foundation.
;)
;)
;)
;)
;)
;)
;)
;)
;)
;)
;)
;)
;)


