
Abstract: Achievement disparities among racial and ethnic groups persist in the American education system. Asian and white students consistently perform better on standardized tests than Hispanic and black students. While many commentators blame the achievement gap on alleged disparities in school funding, this Heritage Foundation paper demonstrates that public education spending per pupil is broadly similar across racial and ethnic groups. To the extent that funding differences exist at all, they tend to slightly favor lower-performing groups, especially blacks. Since unequal funding for minority students is largely a myth, it cannot be a valid explanation for racial and ethnic differences in school achievement, and there is little evidence that increasing public spending will close the gaps.
In 2009, white public school eighth-graders outscored their black classmates by one standard deviation (equivalent to roughly two and a half years of learning) on the math portion of the National Assessment of Educational Progress (NAEP) test.[1] Racial differences in achievement like this one are pervasive in the U.S. education system, and the gaps have persisted for decades.
The Program for International Student Assessment (PISA), a standardized test battery given to 15-year-olds in all 34 OECD[2] countries, puts the gaps in stark terms. If white American students were counted as a separate group, their PISA reading score would rank them third in the world. Hispanic and black Americans, however, would score 31st and 33rd, respectively.[3]
Blaming “Unequal Funding.” A common hypothesis is that Hispanic and black students perform worse in school because less money is spent on them. In 1995, Columbia University’s Linda Darling-Hammond claimed, “The resources devoted to the education of poor children and children of color in the U.S. continue to be significantly less than those devoted to other American children…and it is these inequalities that create and sustain the ‘bell curve’ of differential achievement.”[4]
Part of the NAACP’s official statement on education policy reads: “Quality public education for African American and Latino students is persistently threatened as a direct result of inequitable school funding.”[5]
Responding in 2001 to criticism that blacks and Hispanics perform poorly on the SAT, College Board President Gaston Caperton declared, “Tests are not the problem…. The problem we have is an unfair education system in America—an unequal education system.”[6]
Even conservative author John McWhorter, while downplaying structural and institutional explanations for the racial achievement gap, still asserts that the alleged funding disadvantage for black students “is a real one.”[7]
These commentators are mistaken on two levels. First, increasing school spending has rarely led to better outcomes.[8] Second, and more fundamentally, based on data from the U.S. Department of Education itself, the assumed funding disparities between racial and ethnic groups do not exist.
Existing Literature. Past research on educational resource disparities has often avoided direct calculations of per-pupil spending. Darling-Hammond, for example, has written extensively on specific inputs, particularly teacher certifications, that tend to be lower in schools with large minority populations. But deficiencies in certain resources do not necessarily indicate an overall disparity. Other analysts, such as Jonathan Kozol, have explored case studies of poorly funded minority schools, but the limited set of examples are not representative of the national picture.[9]
The Education Trust, a non-profit advocacy group committed to closing the achievement gap, published a 2005 report on funding differences between the highest-minority and lowest-minority school districts in states and large cities.[10] Leaving out the districts in the middle, however, can lead to misleading results.
One of the more rigorous reports on funding disparities was published by the Urban Institute.[11] The authors of the study combined district-level spending data with the racial and ethnic composition of schools within districts. They found that spending on minority students eclipsed spending on white students in the early 1980s and remained slightly higher through 2002, the most recent year in their study.
This paper employs a similar methodology, using 2006–2007 datasets from the U.S. Department of Education to examine school funding at both the national and regional levels. In addition, the paper adjusts spending figures to account for cost-of-living differences across districts.
Data and Methods
This paper uses two datasets published by the Department of Education’s National Center for Education Statistics (NCES). The Secondary School Universe Survey for the 2006–2007 school year provides the racial and ethnic breakdown of schools across the nation;[12] the Financial Survey for the 2006–2007 school year contains detailed expenditure and revenue data for public school districts.[13] Merging these two datasets allows expenditures to be weighted by the racial composition of each district, creating per-pupil expenditures for each group.
Specific Procedure. In each district, the number of white students is multiplied by per-pupil spending to generate the total spending on white students, district by district. The district totals are summed to create a national grand total of spending on white students. That grand total is then divided by the total number of white students across the country, producing the national per-pupil figure for white students. The same procedure is repeated for each racial and ethnic group.

Mathematically, the calculation is shown above.
District Level vs. School Level. Ideally, the NCES would provide expenditures on a school-by-school basis, not just on a district-by-district basis, so that the spending data would have the same level of precision as the racial and ethnic data. But given the district-only limitation, students are assigned the per-pupil spending level of their district as a whole, rather than the per-pupil spending in their individual schools. The “Discussion” section below explores how this might affect the analysis.
Cost-of-Living Adjustment. Because the cost of living varies across the U.S., school expenditures are not always directly comparable. In areas with a lower cost of living, the same amount of money can buy more resources than in high-cost areas. To account for this difference, the NCES calculates a Comparable Wage Index (CWI) for each school district based on the average non-teacher wage in the district’s labor market.[14] If non-teacher wages are high in a given market, the NCES assumes it has a high cost of living. The NCES excludes teacher wages from the CWI calculation to avoid confusing a district’s commitment to education funding with general cost-of-living differences.
Cost adjustments should be regarded cautiously. Living expenses can still vary within markets, sometimes considerably. The District of Columbia, for example, is a high-expense city overall, but its poorest (and mostly black and Hispanic) sections have a lower cost of living than the white sections. While the raw data are likely to overstate the minority school funding advantage, the adjusted data probably understate it. Nevertheless, the CWI is the best dataset currently available for making cost adjustments.
Results
Table 1 displays three columns of results. The first shows the raw per-pupil spending figures for whites, blacks, Hispanics, and Asians. The second column shows per-pupil spending on white students. The third column adjusts this percentage with the CWI to reflect differences in the cost of living. All three data points for each group are then broken down by census region.
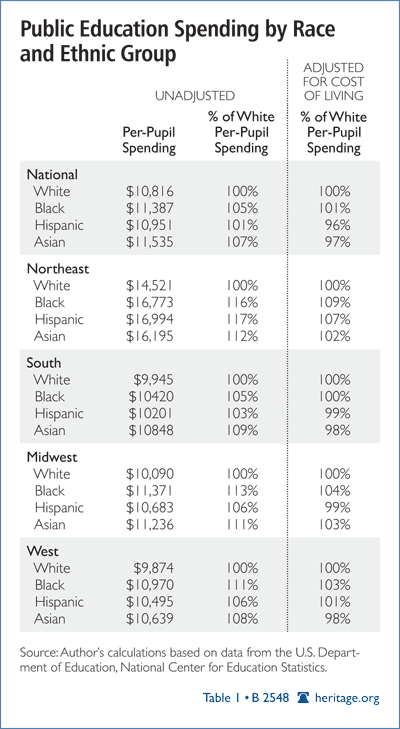
Nationwide, raw per-pupil spending is similar across racial and ethnic groups. The small differences that do exist favor non-white students. After breaking down the data by region, the non-white funding advantage becomes more pronounced. In the Northeast, for example, blacks receive over $2,000 more than whites in per-pupil funding per year. The region with the smallest differences is the South, where spending on black and Hispanic students is only slightly higher than on whites.
Adjusted for cost of living, the differences narrow. Asian and Hispanic students receive slightly less money than whites overall, while blacks receive slightly more. Regional differences persist after the adjustment, especially in the Northeast.
Discussion
The results in the previous section are straightforward—minority students receive about as much public school funding as white students. However, there are two additional issues that complicate the debate over school financing:
1. Funding Disparities Within Districts. The preceding analysis assigns each student the per-pupil spending level of his or her district, meaning that the analysis cannot capture funding differences within districts at the school level.[15] This limitation is unlikely to be a problem in smaller suburban and rural districts, where socioeconomic differences are less pronounced. In big-city districts, such as New York or Chicago, however, intra-district funding disparities are a potential issue.
Indeed, Darling-Hammond, the University of Washington’s Marguerite Roza, and other education analysts have focused on possible disparities at the school level, particularly the tendency for veteran teachers to avoid schools with low-income and high-minority student bodies.[16] District policies often allow teachers with higher seniority to move to their preferred schools within the same district.
It is difficult to know how important this phenomenon is, since teaching experience is a weak predictor of teacher quality.[17] Data from the 1990s indicate that young teachers in high-minority schools are, if anything, more qualified than the average teacher, but they are also more likely to desire a different career.[18]
To the extent that money is indeed distributed inefficiently within districts, it is the result of poor public administration, not a lack of appropriated funds. Though minority students face many obstacles in getting a quality education from the public school system, an inequitable commitment of resources from taxpayers is not one of them.
2. Accounting for Differences in Student Needs. Since school funding is so similar across racial and ethnic groups, it cannot be the proximate cause of group differences in school achievement. Still, some analysts now argue that education funding is not equitable unless far more money is spent on minority students compared to white students. Indeed, a 1998 NCES report used a student-needs adjustment that made school funding “equitable” only if poor students (usually defined as qualifying for free or reduced-fee lunch) received 20 percent more per-pupil funding than non-poor students.[19]
The justification is that poor and minority students face greater socioeconomic problems outside the classroom, necessitating greater education spending as a kind of remediation. This revised view of school funding is very different from the one espoused by the NAACP, Kozol, and others quoted earlier. The original argument made by equalization advocates identified the alleged disparity in school funding as the cause of lower minority achievement. Under the revised view, the cause must be problems outside the classroom, and spending is considered equitable only if it is high enough to remediate those problems.
The degree to which student-needs adjustments are appropriate is beyond the scope of this paper, which specifically focuses on refuting the claim that minority students receive less funding for school than white students. Clearly, students with physical handicaps or language barriers will require more resources than students without them, but whether poverty by itself or low ability by itself requires statistical adjustment is questionable. Student-needs adjustments taken to an extreme could imply that no level of school funding—no matter how generous to minority students—could ever be considered “equitable” as long as achievement disparities remain.
That debate aside, it is a mistake to assume that funding increases for public schools can close the achievement gap. Purchasing more educational resources is a popular idea, but rigorous studies on reduced class sizes, graduate degrees for teachers, and enhanced amenities in schools suggest little or no impact on student achievement.[20]
Conclusion
Although it is often blamed for the racial achievement gap, unequal school funding is largely a myth. Per-pupil spending in the U.S. is broadly similar across racial and ethnic groups. If any one group enjoys an advantage in funding, it is black students, especially in the Northeastern states. Group differences in school achievement cannot be the result of an unequal commitment of resources to minority students, and simple increases in public school funding are not likely to close the gaps.
—Jason Richwine, Ph.D., is Senior Policy Analyst in the Center for Data Analysis (CDA) at The Heritage Foundation. He is grateful to former CDA intern Alyssa Redfearn for her research assistance.


