Abstract: Despite the famed 1996 Welfare Reform Act and the more recent welfare adjustments in 2006, 60.8 million Americans remain dependent on the government for their daily housing, food, and health care. The number of taxpayers is shrinking--and the country may be rapidly approaching the point where more than one-third of Americans do not pay taxes for benefits they receive. In February 2009, the Democrat-controlled Congress and the new Obama Administration may have driven the final stake into the heart of any semblance of fiscal responsibility when they enacted the American Recovery and Reinvestment Act--essentially overturning the fiscal foundation of welfare reform.
Starting in 2016, Social Security will not collect enough in taxes to pay all of the promised benefits-- which is a problem for all workers, but especially for the roughly half of the American workforce that has no other retirement program.
Add in spiraling academic grants, flat-out farm socialism, and the swelling ranks of Americans who believe themselves entitled to public-sector benefits for which they pay few or no taxes--and Americans must ask themselves whether they are near a tipping point in the nature of their government.
The budget, welfare, and policy experts at the Heritage Foundation lay out the gloomy facts--in the hopes of pulling Americans back from the brink of complete dependence on the government.
The 2008 election of Barack Obama as President of the United States, and the energetic, state-centered policy program advanced by his new government in 2009 will likely mark a turning point in the history of American public policy. The new Administration's record is still taking shape as this report goes to press--but presidents elected with enormous support, such as that which put Barack Obama in the White House, rarely fail to reshape some of the fundamental public policies they pledged to change.
Certainly, President Obama wasted little time in converting his strong electoral margin into a campaign for policy changes that increased government control both over the economy as well as over the wider society. From virtually the first day, the Obama Administration rapidly advanced programs and initiatives that deepened and expanded American citizens' dependency on government. From new and expanded federal programs designed to boost economic activity to health care reform that placed the U.S. government at the center of the nation's health care system, the central thrust of policy since January 2009 has been to increase Americans' daily dependency on Washington.
However, the rapid expansion of dependency-creating programs did not begin with Barack Obama's inauguration. Indeed, President Obama inherited substantial momentum toward greater dependency on government from the George W. Bush Administration and prior governments. The 2009 Index of Dependence on Government is based on fiscal and calendar year 2008 data, and shows that,
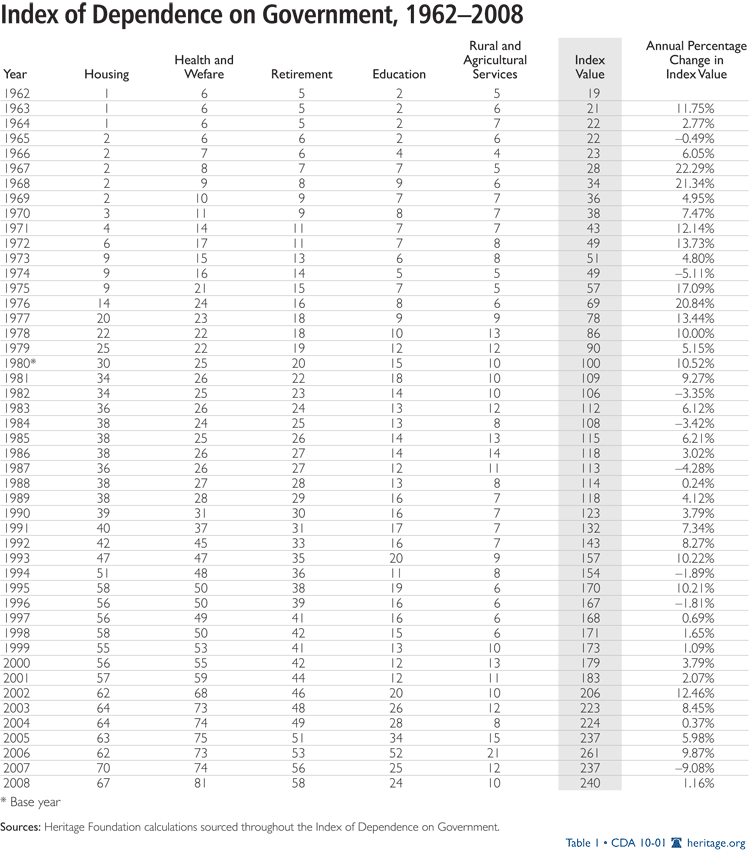
- The Index now stands at 240, based on data through the calendar year ending in 2008. That is up three points from its value of 237 in 2007;
- The Index has grown by 31.2 percent since 2001, when it stood at 183. In other words, nearly a third of its increase since 1980 (the base year of the Index when it stood at 100) has occurred in just the last eight years; and
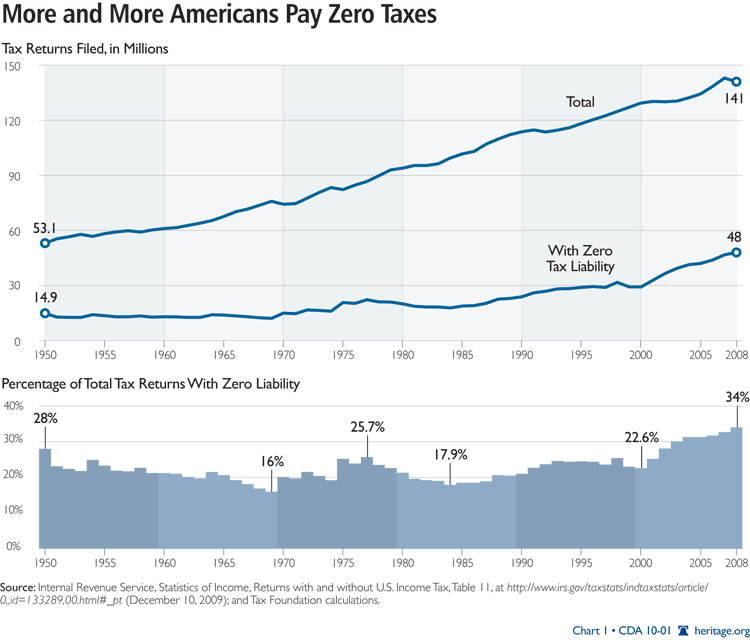
- This rapid growth of the Index has been accompanied by a rapid increase in the percentage of tax filers who pay no taxes. That percentage jumped from 21.3 percent in 1980 to 34 percent in 2008. In 1980, 20 million tax filers paid no taxes; in 2008, 48 million paid nothing.
It is the conjunction of these two trends--higher spending on dependency-creating programs and an ever-shrinking number of taxpayers to pay for these programs--that worries those interested in the fate of the United States' republican form of government. Americans have always expressed concern about becoming dependent on government, even while understanding that life's challenges make most people, at one time or another, dependent on aid from someone else. This concern stems partly from deeply held views that life's blessings are more readily obtained by independent people and that growing dependency on government erodes the spirit of self-reliance and self-improvement. These views help explain the broad public support for welfare reform in the 1990s.
This ethic of self-reliance combined with a commitment to the brotherly care for those in need appears threatened in a much greater way today than when this Index first appeared in 2002: This year marks the first year that the Index contains significant retirements by baby boomers. Over the next 25 years, more than 75 million boomers will begin collecting Social Security checks, drawing down Medicare benefits, and relying on long-term care under Medicaid. No event will financially challenge these important programs over the next two decades more than this shift of the largest generation ever into retirement.
It is not only financial tests that these programs will face. Certainly, these will be great over the next several decades, given that none of these "entitlement" programs can easily meet their financial obligations even now. Doubling the number of people in retirement will constitute a massive growth of the dependent population of the United States and a potentially ruinous drain on federal government finances. Perhaps the most important aspect of the boomer retirement is its dramatic reminder to us of the rapid growth of government dependency in the United States.
The burgeoning of flagship entitlement programs and the shrinking number of taxpayers who have any financial stake in the government threaten to bankrupt the government--which has led to an increasing interest across the political spectrum in the growth of dependency-creating initiatives. Are Americans closing in on a tipping point that endangers the workings of their democracy? Have Americans, perhaps, already passed that point? Can this republican form of government withstand the political weight of a massively growing population of Americans who see themselves entitled to government benefits and who contribute little or nothing for them?
To explore these questions, one must measure by how much federal social programs have grown. How much have such programs "crowded out" what were once social obligations and services carried out by community groups, family networks, and even local governments? In other words, has the civil society yielded significant ground to the federal public sector?
The Index of Dependence on Government is an attempt to measure these patterns and provide data to help ponder the implications of these trends. Table 1 contains the Index scores for 1962-2008, with 1980 as the base year. As this table indicates, dependency on government has grown steadily and at an alarming rate in recent decades.
The Fiscal Challenges of Growing Dependence
Entitlements. The issue of dependence is particularly salient today when more and more Americans are about to begin their reliance on government during retirement. At age 65, retirees are eligible to collect income from Social Security and health care benefits from Medicare or Medicaid.[1] Currently, these programs make up 41 percent of all non-interest federal program spending. Over the next two decades, that spending will increase to nearly 62 percent of non-interest spending as 10,000 baby boomers per day retire and begin to collect benefits. Jointly, these programs will enable the government dependency of nearly 80 million baby boomers.
This is particularly troubling because most of the soon-to-be users of these programs are middle-class to upper-class Americans who would otherwise not be dependent on government support at all. Because eligibility for these programs is linked to age, not financial need, multi-millionaires and billionaires collect the same benefits as do low-income retirees, such as subsidized prescription drugs through Medicare Part D.
To pay for these middle-class and upper-class entitlements in the coming years will require unprecedented levels of deficit spending. According to the Financial Report of the United States, the amount of debt Americans expect to pay for these commitments is $56.4 trillion--$184,000 per American citizen.[2] This is an unsustainable level of debt sure to slow the economy and could force high rates of taxation in the future. The high costs of these programs, which will be shouldered by the children and grandchildren of baby boomers, could lead to further increases in dependency of future generations who would be more likely to depend on welfare during a slow economy, for instance. This snowballing of dependency--caused by Social Security, Medicare, and Medicaid--could send the country past a tipping point of sustainable dependency that could endanger the functioning of democracy itself.
Additionally, the growing cost illustrates the budgetary problem of allowing dependency to grow unchecked. One reason this growth will be so significant is that these programs grow on auto-pilot, which, in turn, perpetuates dependence since these programs are not subject to regular debate and evaluation. Unlike nearly all other program spending, Social Security, Medicare, and Medicaid are mandatory spending programs that operate outside of the annual budget process. This exemption entitles these programs to first call on all federal revenues regardless of other budgetary priorities. Substantive policy reform is required if this automatic dependency is to be halted. The solution is to turn these programs into 30-year budgeted programs, subjecting the budgets to debate every five years.
Other policy reforms that emphasize independence must also be part of addressing the problems inherent in these and other programs. The concept of a safety net ought to be restored to gear Social Security, Medicare, and Medicaid toward those who truly need them. This can be accomplished by relating benefits to a retiree's income and encouraging personal savings during working years.
Growth in the Non-Taxpaying Population. The challenges that Congress faces in reforming these entitlement programs are heightened by the rapid growth of other dependency-creating programs and by the growing number of Americans who pay nothing for them. How likely is Congress to reform entitlements as rapidly as it should when so many voters pay little or nothing for the other dependency-creating programs contained in this Index? Can Congress rein in the massive middle-class entitlements in an environment of rapidly growing dependency programs?
In 1962, the first year of the Index of Dependence on Government, the percentage of all taxpayers with zero tax liability stood at 20.1 percent. This number fell to 16 percent by 1969 before beginning a ragged but ultimately steady increase. By 2004, the percentage stood at 31.3 percent.[3] It stood at an estimated 34 percent for 2008.[4] (See Chart 1.) In short, the country may be rapidly approaching a point where more than one-third of taxpayers do not pay taxes for the federal benefits that many of them receive.
I. The Purpose and Theory of the Index
The 2009 Index of Dependence on Government is organized into four major sections.
- Section one explains the purpose and theory behind the Index.
- Section two reviews major policy changes in the five program areas.
- Section three features a methodology that describes how the Index is constructed.
- Section four discusses the Index in terms of the number of Americans who depend on government programs.
The Index of Dependence is designed to measure the pace at which federal government services and programs have grown in areas in which private or community-based services and programs exist or existed to address the same or similar needs. By compiling and condensing the data into a simple annual score (composed of the scores for the five components), the Index provides a useful tool for analyzing dependency on government. Policy analysts and political scientists can also use the Index and the patterns that it reveals to develop forecasts of trends and ponder how these trends might affect the politics of the federal budget.
The Index uses data drawn from a carefully selected set of federally funded programs. The programs were chosen for their propensity to duplicate or replace support given to needy people by local organizations, neighborhoods, communities, and families, such as shelter, food, monetary aid, education and health care, or employment.
In calculating the Index, the expenditures for these programs are weighted to reflect the relative importance of service (e.g., shelter, health care, and food). The intensity of someone's dependency will vary with respect to the need. For example, a homeless person's first need is generally shelter, followed by nourishment, health care, and income. Center for Data Analysis analysts weighted the program expenditures based on this hierarchy of needs, which produces a weighted Index of expenditures centered on the year 1980.
Historically, private individuals and local entities have provided more assistance to needy members of society than they do today. Particularly during the 20th century, government gradually offered more and more services that were previously provided by self-help and mutual-aid organizations.[5] Lower-cost housing is a good example. Mutual-aid, religious, and educational organizations have long aided low-income Americans with limited housing assistance, but after World War II, the federal and state governments began providing the bulk of low-cost housing. Today, the government provides nearly all public-housing assistance.
Health care is another example of this pattern. Before World War II, Americans of modest income typically obtained health care and health insurance through a range of community institutions, some operated by churches and social clubs. That entire health care infrastructure has since been replaced by publicly provided health care insurance, largely through Medicaid and Medicare. Regardless of whether the medical and financial results are better today, the relationship between the people receiving health care assistance and those paying for it has changed fundamentally. Few would dispute that this change has negatively affected the total cost of health care and the politics of the relationships among patients, doctors, and hospitals.
Financial help for those in need has also changed profoundly. Local, community-based charitable organizations once provided the majority of the aid, which resulted in a personal relationship between the individuals receiving help and those in the community providing that assistance. Today, Social Security and other government programs provide much or all of the income to indigent and modest-income households. Unemployment insurance payments provide nearly all of the income to temporarily unemployed workers that was once provided by unions, mutual-aid societies, and local charities. Indeed, income assistance is quickly becoming a government program with little, if any, connection to the local civil society.
This shift from local, community-based mutual-aid assistance to government assistance has clearly altered the relationship between the person in need and the service provider. In the past, the person in need depended on help from people and organizations in his or her local community. The community representatives were generally aware of the person's needs and tailored the assistance to meet those needs within the community's budgetary constraints. Today, housing and other needs are addressed by anonymous government bureaucrats who have little or no ties to the community where the needy person lives.
Both cases involve a dependent relationship. However, the dependent relationship with elements of the civil society includes healthy expectations of the recipient's future civil viability or ability to aid another person in turn. The dependent relationship with the political system has no reciprocal expectations. The former relationship is essential to the existence of civil society itself. The latter is usually based on unilateral aid where the recipient's return to civil viability is not a factor. Indeed, the "success" of such government programs is frequently measured by the program's growth rather than the outcomes it produces. While the dependent relationship with civil society leads to a balance between the interests of the person and the community, the dependent relationship with the government runs the risk of generating political pressure from interest groups--such as health care provider organizations, local communities, and the aid recipients themselves--to expand and cement federal support.
The Index of Dependence on Government provides a way of assessing the magnitude and implications of the change in government dependency in American society. The steps taken in preparing this year's Index are described in the methodological section near the end of this paper, and the Index is based principally on historical data from the President's FY 2010 annual budget proposal.[6] The last year for the 2009 Index was FY 2008. The Center for Data Analysis (CDA) used a simple weighting scheme and inflation adjustment to restate these publicly available data. We encourage replication of our work and will provide the data that support this year's Index to anyone who so requests.
II. The Five Index Components
CDA analysts began by reviewing the federal budget to identify federal programs and state activities supported by federal appropriations that fit the definition of dependency. Specifically, this standard means that a reasonable argument could be made that the program or activity provides goods or services that could crowd out or constrain private or local government alternatives. Furthermore, the immediate beneficiary must be an individual.
This standard generally excludes state programs that could foster dependency. However, federally funded programs in which the states act as intermediaries are included.
Elementary and secondary education is the principal state-based program excluded under this stipulation. Post-secondary education is the only part of government-provided education included in the Index.[7] Military and federal employees are also excluded because national defense is viewed as a primary function of the federal government and thus does not promote dependency in the sense used in this research.
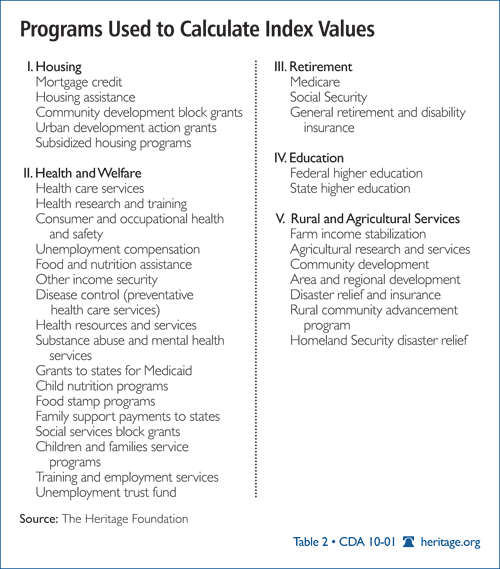
CDA analysts then divided the qualifying programs into five broad components:
- Housing
- (a) Health care and (b) Welfare
- Retirement
- Higher education
- Rural and agricultural services.
The following sections discuss the pace and content of policy change in these five components.
1) Housing.[8] The Department of Housing and Urban Development (HUD) was created in 1965 by consolidating several independent federal housing agencies into a single Cabinet department. The purpose of the consolidation was to elevate the importance of government housing assistance within the constellation of federal spending programs. At that time it was believed that the destructive urban riots that broke out in many cities in the early 1960s were a consequence of poor housing conditions and that these conditions were contributing to urban decay. To this end, the two initiatives--housing assistance and urban revitalization--were combined into a single federal department.
HUD spending still largely reflects that dual mission. In any given year, about 80 percent of HUD's budget is targeted toward housing assistance, and the other 20 percent is focused on urban issues by way of the Community Development Block Grant (CDBG) program. Given the nature of these programmatic allocations, HUD budgetary and staff resources are concentrated on low-income households to an extent unmatched by any other federal department.
Within the 80 percent of the HUD budget spent on housing assistance are a series of means-tested housing programs, some of which date back to the Great Depression. Typically, these programs provide low-income households, including the elderly and disabled, with apartments at monthly rents scaled to their incomes. The lower the income, the lower the rent. Traditionally, HUD and the local housing agencies provide eligible low-income households with "project-based" assistance, an apartment unit that is owned and operated by the government.
Public housing projects have historically been the most common form of such assistance, but they began to fall out of favor in the 1960s because of the rampant decay and deterioration that followed from concentrating too many troubled, low-income families in a single complex or neighborhood. Periodically, a new form of project-based program is adopted as "reform," but the new program tends to fall out of favor after several years of disappointing results. HOPE VI is the most recent form of project-based assistance, but high costs relative to benefits led the George W. Bush Administration to attempt to terminate the program in 2006. However, efforts are underway by some in the Obama Administration to increase the program's funding and restore it to a position of even greater prominence.
HUD also provides "tenant-based" housing assistance to low-income households in the form of rent vouchers and certificates. These certificates help low-income households rent apartments in the private sector by covering a portion of the rent. The lower the person's or family's income, the greater the share of rent covered by the voucher or certificate. Vouchers were implemented in the early 1970s as a cost-effective replacement for public housing and other forms of expensive project-based assistance, but still account for only a portion of housing assistance because of industry resistance to terminating the lucrative project-based programs.
Finally, HUD provides block grants to cities and communities through the CDBG program according to a needs-based formula. Grant money can be spent at a community's discretion among a series of permissible options. Among the allowable spending options is additional housing assistance, which many communities use to provide assistance to a greater number of low-income households. In 2005, President Bush proposed transferring CDBG from HUD to the Department of Commerce and reducing funding for the program.
Although HUD programs are means-tested to determine eligibility, they are not entitlements. As a result, many eligible households do not receive any housing assistance because of funding limitations. In many communities, the waiting lists for housing assistance are long--up to several years-- and in some cases local housing authorities no longer add new families to the list because there is simply no prospect of newer families ever receiving an apartment.
Recognizing that HUD housing assistance can create dependency among those who receive its benefits, some Members of Congress have attempted to extend the work requirements of the 1996 Personal Responsibility and Work Opportunity Reconciliation Act to HUD programs. But advocates for the poor have thwarted these efforts. To date, the most that can be required of a HUD program beneficiary is eight hours per month of volunteer service to the community or housing project.
The complexity of HUD's changing mix of project-based housing assistance can make measuring dependency difficult, especially over time. For example, trends in inflation-adjusted HUD spending suggest that dependency has been rising for many years.[9] Alternative measures, however, such as periodic tabulations of the share of renters receiving some form of housing assistance, indicate no change over the same period. For example, inflation-adjusted HUD spending increased by 11.6 percent from 1993 to 1999, but the share of renters who received some form of rent subsidy fell from 18.4 percent to 17.8 percent during that same time, perhaps reflecting the shift to the more costly HOPE VI program. Census estimates are available for only 1993 and 1999, so it is difficult to determine the extent to which these numbers characterize the entire period. More recently, the increase in HUD assistance--especially in the CDBG program--was caused by construction to rebuild much of the infrastructure that was destroyed along the Gulf Coast by Hurricanes Katrina and Rita.
2(a) Health Care.[10] Public health programs, particularly Medicare and Medicaid, are contributing to a growing dependency on government. These two programs were enacted in 1965 to provide coverage for the elderly, poor, and disabled. Medicare delivered benefits to 45.2 million people in 2008 and 48.2 million people were enrolled in Medicaid that same year.[11] Combined, these programs accounted for $816.9 billion in federal spending in 2008, which translates into 27.4 percent of total federal spending.[12]
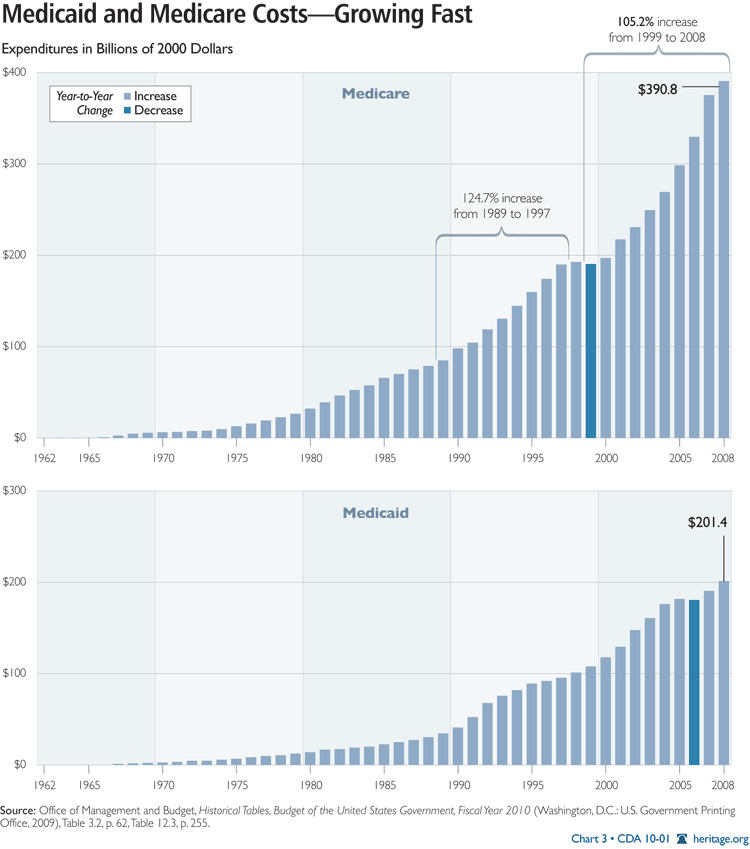
Medicare provides health care for individuals ages 65 and over and for those with certain disabilities. Medicare enrollment has increased steadily since its enactment in 1965, indicating that an increasing number of people now depend on government for their health care. In 1970, an estimated 20.4 million individuals were enrolled in Medicare. By 2008, the number of enrollees had more than doubled to 45.3 million.[13]
Left unchanged, dependency on Medicare will only grow. During the five-year period from 2008 to 2013, 77 million baby boomers will retire in large numbers, pushing enrollment to unprecedented levels. This flood of new enrollees will not only increase the number of individuals dependent on the program, but also the demand for new medical benefits.
While Medicare is the primary source of health care coverage for this population, many enrollees have supplemental private sources of coverage, such as employer-provided retiree coverage. However, the demand for new services--such as the addition of a universal prescription drug benefit in 2003--crowds out private coverage alternatives. Two-thirds of all Medicare enrollees had prescription drug coverage from another source before the new drug benefit was enacted.[14] But according to an analysis by Frank Lichtenberg and Shawn Sun, the new drug benefit resulted in a crowd-out rate of 72 percent. For every seven prescriptions paid for by the government, five would have otherwise been privately financed, resulting in a net gain of only two new prescriptions.[15] If trends like these continue, Medicare will become the sole financier, not just the primary source, of health benefits to the 65-plus population.
Medicaid, the joint federal-state health care program for the poor, also faces growing dependency. In 1990, 22.9 million Americans were enrolled in Medicaid, a figure which has more than doubled since. Medicaid serves a diverse population of the poor, including children, adults, the elderly, and the disabled. While a plurality of Medicaid enrollees were children (48.9 percent), a plurality of spending goes to the elderly and the disabled (65 percent).[16]
The structure of the Medicaid program varies from state to state because states can determine their own eligibility and benefit levels provided they meet a minimum federal standard. Many states have used this flexibility to expand eligibility further up the income scale. These incremental Medicaid expansions and enactment of the State Children's Health Insurance Program (SCHIP)[17] have allowed eligibility of more individuals for government health programs, particularly in working families that may have otherwise had access to private coverage but instead were enrolled in government-run programs. In 2007, the Congressional Budget Office (CBO) concluded that 25 to 50 percent of those covered by previous SCHIP expansions were likely crowded out of private coverage.[18]
This growing dependence directly affects taxpayers. Medicare and Medicaid are the two largest entitlement programs, and spending for both is expected to skyrocket. By 2019, Medicare is projected to cost $942 billion, and federal spending for Medicaid is expected to reach $427 billion. The CBO anticipates that the two programs will consume more than 12 percent of GDP by 2050.[19] Actuaries at the Centers for Medicare and Medicaid Services at the Department of Health and Human Services predict that the government (federal and state) will fund more than half of all health care spending by 2018.[20]
While Congress did not attempt to expand Medicare in 2008, the passage of the economic stimulus package and expansion of the State Children's Health Insurance Program in early 2009 led to greater government control over health care. By increasing federal Medicaid spending by $87 billion in just two years, the stimulus not only bailed out fiscally irresponsible states, but it further expanded dependence on the already unsound Medicaid entitlement program. The federal SCHIP expansion passed by Congress also increased government dependence by expanding the program up the income scale to children in families earning three times the federal poverty level and higher. It also increased government control by forcing federal mandates on state operations of the program. The new Congress has, in effect, begun to turn SCHIP into an entitlement program like Medicaid.
In its yearly survey of health insurance coverage, the U.S. Census Bureau in 2009 published figures that underscore the current trend toward government dependency.[21] The percentage of Americans with private health insurance is on the decline, mostly as a result of the steady erosion of employer-based coverage, while the percentage of Americans on government programs is rising even faster, in large part due to Medicaid and SCHIP expansions and an aging population that is becoming increasingly dependent on Medicare. The debate taking place in Congress over health care reform could have far-reaching consequences. The outcome will ultimately determine whether there will be more, or less, dependence on government for health care in America.
The status quo is unsustainable and would lead to more government control in the financing and delivery of health care. Without fundamental change, there will be far greater dependence on the government for health care, fewer workers to pay for it, and fewer incentives for private-sector solutions. Instead of depending on the government for health benefits and services, a better alternative would be to convert the money currently used to administer public health programs into a direct subsidy to help those in need purchase private health care coverage. Unfortunately, the health care bills being developed in Congress would move America in the wrong direction by adding trillions of dollars in new federal spending in order to create a new health care entitlement program. The nation is in need of serious entitlement reform: Taxpayers will soon be unable to meet existing promises, let alone any new obligations. Americans simply cannot afford more government dependence in health care.
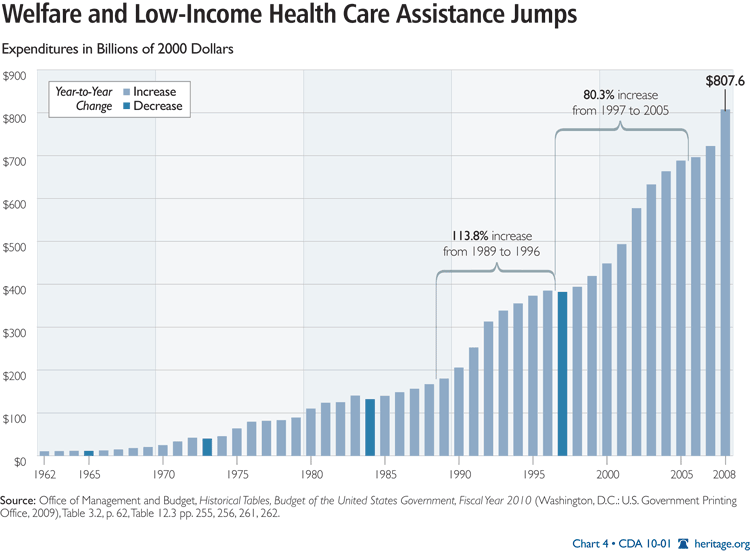
2(b) Welfare.[22] The 1996 Welfare Reform Act, or the Personal Responsibility and Work Opportunity Reconciliation Act (PRWORA), replaced the decades-long Aid to Families with Dependent Children (AFDC), through which recipients were entitled to unconditional benefits, with Temporary Assistance for Needy Families (TANF), a block grant program. Enacted during the Great Depression, the old cash welfare program was intended to provide financial assistance to needy dependent children. Over the decades, however, the program swelled and included adults, such as an unemployed parent, as well. Welfare rolls peaked in 1994, reaching more than 5 million cases, or 14.2 million recipients. Before welfare reform, one child in seven received AFDC aid.
An open-ended assistance program, AFDC gave states more money as their welfare rolls continued to increase. At the individual level, AFDC handed out benefits without any expectations from the recipients. That is, recipients were entitled to cash aid as long as they fell below the need standards set by the states. The entitlement created perverse incentives--encouraging non-work among able-bodied adult recipients and discouraging marriage.
Welfare reform effectively altered the fundamental premise of receiving public aid and ended it as an entitlement. Receiving assistance was now temporary and tied to demonstrable efforts by the recipients to find work or take part in work-related activities. Self-sufficiency of the recipients became the focus. The successes of welfare reform are undeniable. Between August 1996 and December 2008, welfare caseloads declined by 61.6 percent, from 4.4 million families to 1.7 million families. The legislation was similarly successful in reducing child poverty. Since 1996, 1.1 million children have been lifted out of poverty, and black child poverty has reached historic lows.
The initial years after welfare reform brought significant progress, but by the late 1990s, most states had met the PRWORA's work goals, and the motivation to further reduce dependence and encourage work among recipients waned. The national TANF caseload flat-lined between 2001 and 2007, and the percentage of TANF recipients who worked part-time or full-time never rose above 26 percent nationally.[23] In February 2006, after four years of debate, Congress reauthorized TANF under the Deficit Reduction Act. The new legislation reiterates the need to engage recipients in acceptable work activities, moving them to self-sufficiency. Once again, states are required to increase work participation and to reduce their welfare caseloads using the lower 2005 caseload levels as the new baseline, which essentially restarts the 1996 reform. As required by the Congress, the Department of Health and Human Services also issued new regulations to strengthen work participation standards.
The 2006 reauthorization also contains a notable measure that begins to rectify the inattention to the other two 1996 welfare reform goals: reducing unwed childbearing and restoring stable family formation.[24] The erosion of marriage and family is a primary contributing factor to child poverty and welfare dependence, and it figures significantly in a host of social problems. A child born out of wedlock is seven times more likely to experience poverty than a child raised by married parents, and more than 80 percent of long-term child poverty occurs in broken or never-married homes. Moreover, the absence of marriage and fathers in the home negatively affects child development, educational achievement, psychological well-being, and propensity toward delinquency and substance abuse.[25]
For the last four decades, the unwed birth rate has been rising steadily, from 5.3 percent in 1960, to 39.7 percent in 2007.[26] Among African-Americans, 71.6 percent of all children born are to unmarried parents, and 51.3 percent among Hispanics. Although the pace of growth in the proportions of births to unmarried women slowed in the immediate years after welfare reform, in more recent years it has risen rapidly. From 2002 to 2007, the number of non-marital births increased by 26 percent. Today, nearly four children in ten are born outside of marriage. Whereas in 1970, one-half of all out-of-wedlock births were to teens, in 2007, teen non-marital births comprise only 23 percent of such births, and the majority (60 percent) of out-of-wedlock births occur to women in their twenties. In fact, since 1995, birth rates for unmarried teens, particularly younger teens, have generally declined. In contrast, birth rates for unmarried adult women have risen, especially since 2002.[27]
In the TANF reauthorization, Congress, for the first time, enacted a healthy-marriage initiative, allocating $100 million in TANF funds per year-- less than 1 percent of total TANF expenditures in the fiscal year 2006--to local organizations that provide voluntary marriage-centered services and skills training to recipients. In doing so, the government is finally recognizing the critical role that a stable marital and family environment plays in reducing child poverty and welfare dependence.
Despite the 1996 Welfare Reform Act and the 2006 TANF reauthorization, comprehensive welfare reform is far from achieved. Today's welfare system is a convoluted machinery of 70 programs, six federal departments, and a voluminous collection of state agencies and programs. A typical welfare recipient family could receive assistance from six or seven programs (e.g., TANF, Medicaid, food stamps, public housing, Head Start, and the Social Services Block Grant) administered by four different departments.[28] In the fiscal year 2008, government spending on means-tested programs, which target benefits to individuals below certain income levels, totaled $713 billion, of which $522 billion came directly from the federal government. Welfare spending was the third largest category of government expenditures, after combined costs of Social Security and Medicare, and public education.
Too many of these welfare programs operate on means-tested eligibility and without any real mechanism to break dependence. Twelve years after the reform, the welfare system still rewards non-work. Further reform efforts should focus on applying TANF principles to other failing welfare programs that subsidize idleness and foster dependency, and remove the anti-marriage bias and economic marriage penalties inherent in other means-tested welfare programs (e.g., the Earned Income Tax Credit for married couples with children).
Alarmingly, in February 2009, the Democrat-controlled Congress and the new Obama Administration enacted the American Recovery and Reinvestment Act of 2009, which essentially overturned the fiscal foundation of welfare reform. Under the act, which reverts to an AFDC-style funding scheme, states are given cash bonuses when they swell the welfare rolls. Moreover, covering 80 percent of the cost of new welfare caseloads, the federal government is giving states much more money than it did under the old welfare program. The new legislation clearly undercuts the incentives wrought by welfare reform to move individuals into work and self-sufficiency. The act also significantly increases other cash, food, housing, medical care, and welfare expenditures, thereby laying the foundation for a permanent expansion of the welfare system.
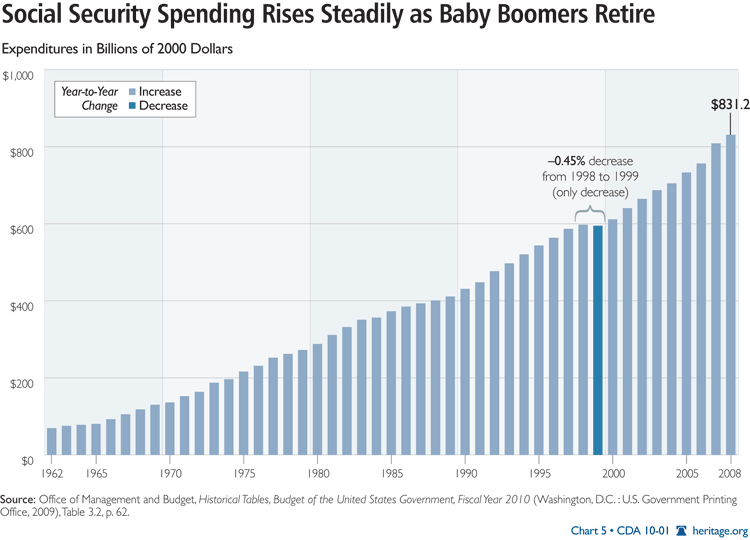
3) Retirement.[29]Since the time of President Franklin D. Roosevelt, the American retirement system has been described as a three-legged stool consisting of Social Security, employment-based pensions, and personal savings. Yet the reality is quite different. Almost half of American workers (about 78 million) are employed by companies that do not offer any type of pension or retirement savings plan. This proportion of employer-based retirement savings coverage has remained roughly stable for many years, and experience has shown that few workers can save enough for retirement without such a payroll-deduction savings plan. For workers without a pension plan, the reality of their retirement is closer to a pogo stick consisting almost entirely of Social Security.
Since 1935, Social Security has provided a significant proportion of most Americans' retirement incomes. The program pays a monthly check to retired workers and benefits to surviving spouses and children under the age of 18.[30] Monthly benefits are based on the indexed average of a worker's monthly income over a 35-year period, with lower-income workers receiving proportionately higher payments and higher-income workers receiving proportionately less. The lowest-income workers receive about 70 percent of their pre-retirement income, average-income workers receive 40 percent to 45 percent, and upper-income workers average about 23 percent.
However, the demographic forces that once made Social Security affordable have reversed, and the program is on an inexorable course toward fiscal crisis. To break even, Social Security needs at least 2.9 workers paying taxes for each retiree who receives benefits. Today, the ratio is 3.3 workers per retiree and dropping because the baby boomers produced fewer children and are now nearing retirement. The ratio will reach 2.9 per retiree in about 2016 and drop to 2 workers per retiree in the 2030s.
Current retiree benefits are paid from the payroll taxes collected from today's workers. Starting in 2016, Social Security will not collect enough in taxes to pay all of the promised benefits.
Since 1983, workers have been paying more in payroll taxes than the Social Security program needed. These additional taxes were supposed to accumulate to help to finance retirement benefits for baby boomers. But these excess taxes were not saved or invested for the future. Instead, the money was used to finance government programs. In return for the diverted revenue, Social Security's trust fund received special issue U.S. Treasury bonds. In 2016, when Social Security starts redeeming its Treasury bonds, the federal government will be required to pay off the bonds through higher taxes or massive borrowing.
Social Security's uncertain future is a problem for all workers, but especially for the roughly half of the American workforce that has no other retirement program. Few of these Americans have any significant savings, and they will depend heavily on the government for their retirement incomes.
This dependence is largely the result of government policies. By soaking up money that could otherwise be invested for the future, Social Security's high tax rate makes it much harder for lower-income and moderate-income workers to accumulate any significant savings.
Government policies also discourage the growth of occupational pensions to cover a higher proportion of the workforce. Over the last few decades, the cost of traditional pension plans has skyrocketed, and thousands of them have shut down. Efforts to develop innovative hybrid pension plans stalled when confusing laws and regulations resulted in lawsuits.
While many larger employers have substituted defined-contribution plans, such as 401(k) plans, both types of plans are subject to the Employee Retirement Income Security Act (ERISA). ERISA regulations are especially onerous to smaller employers, who usually lack the resources to hire a good funds manager and the necessary knowledge of the complex legal requirements. As a result, small businesses hesitate to offer retirement plans to their workers for fear of accidentally violating a regulation.
A simpler, less regulated account suitable to smaller businesses would go a long way toward increasing the number of workers with retirement savings. Simplified automatic enrollment procedures, automatic investment choices, procedures that allow savings to follow the worker from employer to employer, and better annuity choices would also help. The Automatic IRA, which incorporates these features and has been endorsed by such diverse publications as National Review and The New York Times,is one such simple retirement savings plan. Regrettably, until these policies move from theory to reality, Americans face increased dependence on a government-managed Social Security system that cannot possibly meet their needs. This dependence is likely to increase if millions of Americans fail to save enough for a comfortable retirement since such a development would put pressure on legislators to provide additional taxpayer-financed income programs.
4) Higher Education.[31]Federal spending on postsecondary education continues to grow. During the 2008-2009 school year, total federal spending on student aid programs (including grants, loans, and tax benefits) was $96 billion.[32] Total federal aid in 2007-2008 was 84 percent higher than in 1997- 1998 after adjusting for inflation.[33] In the 2007- 2008 school year, federal grant aid increased by 7.6 percent--well ahead of the inflation rate, since the consumer price index grew by 4.1 percent.[34]
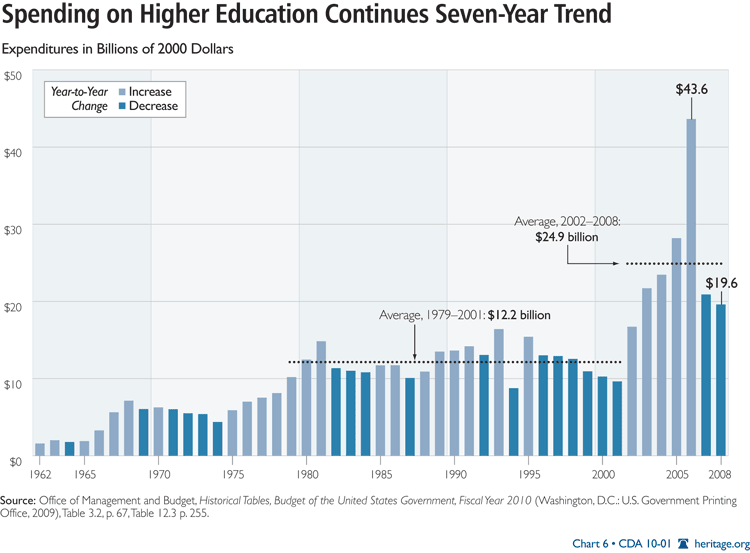
The growth in federal spending on higher education subsidies has increased the number and percentage of postsecondary students dependent on government aid. In the 2007-2008 school year, 5.4 million students received Pell Grant scholarships--compared to 3.7 million in 1997- 1998 and 2.9 million in 1987-1988.[35] Likewise, in 2007-2008, 42 percent of undergraduates borrowed federal student loans, an increase since 1997-1998, when only 33 percent used federal loan programs.[36]
Both federal spending and students' dependence on government are likely to rise in 2009 and future years. Following these large spending increases over the past decade, President Obama is now calling for significant growth in federal subsidies for student aid. In 2009, President Obama approved the American Recovery and Reinvestment Act, which included $17.1 billion in new, one-time funding for the federal Pell Grant program.[37] Moreover, President Obama has called for more American students to attend college and pushed for significant increases in federal assistance. His 2010 budget request called for the Department of Education to administer more than $129 billion in federal grants, loans, and work-study assistance--a 32 percent increase over 2008 levels of federal student aid.[38] The Administration's budget projects that 14 million American students will receive federal student aid.[39]
The Obama Administration has called for significant changes in federal student aid policy which will ensure continuous federal spending growth in the future. President Obama's 2010 budget called for the Pell Grant program to become mandatory, locking in funding growth in future years. The Administration has also called for the elimination of the Federal Family Education Loan (FFEL) program--replacing government-insured private-sector student loans with direct loans administered by the federal government. The latter move will increase taxpayers' exposure to the long-term risk of students defaulting on their loans and further crowd out the diminishing private sector of student loan providers. Over the long term, the result of this change will likely be increased federal spending and dependence on the federal loans.
Years of increasing federal subsidies and dependence on student aid has been followed by consistent growth in college costs. The College Board reports that published tuition and fees at public and private four-year institutions rose at an average annual rate of 4.2 percent and 2.4 percent after inflation over the past decade.[40]
Economists have identified the consistent growth in student aid as a factor that has allowed colleges to continue to increase their spending and, ultimately, raise tuition prices and other costs.[41] By continuing to increase student aid, and expand the pool of students who are able to access aid programs, government spending increases on higher education have made students less sensitive to college price increases and facilitated runaway spending by many colleges and universities.
Disturbing evidence suggests that the quality of the learning that is occurring in American postsecondary education is declining despite the large growth in federal spending on student aid. In 2006, the U.S. Department of Education's Commission on the Future of Higher Education reported that literacy among college graduates had declined over the past decade.[42]
The problems of higher education affordability, access, and quality will be best solved by colleges becoming increasingly competitive and working to lower their costs and improve services to attract more students to their schools. Congress and the Obama Administration should recognize that decades of increasing federal subsidies for postsecondary education and rising student dependence on federal aid have enabled colleges to increase their costs and, therefore, have failed to solve the problem of college affordability. Rather than increasing federal spending on postsecondary education, federal policymakers should reduce federal subsidies for higher education and refocus aid on students who demonstrate the greatest financial need.
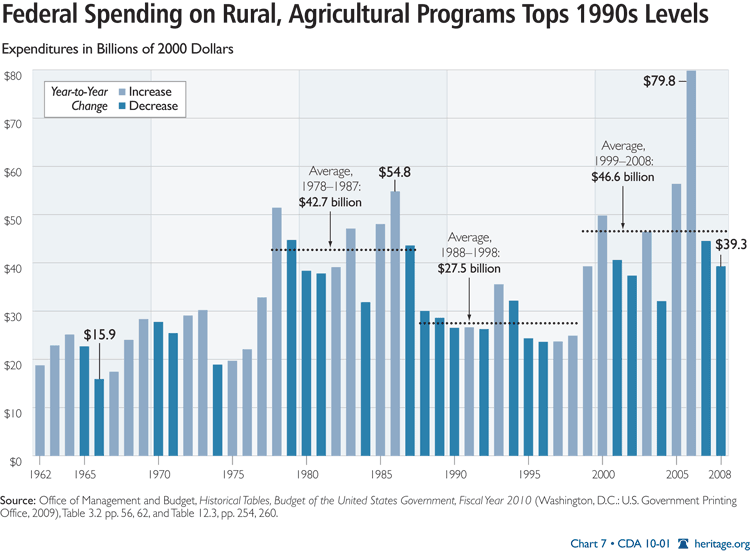
5) Rural and Agricultural Services.[43]Much of the rapid increase in "rural and agricultural assistance" dependence is rooted in farm subsidy programs. A multitude of farm subsidies (e.g., direct payments, countercyclical payments, market assistance loans, and non-recourse loans) generally work together to compensate farmers for low crop prices. Conservation payments pay farmers to initiate conservation projects or simply to stop farming their land. Export subsidies effectively lower the price of American products so that they can undercut international competitors.[44]
Farm subsidy supporters often describe farmers as impoverished victims of unpredictable weather and large global economic forces. In reality, American farmers are doing quite well. The average farmer has a net worth of $895,756[45] (double the national average of household wealth), and an annual income of $85,140[46] (27 percent above the national average) despite living in a rural area with significantly lower costs of living. The failure rate for farms is just one-sixth the rate of other businesses.
Yet farm subsidies have become America's largest corporate welfare program. The majority of subsidies go to commercial farms, which report average incomes of $200,000 and net worth of nearly $2 million. In contrast, the bottom 80 percent of farmers receive just one-fifth of the subsidies. If farm subsidies were really about alleviating farmer poverty, lawmakers could guarantee every full-time farmer an income of 185 percent of the federal level ($38,203 for a family of four) for just over $4 billion annually--one-sixth of the current cost of farm subsidies.[47]
Instead of need, farm subsidies are based on two factors: which crops are grown and how much is grown. Approximately 90 percent of all farm subsidies go to growers of just five crops: wheat, corn, cotton, soybeans, and rice. Growers of most other crops are ineligible for most subsidy programs, regardless of need.
Farmers who plant more crops receive larger subsidies. This is where the economic logic of farm subsidies falls apart. Subsidies are intended to compensate farmers for low prices that result from an oversupply of crops, but granting larger subsidies to farmers who plant the most crops only encourages them to plant yet more crops, driving prices even lower and leading to calls for larger subsidies. Furthermore, while paying some farmers to plant more crops, the Conservation Reserve Program pays other farmers to plant fewer crops. One analyst accurately describes U.S. farm policy as "one foot on the brake, one foot on the accelerator."[48]
Eventually, Congress acknowledged the failures of centrally planned agriculture. The 1996 Federal Agricultural Improvement and Reform Act of 1996[49] (also known as the Freedom to Farm Act) was designed to slowly phase out farm subsidies by 2002 and allow the agricultural sector to operate as a free market. After spending just $6 billion on farm subsidies in 1996, Congress overreacted to a temporary dip in crop prices in 1998 (resulting from the Asian economic slowdown) by passing the first in a series of annual emergency bailouts for farmers.
By 2000, farm subsidies hit a record $30 billion. Farmers quickly grew accustomed to massive government subsidies, and competition for the farm vote induced a bipartisan bidding war on the eve of the 2002 elections. Lawmakers gave up on reform and enacted the largest farm bill in American history, projected to cost at least $180 billion over the following decade. Despite escalating costs and negative economic effects, farm socialism is now the overwhelming preference of Congress and the White House.
Farm dependency will almost certainly continue. Policymakers mistakenly see farm subsidies as the solution to (rather than a significant cause of) low crop prices. Expensive disaster payments are doled out whether the weather is bad (crops destroyed) or good (crop oversupply lowers prices). Finally, farm subsidies have created an entitlement mentality among a class of farmers who will likely punish any elected officials who pursue reform. Currently, there are no plans to move farmers toward self-sufficiency.
Rather than fix this broken system, the 2008 farm bill made it worse.[50] Congress ignored President George W. Bush's call to subsidize only those farmers earning less than $200,000 annually, and repealed key limits on the subsidies a farmer may receive annually. The bill created a permanent new disaster program, increased subsidy rates, and used gimmicks to cover up a spending increase of approximately $25 billion over ten years. Even corn farmers, already benefiting from soaring prices resulting from federal ethanol policies, will continue to receive billions in annual subsidies. These anti-trade policies will also likely lead to retaliation by America's trading partners, harming American farmers and consumers. Congress overrode President Bush's veto of the farm bill, guaranteeing at least six more years of destructive farm policies.
III. How the Index of Dependence on Government Is Constructed
After identifying the government programs that contribute to dependence, the Center for Data Analysis further examined the data to identify the components that contributed to variability. Relatively small programs that required little funding and short-term programs were excluded. The remaining expenditures were summed up on an annual basis for each of the five major categories listed in Table 2.[51] The program titles are those used by the Office of Management and Budget for budget function and sub-function in the budget accounting system.
CDA analysts collected data for FY 1962 through FY 2007. Deflators centered on 2000 were employed to adjust for inflation.
Indices are intended to provide insight into phenomena that are so detailed or complicated that simplification through arbitrary but reasonable rules is required for obtaining anything other than a rudimentary understanding. For example, the Consumer Price Index (CPI) of the Bureau of Labor Statistics is a series based on an arbitrarily selected "basket of goods" that the bureau surveys periodically for price changes. The components of this basket are weighted to reflect their relative importance to overall price change. Energy prices are weighted as more important than clothing prices. Multiplying the weight times the price produces a weighted price for each element of the CPI, and the total of the weighted prices produces roughly the CPI score.
The Index of Dependence on Government generally works the same way. The raw (or unweighted) value for each program (i.e., the yearly expenditures on that program) is multiplied by its weight. The total of the weighted values is the Index value for that year.
The Index is calculated using the following weights:
- Housing: 30 percent
- Health and welfare: 25 percent
- Retirement: 20 percent
- Higher education: 15 percent
- Rural and agricultural: 10 percent
The weights are "centered" on the year 1980. This means that the total of the weighted values for the Index components will equal 100 for 1980, which gives the Index a reference year from which all other Index values can be evaluated.
The CDA chose the year 1980 because of its apparent significance in American political philosophy. Many analysts view 1980 as a watershed year in U.S. history because it seems to mark the beginning of the decline in left-of-center public policy and the emergence of right-of-center challenges to policies based on the belief that social systems fail without the guiding hand of government.[52]
The Index certainly reflects such a watershed. Chart 8 plots the Index from 1962 to 2007. The scores have clearly drifted upward over the entire period.
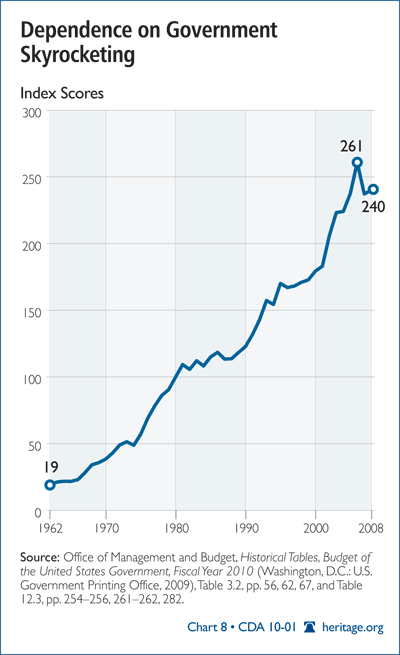
There are two plateaus in the Index--the 1980s and the period from 1995 to 2001--that suggest that policy changes may significantly influence the Index growth rate. During the early 1980s, the growth of some domestic programs was slowed to pay for increased defense spending, and Congress enacted significant policy changes in welfare and public housing during the 1990s. Both of these reduced the Index growth rate.
Chart 9 connects the Index to major public policy changes. The largest jump in the Index occurred during the Johnson Administration following the passage of the Great Society programs. The Johnson Administration not only launched Medicare and other health programs, but also vastly expanded the federal role in providing and financing low-income housing. The Index also jumped 92 percent (from 36 to 69) under the Nixon and Ford Administrations, when Republicans were funding and implementing substantial portions of the Great Society programs.
The two periods of relatively more conservative public policy (the 1980s and 1995-2001) stand out clearly in Chart 9. The slowdowns in spending increases during the Reagan years and after the 1994 congressional elections produced two periods of slightly negative change in the Index. These periods saw significant retreats from the Great Society goals, particularly in the nation's approach to welfare. The return of budget surpluses during the last years of the Clinton Administration, however, led to significant spending increases for all of the components, particularly education and health care. Since then, the Index has grown at roughly the same rate as it has during the past 25 years.
IV. Calculation of Covered Population
The Index reflects the growth of federal government programs that arguably crowd out or substitute for similar initiatives advanced by governments below the federal level or by organizations within civil society. Index values do not depend on the number of people receiving support through these programs, but that number nevertheless sheds additional light on what the Index illustrates.
Data on the number of people enrolled or benefiting from the programs listed in Table 1 between 1962 and 2007 were drawn from a variety of public sources. A significant effort was made to eliminate duplicate enrollments. For example, many people who receive Food Stamps also receive medical services through Medicaid.
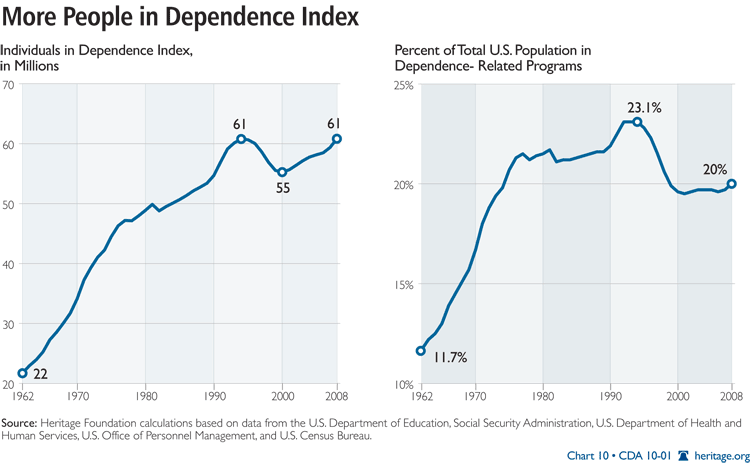
Chart 10 shows the annual number of program participants from 1962 through 2007. On the eve of the Great Society programs, some 21.7 million people (or 11.6 percent of the population) received assistance through the programs listed in Table 2 that existed at the time. Today, 60.8 million people (20 percent of the total U.S. population) receive some level of assistance through the programs included in the Index.
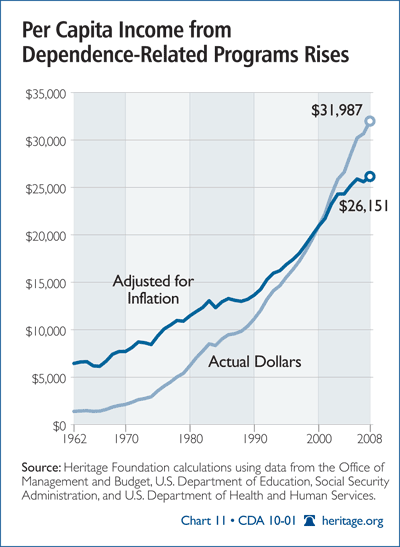
Growth in income and non-financial support among program participants has accompanied the increase of people who receive assistance. Per capita financial and non-financial support (after adjusting for inflation) stood at about $6,440 in 1966. By 2007, this support had grown to about $26,000. (See Chart 11.)
Data in the Index and complementary estimates of program populations raise concerns about the ability of local governments and civil society organizations to provide aid and other assistance. They also raise traditional republican concern about the long-term viability of political institutions when a significant portion of the population becomes dependent on government for most or all of its income. [53]
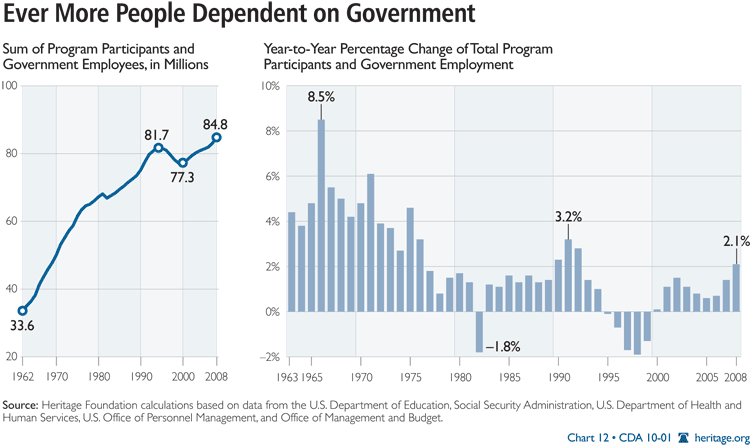
Nearly one-fifth of Americans (19.4 percent) on welfare may or may not be sufficiently high enough to trigger this concern. However, this percentage grows to 27.3 percent when federal and state employees are included. In 1962, the sum of these two categories (Index participants and government employees) stood at 33.6 million, or 18 percent of the total population. This total grew to 82.4 million (or 27.3 percent of the total population) by the end of 2007, an increase of 145 percent. This is 2.3 times the growth rate of the U.S. population over the same period and 30 percent faster than the growth rate of the population age 65 and above. (See Chart 12.)
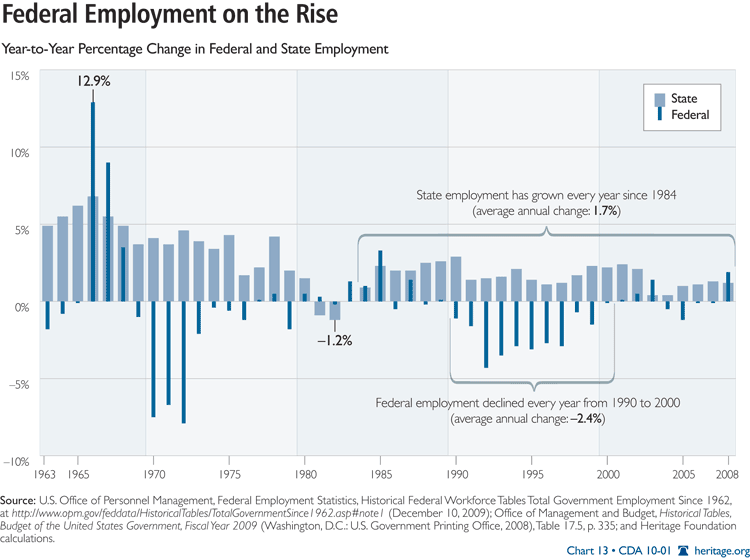
The annual growth rate in federal and state government employment has generally subsided since the 1960s and 1970s. (See Chart 13.) However, the growth rate of state government employment has been positive for all but three years out of the past 39. Federal employment grew during the military buildup of the 1980s and during the military downsizing after the collapse of the Soviet Union, which led to negative change rates in federal employment throughout the 1990s.
Conclusion
Public policy appears to matter in the growth of the Index of Dependence on Government. The rapid increase in the 1960s and 1970s corresponds with a new commitment by the federal government to solve local social and economic problems, which had previously been the responsibility of local governments, civil society organizations, and communities and families. The sum of government employees and the population covered by programs contained in this Index grew dramatically, even after accounting for the military buildup for the Vietnam War during the mid-1960s.
The 1980s and 1990s generally witnessed much slower growth in the Index. Indeed, if the period 1989 through 1993 had reflected the policies of the periods 1981-1988 and 1994-2001, the Index would have decreased in value. However, rather than fall, the Index appears to have resumed the growth rates attained during the Carter and George H. W. Bush Administrations.
Americans should be concerned about this seemingly relentless upward march in Index scores. Dependence on the federal government for life's many challenges strips civil society of its historical and necessary role in providing aid and renewal through the intimate relationships of family, community, and local institutions and governments. While the Index does not measure the decay of civil society, it reflects its declining role in this most important aspect of life.
Americans' concern over the growth of the Index should be particularly high for another reason: Americans find themselves on the eve of the largest retirement of people in world history--at the same time that the number of "taxpayers" who pay no taxes is growing steadily. This country's republican form of government, with its finely balanced mixture of civil and political institutions and charitable roles probably could withstand some additional, but only limited, increases in the dependent population as defined in this essay.
Can it stand, however, against the swelling ranks of Americans who believe themselves entitled to public-sector benefits for which they pay few or no taxes? Are Americans completely indifferent to history's many examples of experiments in republican government collapsing under the weight of just such a population? Are Americans near a tipping point in the nature of their government and the principles that tie it to civil life?
A fair reading of these trends and the data contained in this Index leads almost inescapably to the view that yes, Americans have reached that point.
William W. Beach is Director of the Center for Data Analysis at The Heritage Foundation. A number of policy personnel at The Heritage Foundation contributed significantly to this year's Index of Dependence on Government. Heritage policy experts David C. John, Dan Lips, Jennifer A. Marshall, Nicola Moore, Nina Owcharenko, Christine C. Kim, Brian M. Riedl, and Ronald D. Utt contributed commentary on the policy elements. Patrick Tyrrell managed the numerical components of the Index and coordinated the process of updating the policy sections.


