Either Republican Senator John McCain or Democratic Senator Barack Obama will have to make very important decisions on tax policy when he takes office in January 2009. First, the U.S. economy will be recovering from the financial crisis and is already predicted to grow less than its usual rate of 3.3 percent over the last 50 years.[1] Second, President George W. Bush's tax cuts will expire in 2011, and the President must decide how to extend or make permanent some of the tax cut provisions.
Senator McCain will make the Bush tax cuts permanent, with the exception of the estate tax. McCain credited the Bush tax cuts with helping the economy recover after the 2001 recession.
Senator Obama, on the other hand, will extend the Bush tax cuts only for those taxpayers who earn less than $250,000 a year-he has deemed the rest of the people "rich." Senator Obama will also enact new tax increases on these rich individuals as well as a series of targeted tax credits for lower-income individuals. Senator Obama believes that the current tax system is not progressive enough and that higher taxes on the rich should be used to give money to low-income individuals or those who do not work at all, such as retired people, reduce the deficit, and reduce the size of Social Security's shortfall.
The candidates do have some large areas of agreement. Both agree that:
- The Alternative Minimum Tax (AMT) should be indexed for inflation to prevent more and more taxpayers from being forced to pay the AMT. Senator McCain wants to increase the AMT exemption even more in future years;
- Many elements of the Bush tax cuts should be made permanent, such as the child tax credit, provisions that reduce the marriage penalty, and lower tax rates for most income brackets;
- The capital gains tax rate and the tax rate for qualified dividends should be equal; and
- The portion of estates that is tax exempt should be increased. (The candidates differ on lowering the estate tax rate. McCain wants to increase the exemption to $5 million and supports a tax rate of 15 percent while Obama wants to keep the exemption at the 2009 level of $3.5 million and supports a tax rate of 45 percent).
The candidates do have significant differences. Senator McCain's plan extends all of the Bush tax cuts, while Senator Obama's does not extend the cuts for the top two rates. Furthermore, Senator Obama would impose a new tax on those who earn more than $250,000 a year, which would be dedicated to paying for Social Security. Senator McCain has proposed a few other cuts, highlighted by a cut in the corporate tax rate and a change in the tax treatment of health care. Senator McCain's tax plan for health care is the following: Currently, workers do not pay tax on the value of insurance they receive from their employers. Senator McCain would end this preferential tax treatment and replace it with a tax credit that would allow families to purchase health insurance. Senator Obama has many new proposals, including several new tax credits. Senator Obama proposes a refundable health care tax credit to help low-income individuals purchase health care. Many of the other elements of Senator Obama's health care plan are outside the income tax system, such as issuing mandates that children have health insurance.
Both campaigns have engaged in heated rhetoric to explain why their tax proposal is the best for the country. Senator McCain's campaign argues that his plan is the best for economic growth, while Senator Obama's campaign states that his plan is the fairest because it ends tax cuts for the wealthy.
Voters as well as policymakers face conflicting claims about the merits of the two plans, with each candidate representing his plan as the best for the economy and for taxpayers. Voters especially should be able to compare the two tax plans side by side.

Basic Findings
Center for Data Analysis (CDA) analysts used an analytical tool that permits taxpayers and policymakers to see the side-by-side economic effects of the two plans: We used CDA tax models and tax information from other sources as inputs to Global Insight's (GI) U.S. Macroeconomic Model (the analytical tool), one of the most widely respected forecasting models.[2] Comparison of the likely economic and fiscal effects of these two competing plans is greatly facilitated by using the same economic model to evaluate both approaches. This report's findings include:
-
Jobs respond more to McCain's plan than to Obama's. Job growth over the 10-year forecast horizon is more than twice as high under McCain's plan than under Obama's. Total employment grows an average of 915,800 jobs under Obama, and by 2,126,000 under McCain. Both plans encourage job creation in each year of the forecast, but McCain's approach leads to significantly larger job growth, and sooner. By 2018, McCain's plan, which makes the Bush tax reductions permanent and lowers the tax rate on corporate profits, creates an additional 3,426,500 jobs. Senator Obama, however, raises taxes on many of the economy's key investors and business owners. Job growth under his plan for that same year is lower, at 1,576,200.
-
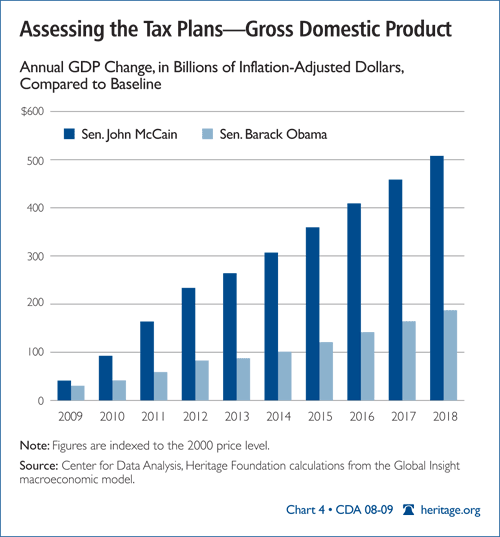
Overall economic activity more vigorous under McCain's plan. Senator McCain's plan yields consistently higher forecasts of economic output than does Senator Obama's. Increases in gross domestic product (GDP) under McCain are, on average, nearly three times higher than under Obama. The growth rate of the economy increases a full half percentage point in 2011 and 2012, when taxes will increase under current law. Under McCain's plan, the average annualized GDP growth rate increases by 0.3 percent. The Obama plan also leads to higher rates of economic growth as a result of making some parts of the Bush tax reductions permanent. The economy as measured by GDP grows modestly more than does the CBO baseline: Growth rates are 0.1 percent higher on average for the 10-year period. By 2018, GDP is $320.7 billion (after inflation) higher under the McCain plan than under Obama's.

- More after-tax spending potential under McCain than under Obama. Using the same model to evaluate both plans, our analysis shows that a family of four will have an average of $5,138 more in disposable income under McCain's plan, and $3,631 more under Obama's. This average increase in disposable income is the combination of lower taxes on the average family, higher employment, and increased growth under both plans. By 2018, family-of-four disposable income under McCain is forecast to be $9,750 (after inflation) higher than baseline. This same family unit would see its inflation-adjusted disposable income surpass the baseline by $5,620 under Senator Obama's plan.

A Reader's Guide
This report frequently refers to the "baseline" when describing the effects of each candidate's tax plan on the economy and federal finances. What exactly does this term mean?
The baseline view of the future economy (including federal finances) is that no additional tax policy or spending changes are enacted. In other words, the baseline is a forecast of future economic activity under currently enacted law.[3] For example, future economic activity reflects the fact that the tax reductions enacted in 2001 and 2003 expire when current law dictates that they do so. The lower tax rates enacted in 2001 are scheduled to expire at the beginning of 2011.
Tables 1 and 2 in the Appendix show a set of forecasts for most of the leading economic and fiscal indicators. In each case, the effects (of forecasts) of the McCain and Obama tax plans are compared to the baseline, and a difference is shown between that baseline and how the candidate's tax proposal would affect the economy.
However, this report examines only the candidates' tax proposals, not their spending plans. Campaigns offer candidates ample opportunities to present their tax and spending ideas, but very little time for working through the specifics of their proposals. Spending plans are particularly subject to this time constraint.
Details are important to estimating the economic effects of policy change. Campaign tax proposals usually lend themselves to such an analysis, but this is rare for spending plans.
The McCain Tax Plan
President Bush's tax policy was delineated by two major pieces of legislation: the 2001 Economic Growth and Tax Reduction Reconciliation Act (EGTRRA) and the 2003 Jobs and Growth Tax Reduction Reconciliation Act (JGTRRA). Both of these acts significantly reduced tax rates for all income earners but are due to expire on January 1, 2011. The foundation of Senator McCain's tax plan is primarily composed of the permanent extension and, in some cases, expansion of provisions in both acts:
- Keep capital gains and dividends rates at 0 percent or 15 percent, depending on the taxpayer's income;
- Keep the child tax credit at $1,000 instead of letting the credit drop back to $500 in 2011 and maintain marriage-penalty relief;
- Maintain reductions in the marginal tax rates from 39.6 percent to 35 percent, 36 percent to 33 percent, 31 percent to 28 percent, and 28 percent to 25 percent, and retain the 10 percent tax bracket;
- Add a new provision that would raise the dependent-child tax credit annually by $500 from 2010 to 2016, increasing the credit from $3,500 to $7,000;
- Double the personal exemption for dependents from $3,500 to $7,000;
- Increase the exemption of the estate tax from $1 million to $5 million and lower the estate tax rate from 55 percent to 15 percent.
- Phase out the Alternative Minimum Tax (AMT).[4]
Family Tax Relief. In addition to the tax proposals mentioned earlier, Senator McCain has proposed other ways of granting tax relief to families and middle-income earners. These provisions are not modeled because some, like the gas tax repeal, are not likely to be effective in future years. These provisions include:
- Offer the option of filing taxes through the current process or through a new, simplified system;
- Suspend the 18.4-cent gas tax and 24.4-cent diesel tax from Memorial Day to Labor Day; and
- Offer a $5,000 tax credit for an individual who purchases a zero-emissions car.
Pro-Growth Tax Cut Elements Maintained. Key elements of JGTRRA would also be made permanent. The taxation on dividends and capital gains would continue to decline to 0 percent for filers below the 25 percent bracket. Taxpayers in higher brackets would pay lower taxes on dividends and capital gains. The tax rate on capital gains for these taxpayers declined from 20 percent to 15 percent under JGTRRA, which also changed the treatment of dividend income. Dividends are no longer considered ordinary taxable income, but instead are taxed at the same rate as long-term capital gains.
Dependent-Exemption Increase. A new tax cut proposal is intended to increase the exemption for dependents, which are usually children but can also be other household members who rely on the taxpayer for support. The current exemption is $3,500 for 2008, and a President McCain would eventually double this exemption. Families with children would be the biggest beneficiaries, since they are most likely to have the most dependents.
While Senator McCain phases in the exemption extension, families with income under $50,000 a year are immediately eligible for the full $7,000 exemption starting in tax year 2009. For a single filer in the 15 percent bracket, this doubling of the exemption would be worth $525; for a married couple in the 25 percent bracket, the doubling of the exemption would be worth $1,850.
The Estate Tax. Senator McCain's plan also calls for raising the exemption and cutting the tax rate for the estate tax. While the estate tax is entirely eliminated in 2010 under the current Bush plan, the estate tax returns in 2011 after the Bush tax cuts expire. Effectively, McCain's proposal would raise the exemption for estates from $1 million to $5 million while cutting the tax rate from 55 percent to 15 percent. This would ensure that fewer Americans are subjected to the estate tax and that those who are will incur a tax rate markedly lower than the current one. In this report, we assume that the exemption is similar to current law and not indexed for inflation.
Health Care. Senator McCain also proposes the creation of a direct, refundable tax credit to offset the costs of health insurance. The credit would be $2,500 for individuals and $5,000 for families and could be redeemed to help pay for health insurance purchased privately or provided through an employer. If health plan premiums are less than the amount of the credit, any excess will be deposited into the individual's Health Savings Account to be used for other health care expenses. As mentioned previously, this proposal is not modeled in the analysis.
Business Taxes. Both small businesses and large corporations are affected by McCain's tax plan. His campaign has proposed to make several changes in the tax code that would cut the tax rate for corporations from 35 percent to 25 percent by 2015. Another McCain proposal is to allow the immediate expensing of equipment investment by businesses from 2009 to 2013.
The Parameters of this Report
The results in this paper are based on the candidates' own specific tax policy proposals. The analysts at the Center for Data Analysis who worked on this report tried, wherever possible, to model the candidates' ideas about tax policy. However, not every proposal had advanced beyond initial conceptualization at the time of this report's publication. For example, vague proposals such as eliminating tax breaks for special interests are not modeled.
More significantly, this paper does not attempt to model the spending bills of the two candidates, nor does the paper attempt to square the budgetary claims of the candidates with their tax cuts.
Senator Obama has voted for the pay-as-you-go (PAYGO) budgetary restrictions, which require that any tax cuts or entitlement spending hikes be offset by a choice of other tax or entitlement reforms. This paper assumes that Senator Obama's plan does not hold to these PAYGO restrictions when comparing the effects of his tax plan to the Congressional Budget Office (CBO) baseline.[5] If Senator Obama were held to the PAYGO standard, he would be required to enact new, unspecified tax hikes to pay for his tax plan. The Obama campaign believes that a more accurate baseline is to assume the permanent extension of the Bush tax cuts, but this analysis uses the CBO baseline.
Likewise, the paper does not attempt to model Senator John McCain's claim that he will balance the budget in four years. Senator McCain's plan cuts taxes more than Senator Obama's, and would require even more budget offsets to balance the budget. The McCain campaign would also like to use a baseline that has a permanent extension of the Bush tax cuts, instead of using the CBO baseline.
This analysis also does not include changes in the health care system. Not modeling the health care plans of the candidates will ensure that the comparison will be similar in scope.
The Obama Tax Plan
Senator Obama's plan will make several provisions of President Bush's tax cuts permanent. Significantly, Senator Obama proposes that capital gains and dividends be taxed at the same rate. He would raise taxes on those making more than $250,000 a year, effective in 2009, by repealing the Bush tax cuts for those taxpayers.
Some Expiring Provisions from 2001 and 2003 Made Permanent. Senator Obama also extends several provisions of the 2001 and 2003 tax bills:
-
Marriage penalty relief;
Increase Taxes on High-Income Taxpayers. Senator Obama rolls back the tax cuts for people who make $250,000 a year or more-taxpayers who are considered wealthy. While there is some uncertainty about the details of his plan, Obama campaign materials indicate that the tax rates in the top two brackets would increase to their pre-EGTRRA levels of 36 percent and 39.6 percent. The phase-out of deductions and exemptions for taxpayers in the top brackets would also be re-enacted, which would further increase the top marginal tax rate. Tax rates on capital gains and dividends would also increase up to 20 percent for those filing in the top two brackets.
The Obama campaign anticipates that tax increases in the top two brackets would raise substantial revenue that would pay for other tax cuts and new spending programs. Compared to the current-law baseline, however, the Obama plan would reduce receipts after tax year 2010 because the current CBO baseline already takes into account the increase in top rates beginning in 2011. After 2010, there is a net reduction in tax liability for taxpayers in the top two brackets. Revenue in these years would be less than currently projected because taxpayers in the top two brackets benefit from rate reductions in the other tax brackets.
Social Security Surtax. Senator Obama has also proposed an additional tax on individuals with annual income above $250,000 to help supply Social Security. The Obama campaign has released few details of this tax, and has stated that it will be somewhere between 2 percent and 4 percent and not effective until 2018.[6] The campaign has not announced whether it will be only on additional wages and salary, or whether it is a surtax on all types of income above $250,000. Furthermore, it is unknown whether Social Security benefits will be paid for the additional taxes collected. It is estimated that only 15 percent of the Social Security shortfall will be reduced by this additional tax.[7] While Senator Obama deserves credit for addressing the looming Social Security crisis, additional adjustments beyond those in his plan will be needed to make the program solvent. If these adjustments come in the form of higher taxes beyond those already in the Obama plan, then economic activity will decline, decreasing incentives to work, save, and invest.
Extension of the AMT Patch. The Obama plan would extend the Alternative Minimum Tax relief of the current policy in recent years by indexing the thresholds for inflation and allowing individuals to claim personal tax credits.
Child and Dependent Care Tax Credit. The Obama plan would make the child and dependent care credit refundable, and it would increase the rates and thresholds for phase-out of the rates for households earning less than $60,000. This change would increase the maximum credit by $450 for one dependent and $900 for two or more dependents.
Higher-Education Tax Credit. Senator Obama has proposed an American Opportunity Tax credit, which is a new higher-education tax credit that is an expanded version of the existing Hope Scholarship Tax Credit. Currently, the Hope credit allows taxpayers to take a non-refundable tax credit equal to 100 percent of the first $1,200 of qualified education expenses plus 50 percent of the next $1,200. Senator Obama's credit would be fully refundable and apply to the first $4,000 of college expenses.
One hundred hours of community service would be required to receive the benefit. The proposed credit is refundable, which would allow taxpayers to receive a benefit even if they do not pay federal income tax. Based on available information about the plan, it appears that the current-law income phase-out would also apply to the new credit.
Tax Credits for Low-Income Filers
Senator Obama's plan uses the tax code to increase the income of low-income workers with the following.
Making Work Pay Credit. Senator Obama has proposed a refundable tax credit for low-income earners. Workers would receive a 6.2 percent credit on the first $8,100 of earned income, yielding a maximum credit of about $500 per person, or $1,000 per family. This credit would begin phasing out at an annual income $75,000 for single filers and $150,000 for couples.
Expansion of the Earned Income Tax credit (EITC). The Obama plan includes an expansion of the EITC, including an increase in the income cap, thresholds for phase-out of the credit, and an increase in the credit rate for families with more than two children. These changes will mean that the maximum tax credit for these families would double from $555 to $1,100 in 2012. Workers without children would also receive a larger credit under Senator Obama's plan, because the phase-out for the EITC for those without children will be almost doubled over the next few years.
Exemption for Low-Income Seniors. Senator Obama has also introduced a tax exemption for seniors earning less than $50,000. Many seniors in this income bracket are paying few taxes under the current system, but they would be exempted from all income taxes under Obama's proposal. This exemption would not affect any refund the senior is currently due. Married couples must both be over 65 to be eligible, and the combined income must fall below $50,000. The Obama campaign has indicated that this exemption will be phased out, but has provided no details on the phase-out rate or level.
Static and Dynamic Analysis of the Candidates' Tax Plans
Static analysis assumes that there will be very few behavioral changes in response to tax cuts or tax hikes. Individuals will not alter their labor or investment behavior.
Using static methods, the McCain plan is estimated to reduce tax revenue by $4.0 trillion over a 10-year period from fiscal year (FY) 2009 to FY 2018. (See Table 3 in the Appendix.) Ninety-two percent of this reduction originates from tax reductions associated with supply-side economic incentives such as the reduction in marginal individual tax rate and reduced taxes for qualified dividends and capital gains.
The Obama plan is smaller with $3.4 trillion in reduced tax revenues. (See Table 3 in the Appendix.) Approximately 48 percent of the tax cut stems from a series of new tax credits and extensions of existing tax credits. The new "Making Work Pay" tax credit is about the same size as the extension of parts of President Bush's tax cuts. About a quarter of the tax cut is through supply-side tax cuts, such as the lower marginal rates. Senator Obama's plan raises $281 billion in revenue by increasing both the capital gains and dividends taxes to 20 percent as compared to a 15 percent tax rate.
Dynamic Macroeconomic Analysis of the Tax Plans. The dynamic analysis assumes that individuals and businesses react to real-world changes in income and costs. As a result, economic growth changes, and can lead to higher or lower tax receipts than under the static scoring. Economic growth means that tax cuts will reduce government revenues to a lesser degree than a static analysis predicts.
Economic Growth from John McCain's Plan. Table 1 in the Appendix contains year-by-year (in fiscal years) results for key economic indicators from the dynamic simulation of the McCain tax plans by the Center for Data Analysis. All figures reported here are adjusted for inflation and referenced relative to projected U.S. economic performance under current law (the baseline).

The CDA analysis found that the McCain tax plan will:
The McCain tax plan proposes lower tax rates on businesses. This lowers the cost of doing business and frees more resources for employment in the actual operations of the business. That is, more people are hired, more raw materials can be purchased (creating jobs at other firms), and more research and development can be undertaken. The latter helps firms find ways to be more competitive and produce more of the goods and services it is in the business of producing.
The lower tax rate on corporations works by freeing up resources and allowing the U.S. to be more competitive in the global economy. Better communication and transportation technologies (among other things) are making it easier than ever for businesses to locate in whatever country provides the most business-friendly environment. Reducing the tax liability for corporations located in the U.S. allows the U.S. to stay competitive with the many countries around the world that have already cut their corporate tax rates.[8] The U.S. can then attract more businesses. More businesses mean more job and income opportunities for individuals in the U.S. The growth in the differences between the forecast of the McCain plan and the baseline for both of these macro variables (income and employment) shows this effect. (See Chart 5.)
The McCain tax plan also proposes an accelerated depreciation expense for equipment and technology by allowing a deduction in the first year. When businesses purchase new equipment they can only expense the amount by which the equipment depreciates each year (rather than the full purchase cost of the equipment). Accounting for investment cost through a multi-year depreciation expense recognizes that the equipment will be used to generate income for the firm for more than one year. Businesses pay a tax on the net income they earn (that is, after they expense what it costs them to earn that income). The higher the amount that a business can expense as depreciation each year means the less taxable income for which it is liable. This gives businesses an incentive to make new investment purchases. It is these purchases that allow businesses to expand their output, hire more workers, and make their employees more productive. These effects can be seen in the higher-employment and disposable-income figures projected under the McCain tax plan.
The additional tax savings, besides giving companies a greater incentive to make investment purchases, also reduces firms' tax expenses, thereby freeing up those resources for business expansion. These reductions trigger an economic process of investment that expands repeatedly for each year of our 10-year forecast period. More investment leads to more output and jobs that leads to more investment, and so forth. This compounding feedback effect can be seen in the growing differences between the baseline and the McCain plan in Table 1 in the Appendix.
The McCain tax plan provides a better investment and business growth environment than the current baseline. Increasing individual savings feeds businesses' and entrepreneurs' investment ideas. These lead to higher employment and income, which results in higher savings, and the loop continues. This environment is conducive for greater job opportunities, greater economic growth, and greater income for individuals and families.
Economic Growth Under Barack Obama's Plan. Senator Obama's tax plan focuses more on the redistribution of income, mostly from taxpayers who earn more than $250,000 a year to middle- and low-income taxpayers. (See Table 2 in the Appendix.) Because Senator Obama relies largely on tax credits to achieve this redistribution, his plan does not find a large economic benefit from lower tax rates, nor a more efficient tax structure. This lower economic performance stems in large part from the modest decreases in marginal tax rates on taxpayers earning less than $250,000 and increases in those rates above that level. The incentive to alter savings, investment, and work behavior is shaped more by changes in the taxes on the additional or marginal dollar earned than on the average dollar.
A dynamic simulation of Senator Obama's plan using the same methodology as for analyzing Senator McCain's plan found that under Senator Obama's tax plan:
It should be noted that both plans add to the federal deficit. Without any changes to current law, annual deficits turn to surpluses around 2012. Both plans eliminate these surpluses. The 10-year sum of Obama's deficits equal $1,330.7 billion. McCain's 10-year deficit stands at $2,461.5 billion, which reflects Senator McCain's larger tax reductions.
Despite these deficits, both plans stimulate more economic activity. Senator Obama's plan boosts the economy by extending some of the pro-growth elements of President Bush's tax cuts. Compared to the CBO baseline, Senator Obama reduces the cost of capital by maintaining the equal treatment of capital gains and dividends that President Bush enacted. Senator Obama does raise the dividend and capital gains rate to 20 percent, which raises the cost of capital more than Senator McCain's tax rate of 15 percent.
However, many aspects of Senator Obama's tax plan generate little economic activity and could actually reduce economic incentives. Senator Obama raises the marginal tax rate on many low- and middle-income taxpayers. Senior citizens also bear a significantly higher tax burden when they declare more than $50,000 in annual income, so seniors are strongly encouraged to work less. Other tax credits, such as one for homeowners who do not itemize, only benefit existing homeowners and spark little additional economic activity.
Tax credits can boost short-term consumption and employment, but tax credits do not change basic incentives to work, save, or invest. Workers and investors are given no reason to work or invest more in response to the tax credits. Furthermore, tax credits complicate the tax code, making it less efficient.
Since over one-third of Senator Obama's tax plan consists of demand-side stimulus through tax credits, economic growth is not as strong as it would be under a similar size tax cut that changed work or savings incentives.
Senator Obama's plan increases economic growth compared to the baseline because his plan reduces the tax on capital below baseline forecasts and cuts the marginal tax rates for many workers. However, economic growth is also constrained by higher taxes for many individuals and small businesses. Tax credits do not produce the same economic growth as rate cuts or tax simplification.
Conclusion
The economy improves under each plan as compared to the baseline. The baseline forecast assumes that all of the Bush tax cuts disappear, which raises the cost of capital and marginal tax rates. Both candidates plan to reduce taxes compared to this scenario.
Senator McCain's plan is substantially better at spurring economic growth than Senator Obama's. This is not surprising, since Senator McCain focuses on economic growth and job creation while Senator Obama focuses on the redistribution of income. As Tax Policy Center Director Len Burman states, "the major themes of the two plans are, in the case of Senator McCain's plan, that the major emphasis is on economic efficiency—cuts marginal tax rates, improves economic incentives…. In the case of Obama's plan, the goal is primarily to improve progressivity…to lower tax burdens on low-income people and raise them on higher-income people."[10] Each presidential candidate achieves his stated goal,with Senator McCain generating the most new jobs, growth, and additional income for individuals. Senator Obama's plan drives up the tax rate for individuals with annual incomes above $250,000 and redistributes money to workers with lower incomes.
William W. Beach is Director of the Center for Data Analysis at The Heritage Foundation; Karen A. Campbell, Ph.D., is Policy Analyst in Macroeconomics in the Center for Data Analysis; Rea S. Hederman, Jr., is Assistant Director of and a Senior Policy Analyst in the Center for Data Analysis; and Guinevere Nell is Research Programmer in the Center for Data Analysis. The authors gratefully acknowledge the contributions of Timothy Busovksy.
Appendix
methodology
Overview
This appendix discusses how Center for Data Analysis (CDA) analysts at The Heritage Foundation performed simulations to estimate the economic and fiscal impact of the Senator John McCain and Senator Barack Obama tax plans. In some cases, information currently available about the proposals did not provide enough details for CDA economists to conduct a quantitative analysis. In such cases, they made assumptions on how the proposals would be implemented described below.
Economic Models. CDA analysts used a version of the Global Insight (GI) U.S. Macroeconomic Model[11] to analyze the macroeconomic fiscal and economic effects of each candidate's tax proposal. The model was adjusted in order that its baseline fiscal and economic projections would be consistent with projections from the January 2007 and January 2008 Congressional Budget Office (CBO) budget and economic reports.[12] The CBO baseline forecast assumes that current law will be unchanged during the 10-year budget window. So, the baseline assumes that tax-law changes resulting from the Economic Growth and Tax Relief Reconciliation Act of 2001 (EGTRRA) will expire after 2010 because of the sunset provisions contained in the law. As a result, the CBO baseline serves as a neutral point against which to compare the effects of the two tax proposals.
CDA analysts also used the CDA personal-income-tax microsimulation model to estimate the change in year-to-year federal revenues for most of the individual income tax proposals. The model simulates the effect of tax law changes for a representative sample of taxpayers. Data for these taxpayers are extrapolated or "aged" to reflect detailed taxpayer characteristics through 2014. The data are aged for consistency with the CBO baseline forecast from the GI model. For purposes of this analysis, the microsimulation produced static revenue estimates. In addition, some behavioral changes resulting from the change in capital gains and dividends tax rates have not been included. (Other forms of tax minimization behavior were included.)
Revenue estimates were calculated by comparing estimated federal receipts under current law to the estimated revenues that would be collected assuming that the candidate's proposals were adopted and the economy under the new law did not differ from the CBO baseline forecast. In general, CDA analysts converted the calendar year static revenue estimates, including those produced by the microsimulation model, into annualized quarterly estimates for use in the GI model.
Changing Regular Tax Rates
Revenue Estimate. The average effective personal-income-tax-rate variable in the GI model was adjusted to produce static revenue estimates equal to those generated by the microsimulation tax model.
Economic Effects. Changes in marginal personal tax rates alter the after-tax return on the marginal dollar of labor income. Microeconomic theory suggests that increases in the marginal after-tax return on labor also increase the incentive to work and, therefore, labor force participation. CDA analysts simulated how changes in personal income tax rates would affect work incentives by estimating the amount that the labor force participation rate in the model would change in response to the individual income tax proposals.
A meta-study conducted by the CBO found elasticity estimates ranging from 0.1 to 0.2 percent.[13] In other words, a 1 percent increase in after-tax labor compensation could cause a 0.1 percent to 0.2 percent increase in labor force participation. For this simulation, a labor force adjusted elasticity of 0.17 percent (measured as a share of the overall baseline labor compensation) was used to estimate the change in labor force participation. An elasticity on hours of 0.096 percent also was employed.
Changing Capital Gains and Dividend Tax Rates
Revenue Estimate. CDA analysts used the microsimulation tax model to estimate differences in collections resulting from extension of the low rates on capital gains and dividends in McCain's proposal, and the changes to these rates in Obama's proposal. The revenue effects of changing the capital gains and dividends tax rates were simulated in the GI model by adjusting the average personal income tax rate.
Economic Effects. Although the capital gains and dividend tax rates are applied to individual income, these proposals change the tax rate on income generated by the corporate sector of the economy. The GI model lacks a variable that measures personal taxation of corporate income. To simulate this provision, CDA analysts incorporated the economic effects of changes in personal taxation of corporate income by adjusting the top federal tax rate on corporate income without altering the average tax rate on corporate income. This approach allowed the revenue change resulting from each candidate's proposal to be represented accurately as a change in personal income tax collections; yet it also allowed the model to capture the effect that each tax-change proposal would exert on the after-tax return to capital in the economy.
Separate percentage changes in capital gains and dividend tax rates were calculated by dividing the estimated revenue differences by the appropriate tax base. A weighted average of the change in the two rates was computed to represent the overall increase or decrease in taxation of corporate income resulting from personal income tax proposals. This weighted average took into account the share of each type of corporate income in total corporate income, the proportion of each type of corporate income that is taxable as individual income, and the estimates of the effective tax rate on each type of corporate income.[14] Changes in this tax rate have a direct effect on the after-tax return to capital in the economy.[15]
Extending Expiring Provisions and Creating New Tax Credits
CDA economists used the microsimulation tax model to estimate differences in collections resulting from making permanent the 10, 15, 25, and 28 percent individual income tax brackets; the higher child tax credit; the Alternative Minimum Tax relief and extended relief under McCain's proposal; and the extension of the marriage penalty relief. Revenue collections also differed on the basis of Obama's itemized-deduction income thresholds.
Obama's proposed "Making Work Pay" credit, "American Opportunity Tax credit," his exemption of seniors earning less than $50,000, his expansion of the child and dependent care credit, and his proposed expansion of the earned income credit were also modeled through microsimulation.
Modifying the Estate Tax
Revenue Estimate. CDA analysts used a Congressional Budget Office estimate of estate tax revenues under current law as the basis for its calculations of the two candidates' estate tax plans. CDA researchers applied a set of equations to approximate the revenue differences caused by the McCain and Obama proposals. Because the estate tax is a tax on wealth, not on income, CDA analysts reflected the revenue differences by adjusting a variable in the GI model that represents tax collections not related to income flows captured in the National Income and Products Accounts (NIPA).
Economic Effects. CDA researchers estimated two behavioral effects associated with the estate tax proposals. First, CDA analysts estimated the economic effects of amounts spent on tax-avoidance activities by owners of estates that might be subjected to the estate tax. It was assumed that tax-avoidance spending by the individuals was a response to long-run rather than short-run changes in the estate tax law. Taking into account that the longer time period reflects the assumption that tax-avoidance activity is related to the estate tax, it is optimized for the estate tax law prevailing in the year the estate owner expects to die, not for any year before that.[16]
CDA analysts adjusted the GI model's price index for miscellaneous business services in order to reflect changes in the demand for estate-tax-avoidance services resulting from changes in the estate tax law. The business-services price-deflator variable was adjusted so that nominal spending on miscellaneous business services changed by 30 cents for every dollar of change in the long-run projection of federal estate tax collections.[17] The inflation-adjusted consumption of miscellaneous business services was not assumed to change under either candidate's proposal for the estate tax.
A change in the cost of capital was also an assumed occurrence as a result of changes in the estate tax. Because it is a tax on capital, the estate tax increases the minimum rate of return sought by investors. This minimum return is an assumed factor in the decision to engage in new projects. All other things being equal, projects that do not have projected returns above the minimum will not be initiated.
Previous research indicates that if the estate tax had been repealed prior to 1997, the required return on investments would have fallen by approximately 3 percent.[18] CDA analysts reduced this estimate by 0.54 to reflect the 1997 reduction in top federal estate tax rates. The percentage was further adjusted in the simulation of the Obama proposal to reflect the continued, albeit somewhat diminished, existence of the estate tax under his proposal. A variable in the model representing the 10-year Treasury bond rate was reduced to reflect a reduction in the minimum required rate of return on capital.
Federal Funds Rate. A variable in the GI model was set to allow actions by the monetary authority, as simulated in the model, to adjust the federal funds rate. With these settings, the federal funds rate tends to increase or decline when the unemployment rate declines or increases, the Consumer Price Index increases or declines, or the Consumer Price Index accelerates or decelerates.
Employment Effects by State. State estimates for employment changes attributable to the two tax plans were calculated by adjusting the national employment estimates reported in this paper according to the state's share of national employment. For example, the population of employed people in California accounts for almost 12 percent of employment nationwide. In order to calculate the percentage of jobs California would potentially gain as a result of the candidates' tax plans, this percentage was multiplied by the national estimates of job changes from the macro model. State employment data for July 2008 were collected from the Bureau of Labor Statistics.[19]
- Doubled child tax credit ($1,000);
- Earned-income credit expansion for married couples;
- 10 percent tax bracket;
- Reductions in all regular income tax rates except the top two; and
- Tax cuts on dividends and capital gains for taxpayers in all but the top two brackets, which will increase from 15 to 20 percent.
-
Expand output. GDP will be, on average, $283.7 billion higher over the 2009 to 2018 horizon. Real (inflation-adjusted) GDP growth is between 0.2 and 0.5 percent higher than the baseline. The expansion in the U.S. economy is largely due to the incentives to save and invest in productive capital and technology through reductions in capital gains and dividend taxes, and accelerated expensing of depreciation for capital purchases. These incentives are enhanced by a substantial reduction in the tax rate on corporate income, which lowers consumer costs and allows corporations to expand their investments.
-
Increase employment. Total employment increases an average of 2.13 million jobs over the next 10 years. Peak job increases over the baseline are 3.4 million additional jobs in 2018. The difference between the number of jobs under the McCain plan and the baseline increases each year. The corporate income tax reductions and the incentives for saving and investment allow business owners to expand their operations and increase their investment in new equipment. Investment leads to expanded output that, in turn, increases personal incomes and employment.
-
Increase disposable personal income. The McCain tax plan is projected to increase a person's disposable income as much as $2,438 above the baseline. A family of four is projected to have $9,750 more disposable income than the current baseline and an average of $5,138 more after-tax income than the baseline over the next 10 years.
- Boost the personal savings rate. McCain's tax plan provides support for greater levels of personal savings, a particularly important development given the tsunami of entitlement spending expected over the next five decades. The personal savings rate is 2.5 times higher than the baseline. In 2018, for instance, the baseline requires a personal savings rate of 2 percent of income. The McCain plan raises the rate to 4.9 percent of personal income. That increase in the rate translates to substantial increases in total savings. The baseline forecast requires an annual average level of personal savings of $3.1 billion (after inflation). The McCain plan raises that annual average to $212 billion, or a 68-fold increase over baseline levels.
-
GDP grows due to increased consumption. The level of output in the economy as measured by the GDP jumps by an average of $101.7 billion (after inflation) in Obama's plan. By 2018, the difference between baseline and the forecast is $187.2 billion in additional output, or about a 1.2 percent increase in the level of GDP. Nearly all of this increase stems from personal consumption expenditures. The consumption of households grows by an average of $146.9 billion, and government consumption expands by $6.6 billion. Indeed, household consumption outlays jump by $235.2 billion above baseline in 2018, and over the entire 10-year period average $146.9 billion above what they would have been without Senator Obama's plan. Net exports, however, fall by an average of $59 billion, indicating that imports (which subtract from GDP) grow more rapidly than exports did in his plan. Gross private domestic investment increases by an average of $4.2 billion.[9]
-
Employment grows modestly. The Obama plan encourages job growth principally through boosting consumption. Average job increases equal 915,800 over the 10-year period. Private-sector employment averages 814,700 additional jobs. The difference between the two results equals public-sector employment growth above the baseline, or an average of 101,100 new government jobs per year. These numbers would have been bigger had the Senator not raised tax rates on upper-income taxpayers.
-
Incomes rise. Senator Obama's plan extends the Bush tax reductions for taxpayers with adjusted gross incomes below $250,000 a year, and this "hold harmless" provision in his plan causes higher after-tax incomes. For a family of four, disposable income (after inflation) rises by an average of $3,631 over the forecast horizon. By 2018, after-tax income has increased by $5,620.
- Savings increase. The modest boosts to income stemming from the extension of the Bush tax reductions in Obama's plan lead to increased savings. Personal savings increase by an average $135 billion (after inflation) between 2009 and 2018.