Chairman Bishop and Members of the Committee, thank you for the opportunity to testify about the social cost of carbon. My name is Kevin Dayaratna. I am the Senior Statistician and Research Programmer at The Heritage Foundation. The views I express in this testimony are my own and should not be construed as representing any official position of The Heritage Foundation.
It seems to be a fundamental goal of the Obama Administration to expand regulations across the energy sector of the economy. One of the primary metrics that the Administration has used to justify these regulations is the social cost of carbon (SCC), which is defined as the economic damages associated with a metric ton of carbon dioxide (CO2) emissions summed across a particular time horizon.[1]
The Models
There are three primary statistical models that the Interagency Working Group (IWG) uses to estimate the SCC—the DICE Model, the FUND model, and the PAGE model.[2] Over the course of my work at The Heritage Foundation, my colleagues and I have used the DICE and FUND models, testing their sensitivity to a variety of important assumptions. Our work has repeatedly illustrated that while these models might be interesting for academic exercises, they are far too sensitive to the modeler’s assumptions to be legitimate tools for regulatory policy.[3]
These models are estimated by Monte Carlo simulation. The general idea behind Monte Carlo simulation is that since some aspects of the models are random, the models are repeatedly estimated to generate a range of probable outcomes. As a result of fundamental principles in probability theory, repeated estimation for a sufficient amount of time reasonably characterizes the distribution.
As with any statistical model, however, these models are grounded by assumptions. In our work, my colleagues and I have rigorously examined three important assumptions: the choice of a discount rate, a time horizon, and the specification of an equilibrium climate sensitivity distribution.
Discount Rate
Because there are a host of investment opportunities, providing benefits for the future can be achieved in a host of ways. Discounting future benefits and costs to a common year is the tool economists use to measure the impact of a program compared to other possible investments. The discount rate should reflect the return on generally achievable alternative investments. The Environmental Protection Agency has run these models using 2.5 percent, 3 percent, and 5 percent discount rates despite the fact that the Office of Management and Budget guidance in Circular A-4 has specifically stipulated that a 7 percent discount rate be used as well.[4] At Heritage, we re-estimated these models using a 7 percent discount rate and obtained the following results.
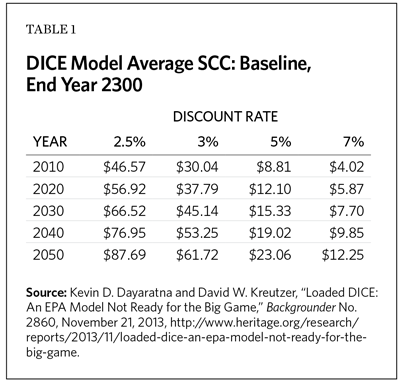
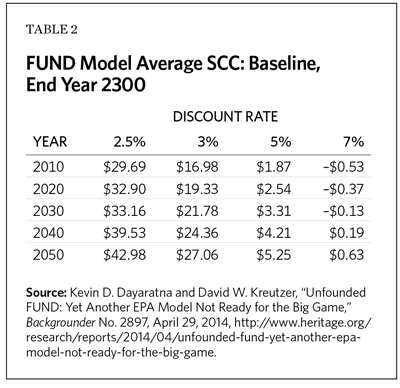
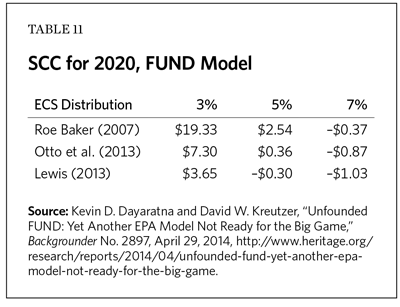
As we can see, the SCC estimates are drastically reduced under the use of a 7 percent discount rate. In fact, under the FUND model, the estimates are negative, suggesting that there are actually benefits to carbon dioxide emissions.
Time Horizon
Our Founding Fathers almost surely would have had no ability to predict what the American economy looks like today. Similarly, we have no idea what the American economy will look like 300 years from now. Regardless, these SCC models are based on projections that are far out into the future. In my work at Heritage, I have changed this time horizon to the significantly less, albeit still unrealistic, time horizon of 150 years into the future, and we obtained the following results for the DICE model.
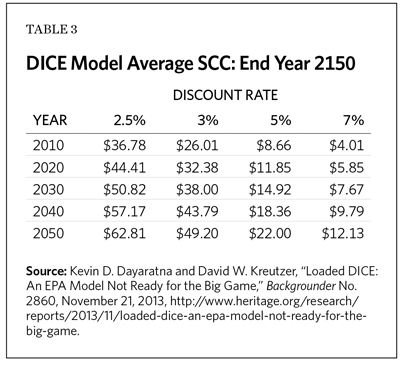
Clearly, the SCC estimates drop substantially as a result of changing the end year (in some cases by over 25 percent).
Equilibrium Climate Sensitivity Distribution
Estimating the SCC requires the specification of an equilibrium climate sensitivity (ECS) distribution. Scientists concur that the earth’s temperature warms in response to carbon dioxide emissions. The real question, however, is how much warming would actually occur in response to a certain change in carbon dioxide emissions. ECS distributions quantify the earth’s temperature response to a doubling of carbon dioxide emissions in terms of probabilities.
The ECS distribution used by the IWG is based on a paper published in the journal Science eight years ago by Gerard Roe and Marcia Baker. Since then, a variety of newer and more up-to-date distributions have been suggested in the peer-reviewed literature. Many of these distributions, in fact, suggest lower probabilities of extreme global warming in response to carbon dioxide emissions.[5]
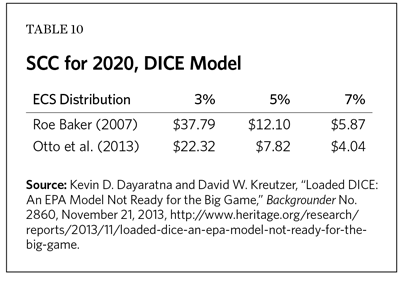
Using the more up to date ECS distributions (Otto et al. (2013) and Lewis (2013)), we notice drastically lower probabilities of extreme global warming. At Heritage, we re-estimated the SCC having used these more up-to-date ECS distributions and obtained the following results.
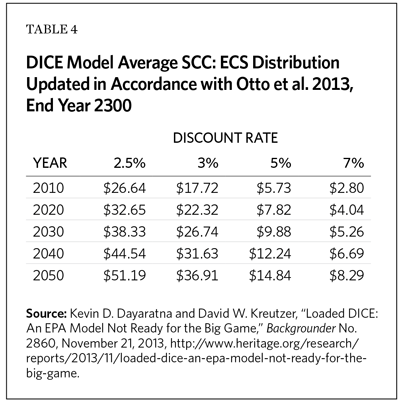
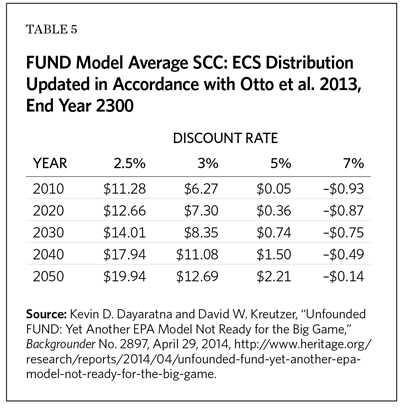
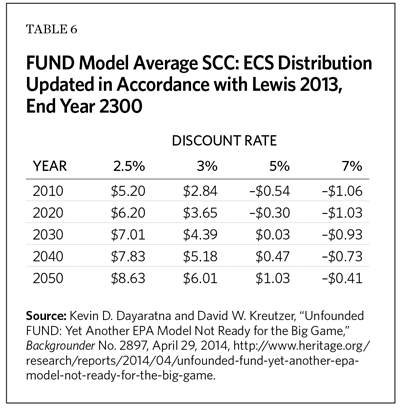
Again, we notice drastically lower estimates of the SCC using these more up-to-date ECS distributions. These results are not surprising—the IWG’s estimates of the SCC were based on outdated assumptions that overstated the probabilities of extreme global warming, which artificially inflated their estimates of the SCC.
Negativity
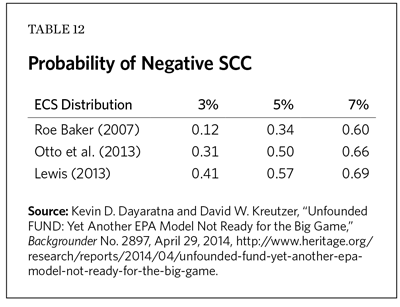
When people talk about the social cost of carbon, they tend to think of damages. Not all of these models, however, suggest that there are always damages associated with carbon dioxide emissions. The FUND model, in fact, allows for the SCC to be negative based on feedback mechanisms due to carbon dioxide emissions. In our work at Heritage, we actually calculated the probability of a negative SCC under a variety of assumptions.
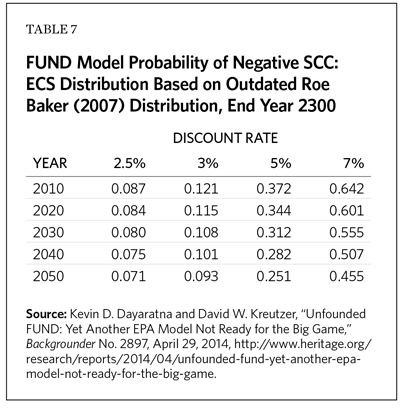
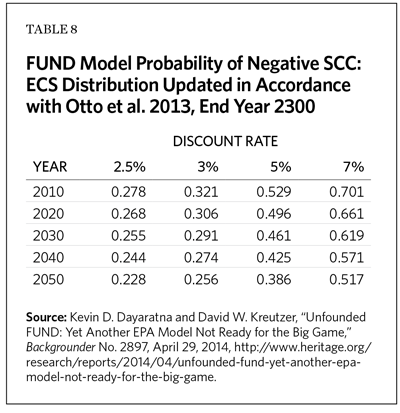
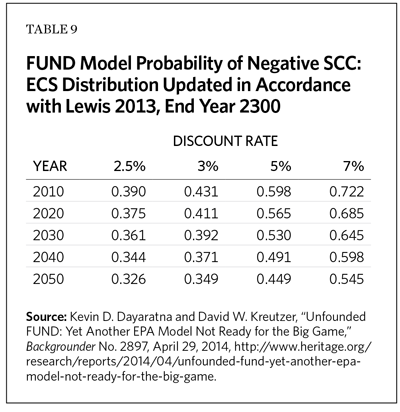
Interestingly, under a reasonable set of assumptions, the SCC is overwhelmingly likely to be negative, which would suggest the government should, in fact, subsidize (not limit) carbon dioxide emissions. I do not use these results to suggest that the government should actually subsidize carbon dioxide emissions, but rather to illustrate the extreme sensitivity of these models to reasonable changes to assumptions.
Economic Consequences
Our results clearly illustrate that the models used to estimate the SCC are far too sensitive to reasonable changes in assumptions to be useful tools for policymaking. Even if we were to actually take these models seriously and implement the associated regulations, the results would be very costly. Our research at Heritage has shown that by 2030, we would suffer a peak employment shortfall of over 1,000,000 lost jobs and over 500,000 manufacturing jobs with a negligible impact (less than two-tenths of a degree Celsius) on global temperatures.[6]
Conclusion
The SCC is based on statistical models that are extremely sensitive to various assumptions incorporated within the models. The following tables summarize this sensitivity for the year 2020.
Moreover, the damage functions that the estimates are based on are essentially arbitrary with limited empirical justification. Even if one were to take their results seriously, their use would result in significant economic damages with little benefit to reducing global temperatures. As a result, these models, although they may be interesting academic exercises, are far too unreliable for use in energy policy rulemaking.
Endnotes
[1] The official definition of the social cost of carbon is the economic damages per metric ton of C02 emissions, and is discussed further in U.S. Environmental Protection Agency, “The Social Cost of Carbon,” http://www.epa.gov/climatechange/EPAactivities/economics/scc.html (accessed September 14, 2013).
[2] For the DICE model, see William D. Nordhaus, “RICE and DICE Models of Economics of Climate Change,” Yale University, November 2006, http://www.econ.yale.edu/~nordhaus/homepage/dicemodels.htm (accessed November 6, 2013). For the FUND model, see “FUND—Climate Framework for Uncertainty, Negotiation and Distribution,” http://www.fund-model.org/ (accessed November 6, 2013). For the PAGE model, see Climate CoLab, “PAGE,” http://climatecolab.org/resources/-/wiki/Main/PAGE (accessed November 6, 2013).
[3] Kevin D. Dayaratna and David W. Kreutzer, “Unfounded FUND: Yet Another EPA Model Not Ready for the Big Game,” Heritage Foundation Backgrounder No. 2897, April 29, 2014, http://www.heritage.org/research/reports/2014/04/unfounded-fund-yet-another-epa-model-not-ready-for-the-big-game; Kevin D. Dayaratna and David W. Kreutzer, “Loaded DICE: An EPA Model Not Ready for the Big Game,” Heritage Foundation Backgrounder No. 2860, November 21, 2013, http://www.heritage.org/research/reports/2013/11/loaded-dice-an-epa-model-not-ready-for-the-big-game; and Kevin D. Dayaratna, and David Kreutzer, “Environment: Social Cost of Carbon Statistical Modeling Is Smoke and Mirrors,” Natural Gas & Electricity, Vol. 30, No. 12 (2014), pp. 7–11.
[4] Office of Management and Budget, “Circular A-4,” White House, http://www.whitehouse.gov/omb/circulars_a004_a-4/ (accessed September 14, 2013), and Paul C. “Chip. Knappenberger, “An Example of the Abuse of the Social Cost of Carbon,” Cato-at-Liberty, http://www.cato.org/blog/example-abuse-social-cost-carbon (accessed September 14, 2013).
[5] Gerard H. Roe and Marcia B. Baker, “Why Is Climate Sensitivity So Unpredictable?” Science, Vol. 318, No. 5850 (October 26, 2007), pp. 629–632; Nicholas Lewis, “An Objective Bayesian Improved Approach for Applying Optimal Fingerprint Techniques to Estimate Climate Sensitivity,” Journal of Climate, Vol. 26, No. 19 (October 2013), pp. 7414–7429; and Alexander Otto et al., “Energy Budget Constraints on Climate Response,” Nature Geoscience, Vol. 6, No. 6 (June 2013), pp. 415–416.
[6] Kevin D. Dayaratna, Nicolas D. Loris, and David W. Kreutzer, “The Obama Administration’s Climate Agenda: Will Hit Manufacturing Hard,” Heritage Foundation Backgrounder No. 2990, November 13, 2014, http://www.heritage.org/research/reports/2014/11/the-obama-administrations-climate-agenda-underestimated-costs-and-exaggerated-benefits; Kevin D. Dayaratna, Nicolas D. Loris, and David W. Kreutzer, “The Obama Administration’s Climate Agenda: Underestimated Costs and Exaggerated Benefits,” Heritage Foundation Backgrounder No. 2975, November 13, 2014, http://www.heritage.org/research/reports/2014/11/the-obama-administrations-climate-agenda-underestimated-costs-and-exaggerated-benefits; Nicholas D. Loris, Kevin Dayaratna, and David W. Kreutzer, “EPA Power Plant Regulations: A Backdoor Energy Tax,” Heritage Foundation Backgrounder No. 2863, December 5, 2013, http://www.heritage.org/research/reports/2013/12/epa-power-plant-regulations-a-backdoor-energy-tax; David W. Kreutzer, Nicholas D. Loris, and Kevin Dayaratna, “Cost of a Climate Policy: The Economic Impact of Obama’s Climate Action Plan,” Heritage Foundation Issue Brief No. 3978, June 27, 2013, http://www.heritage.org/research/reports/2013/06/climate-policy-economic-impact-and-cost-of-obama-s-climate-action-plan; David W. Kreutzer and Kevin Dayaratna, “Boxer–Sanders Carbon Tax: Economic Impact,” Heritage Foundation Issue Brief No. 3905, April 11, 2013, http://www.heritage.org/research/reports/2013/04/boxer-sanders-carbon-tax-economic-impact; and Patrick J. Michaels and Paul C. “Chip” Knappenberger, “Current Wisdom: We Calculate, You Decide: A Handy-Dandy Carbon Tax Temperature-Savings Calculator,” Cato Institute, July 23, 2013, http://www.cato.org/blog/current-wisdom-we-calculate-you-decide-handy-dandy-carbon-tax-temperaturesavings-calculator (accessed September 11, 2014).