
With enrollment data now available for the second quarter of 2014, it is possible to construct a complete picture of the changes in health insurance coverage that occurred during the initial implementation of the Patient Protection and Affordable Care Act (PPACA), commonly known as Obamacare. The data show that in the first half of 2014, private health insurance enrollment increased by a net of 2,465,586 individuals. That net figure reflects the fact that 61 percent of the gain in individual coverage was offset by a drop in employer group coverage. During the same period, Medicaid enrollment grew by 6,072,651 individuals. Thus, while a total of 8.5 million individuals gained coverage, 71 percent of that net coverage gain was attributable to the Obamacare expansion of Medicaid to able-bodied, working-age adults.
Changes in Private Coverage Enrollment
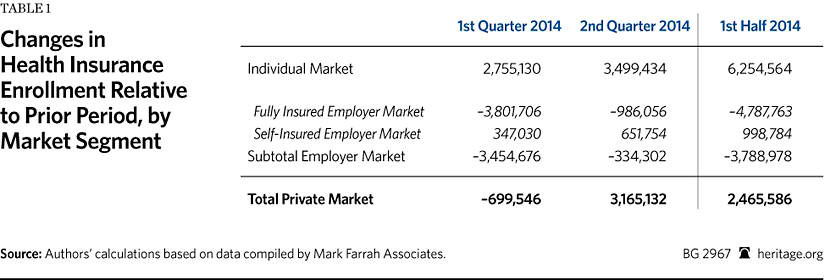
Health insurers file quarterly reports with state regulators, and data from those reports for the second quarter of 2014 are now available.[1] The three relevant market subsets for this analysis are (1) the individual market, (2) the fully insured employer-group market, and the (3) self-insured employer-group market.[2] Table 1 shows the changes in private health insurance enrollment during the first and second quarters of 2014, along with the net changes for the combined six-month period.
Obamacare’s initial open enrollment period began on October 1, 2013, and officially ended on March 31, 2014—though in a number of states it was extended into April to give those who had experienced problems enrolling additional time to complete the process. Because enrollment was for the 2014 plan year, the coverage for those who enrolled during the fourth quarter of 2013 took effect in the new year; thus, those individuals are included in the data for the first quarter (Q1) of 2014. The data for Q2 2014 captures enrollments that occurred during the last two months of the open enrollment period, or which were otherwise delayed due to the numerous problems experienced by the exchanges, and so did not take effect until after the end of the first quarter.
The data show that enrollment in individual market coverage increased by over 2.7 million individuals in Q1 2014 and by a further 3.5 million individuals in Q2. Thus, for the first half of 2014, enrollment in individual market coverage grew by almost 6.3 million individuals.
The second-biggest coverage change that occurred during the first half of 2014 was the decline in the number of individuals with coverage through fully insured employer group plans. Enrollment in such plans dropped by 3.8 million individuals in Q1 2014, and by nearly a million more individuals in Q2 2014. Thus, for the first half of 2014, the number of individuals with coverage through a fully insured employer group plan decreased by nearly 4.8 million.
Enrollment in self-insured employer plans modestly increased in both quarters—by 347,000 in Q1 2014, and by about 652,000 in Q2—for a net enrollment gain of a little less than one million during the first half of 2014. Consequently, the combined enrollment changes in the two segments of the employer group market during the first half of 2014 produced a net decrease of almost 3.8 million in the number of Americans covered by employer-sponsored plans.
That net reduction in employer-sponsored group coverage is explained by employers discontinuing coverage for some or all of their workers or, in some cases, individuals losing access to such coverage due to employment changes. While it is not possible to determine from the data the subsequent coverage status of individuals who lost group coverage, there are only four possibilities: (1) some obtained replacement individual-market coverage (either on or off the exchanges); (2) some enrolled in Medicaid; (3) some enrolled in other coverage for which they are eligible (such as a plan offered by their new employer, a spouse’s plan, a parent’s policy, or Medicare); and (4) some became uninsured.
If individuals lost group coverage, but obtained new coverage under either another employer group plan or one in the individual market, they would then be counted in the enrollment figures for those submarkets. Similarly, if individuals transitioned to Medicaid, they would be counted in the Medicaid enrollment figures reported by the Centers for Medicare and Medicaid Services (CMS).
As Table 1 shows, during the first half of 2014, net total enrollment for all three segments of the private coverage market increased by almost 2.5 million individuals. That was because reduced enrollment in employer-sponsored coverage offset 61 percent of the gain in individual-market coverage during the first half of 2014.
Changes in Medicaid and CHIP Enrollment
The PPACA required states to expand Medicaid eligibility to all individuals with incomes below 138 percent of the federal poverty level and not otherwise eligible for Medicaid under prior rules. Those individuals are able-bodied, working-age adults, the vast majority of whom do not have dependent children. However, in June 2012, the U.S. Supreme Court ruled that Congress could not force states to adopt that expansion. Since then, 27 states and the District of Columbia have chosen to adopt the expansion.
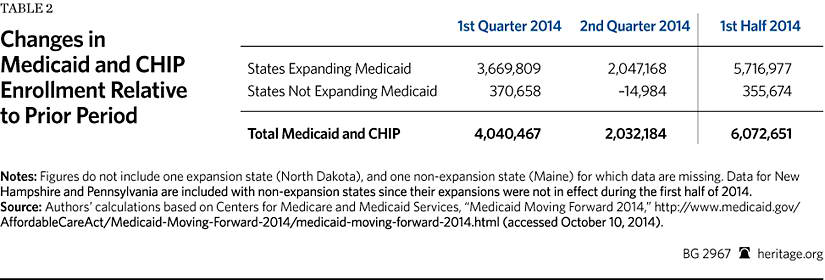
Table 2 shows the changes in Medicaid enrollment during the first and second quarters of 2014, along with the net changes for the combined six-month period.
According to the CMS reports, for the District and the 24 states that had the expansion in effect during the first half of 2014, and for which data are available, total Medicaid enrollment increased by 3,669,809 individuals in Q1 2014 and by a further 2,047,168 individuals in Q2 2014, for a total of 5,716,977 during the first half of 2014.[3]
The law also changed the standards for determining eligibility for individuals who qualify for Medicaid coverage under prior law. Consequently, most of the states that have not adopted the Medicaid expansion also experienced some increase in enrollment. According to the CMS reports, for 24 of the 25 states that either did not adopt the expansion or did not have it in effect during the first half of 2014, Medicaid enrollment increased by 355,674 individuals during the first half of 2014.[4]
Thus, for the 48 states and the District for which data is available, Medicaid and Children’s Health Insurance Program (CHIP) enrollment increased by a total of 6,072,651 individuals in the first half of 2014.
Comparison to Reported Exchange Enrollment
According to the final exchange enrollment report issued by the Department of Health and Human Services (HHS), 8,019,763 individuals selected an exchange plan during the open enrollment period.[5] Yet, the market data for the first half of 2014 show that the net increase in total individual market enrollment (both on and off the exchanges) was 6,254,564 individuals—which equates to 78 percent of the exchange plan selection figure reported by HHS.
The difference is likely attributable to the following factors, though it is impossible to determine the magnitude of each from the available data:
- HHS data specify individuals who selected plans, not purchased coverage. As HHS noted in its reports, its figures are for “pre-effectuated” enrollment—meaning that HHS counted the number of individuals who picked plans, not the number who paid the first month’s premium, which would be necessary for coverage to take effect. It is likely that some portion of the individuals that HHS reported as picking a plan do not show up in the market data because they never completed the transaction.
- Enrollment in exchange coverage by individuals who had non-compliant individual-market coverage that was non-renewed by their carrier. If individuals obtained such replacement coverage they would be included in the market data whether they purchased their new coverage on or off the exchanges, but would only be included in the HHS reports if they obtained their new coverage through an exchange.
- Enrollment in exchange coverage by individuals who lost prior employer-group coverage. Because of the substantial decline in employer-group coverage during the period, it is likely that such coverage transitions explain much of the difference.
- Enrollment in exchange coverage by individuals who were previously uninsured. While it can be presumed that previously uninsured individuals account for the net increase in private coverage of almost 2.5 million, it is also possible that more uninsured individuals gained coverage, but that any additional increase was offset by previously insured individuals becoming uninsured.
Conclusion
While most of the attention has focused on the new health insurance exchanges, the data indicate that a significant share of exchange enrollments were likely the result of a substitution effect—meaning that most of those who enrolled in new coverage through the exchanges during the open enrollment period already had coverage through an individual-market or employer-group plan. Given that increased enrollment in Medicaid accounted for 71 percent of the net growth in health insurance coverage during the first half of 2014, the inescapable conclusion is that, at least when it comes to covering the uninsured, Obamacare so far is mainly a simple expansion of Medicaid.
—Edmund F. Haislmaier is Senior Research Fellow in the Center for Health Policy Studies, of the Institute for Family, Community, and Opportunity, at The Heritage Foundation. Drew Gonshorowski is Senior Policy Analyst in the Center for Data Analysis, of the Institute for Economic Freedom and Opportunity, at The Heritage Foundation.
Appendix: Data Sources and Adjustments
We used the Mark Farrah Associates dataset, derived from insurer regulatory filings, for private-market enrollment by market segment. We excluded, as not relevant to our analysis, enrollments in: Federal Employees Health Benefits plans, Medicare Advantage plans, and supplemental coverage products (such as dental, vision, prescription drug, Medicare supplemental, and single disease).
For enrollment in self-insured employer plans we used the data reported by Mark Farrah Associates for plans administered by an insurance carrier. Mark Farrah compiles that data from insurer regulatory filings, supplemented by other public and private sources, such as Securities and Exchange Commission (SEC) filings. While the firm’s data on the self-insured market is the most comprehensive available, there are no reliable figures for enrollment in self-insured plans that are administered by independent third-party administrators (TPAs)—that is, TPAs that are not a subsidiary of an insurance carrier. However, based on its research, Mark Farrah Associates believes that truly independent TPAs likely account for no more than 5 percent of the total self-insured market.[6]
For Medicaid and CHIP enrollment, we used the figures reported by CMS as they are the most current and include enrollment under both Medicaid fee-for-service and Medicaid managed-care plans. Because the CMS reports do not include enrollment data for December 2013, we used the enrollment figures for that month published in a report by the Kaiser Commission on Medicaid and the Uninsured as the basis for calculating enrollment growth during the first two quarters of 2014.[7]
We made several adjustments to the Mark Farrah Associates private-market data to make it as complete and accurate as possible. Specifically:
- Arkansas has implemented the Medicaid expansion through a unique, “private-option” design. Under that approach qualified individuals are enrolled in the state’s Medicaid program and then, at the beginning of the month following enrollment, select (or are assigned) coverage through a Silver-level plan offered in the exchange, with Medicaid paying almost all of the premiums. However, this unique arrangement could result in double counting those individuals in our analysis. The CMS Medicaid enrollment reports note that their figures for Arkansas Medicaid enrollment include the private-option enrollees, and those individuals do not appear to be included in the HHS reported figures for individuals picking an exchange plan. However, the regulatory filings by carriers offering exchange coverage in Arkansas appear to include private-option enrollees in their enrollment counts for individual-market coverage—which, from the carrier perspective, would be appropriate. That these data sources report private-option enrollees differently also explains why the collective increase in individual-market enrollment among the Arkansas exchange carriers during the period was nearly four times the number of individuals that HHS reported as having picked an exchange plan in Arkansas. Separately, the Arkansas Department of Human Services (DHS) reported that 176,691 individuals had completed private-option enrollment as of the end of June.[8] Consequently, to avoid counting private-option enrollees twice, we subtracted the Arkansas DHS figure from the figure for total individual-market enrollment for Arkansas derived from the Mark Farrah Associates dataset. Thus, our analysis counts Arkansas private-option enrollees as Medicaid enrollees. We believe that this is the correct approach, and the one most comparable to other states, because the Arkansas private-option design is essentially a new variant of Medicaid managed care, and in all other cases individuals covered through private Medicaid managed plans are counted as Medicaid enrollees.
- While the Centene Corporation’s principal business is Medicaid managed care, the company also offers exchange coverage in seven states. In two of those states, Arkansas and Massachusetts, that coverage is offered through a subsidiary that only files annual regulatory reports. Using state-level enrollment data reported in Centene’s Q1 and Q2 2014 SEC filings, we derived figures for the company’s non-Medicaid enrollment growth in those two states and assigned the results to the individual market.
- Blue Cross Blue Shield of Kansas only files annual reports. We contacted the company and obtained its enrollment figures for the three private-market segments as of the end of March and June (the end of the first and second quarters), and corrected the figures in the Mark Farrah Associates dataset accordingly.
- Horizon Blue Cross Blue Shield of New Jersey also only files annual reports. Because it is that state’s dominant carrier and offers coverage on the exchange, we presume that Horizon experienced some increase in individual-market enrollment, and likely some change in fully insured group-market enrollment as well. Consequently, we imputed enrollment changes in those two market subsets for Horizon as follows. We first identified 42 other carriers that all have the same characteristics, namely that they: (1) are Blue Cross carriers; (2) offer coverage on their state’s exchange; and (3) offer coverage on a statewide basis both on and off the exchanges. Using the Mark Farrah Associates data, we found that those 42 comparable carriers reported, for the first half of 2014, an average increase in individual-market enrollment of 43.4 percent, and an average decline in fully insured group-market enrollment of 3.6 percent. We imputed the same changes to Horizon’s enrollment, and adjusted the figures for the company in the Mark Farrah Associates dataset accordingly.
- Eight carriers offered coverage through the exchanges that had not offered coverage in the individual or group markets prior to 2014, and for whom data is missing from the Mark Farrah Associates dataset. Seven are carriers that, prior to 2014, only provided Medicaid managed-care coverage. Three of those carriers are in California and four are in New York. Both states released reports that include figures for exchange enrollment by carrier. Thus, for those seven carriers we used the enrollment figures taken from the state exchange reports.[9] For the eighth carrier, a new consumer operated and oriented plan (CO-OP) insurer (Health Republic Insurance of New Jersey), we used the enrollment figure found in a table of CO-OP enrollment and funding compiled and released by the U.S. House of Representatives Committee on Oversight and Government Affairs. The date for this carrier’s enrollment figure is given as April 11, 2014, in the table.[10]
- Finally, one carrier (Health Alliance) offered coverage in Illinois and Iowa prior to 2014 and also offered coverage in Nebraska through the exchange in 2014, but data for the company’s Nebraska enrollment is missing from the Mark Farrah Associates dataset. However, the company recently announced that, “based on 2014 performance,” it will not be offering coverage in Nebraska in 2015.[11] Thus, the missing figure for this carrier’s Nebraska enrollment is likely quite small.
The net effects of all the foregoing adjustments to the enrollment figures derived from the Mark Farrah Associates dataset were an increase of 95,194 for the individual market, an increase of 66,605 for the fully insured group market, and a decrease of 17,850 for the self-insured group market.


