
The Department of Health and Human Services (HHS) issued a series of monthly reports on exchange performance during the initial open enrollment period (October 1, 2013, through March 31, 2014) for the Patient Protection and Affordable Care Act (PPACA), commonly known as Obamacare. However, the data HHS provided are insufficient for determining either the number of uninsured individuals who gained coverage or the extent of other coverage changes that may have occurred in health insurance markets outside the exchanges.[1]
Since the open enrollment period ended, several organizations have conducted surveys designed to elicit more information about changes in health insurance coverage during Obamacare’s initial implementation.[2] Yet, even well-constructed surveys have their limitations and, at best, can offer only approximate answers.

Now, newly available health insurance enrollment data provide a clearer and more comprehensive picture of the changes in coverage during the initial implementation of Obamacare. Unlike estimates based on survey results, the newly available data provide actual enrollment counts for the private market, Medicaid, and the Children’s Health Insurance Program (CHIP). While the new data cannot answer all the questions, they do provide a more definitive picture of the net changes in coverage that occurred during the fourth quarter (Q4) of 2013 and first quarter (Q1) of 2014.
During the six-month period, the biggest change in the private market was not the expansion in individual-market coverage, but the decline in fully insured employer group coverage. Moreover, the data also indicate that more than half of any increase in coverage during 2014 will be due to Obamacare’s Medicaid expansion to able-bodied adults without dependent children.
Changes in Private Coverage Enrollment
Health insurers file quarterly reports with state regulators, and data from those reports for Q1 2014 are now available.[3] The three relevant market subsets for this analysis are: (1) the individual market; (2) the fully insured employer group market; and (3) the self-insured employer group market.[4] Table 1 shows the changes in private health insurance enrollment during Q4 2013 and Q1 2014, along with the net changes over the combined six-month period.
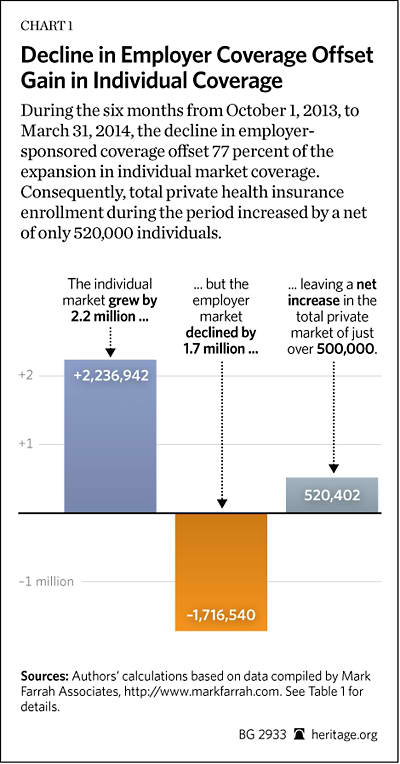
The data show that during the last quarter of 2013, enrollment in individual-market coverage declined by nearly 500,000 individuals, but then increased in the first quarter of 2014 by just over 2.7 million individuals. For the combined six-month period, the result was a net enrollment increase of just over 2.2 million for the individual market. Those figures are consistent with reports of insurers’ non-renewing individual-market policies that did not meet the new coverage requirements, and reported enrollments in individual-market plans offered through the exchanges.
However, the biggest change in the private market during the six-month period was not the expansion in individual-market coverage, but the decline in fully insured employer group coverage. While enrollment in fully insured employer group coverage modestly increased—by just over 175,000 individuals—in Q4 2013, it dropped by nearly 4.2 million individuals in Q1 2014. The result was a net enrollment decrease of 4 million individuals for the combined six-month period.
Only in the employer self-insured group market did enrollment increase in both quarters—by just over 1.8 million in Q4 2013, and by almost 500,000 in Q1 2014—producing a net enrollment increase of nearly 2.3 million for the combined six-month period.
It stands to reason that the increase in self-insured group coverage during this period is almost entirely the result of employers shifting from purchasing fully insured group plans to self-insuring their plans. Few firms offering their workers coverage for the first time will begin with a self-insured plan. It is also possible that some smaller employers shifted to self-insured coverage in order to avoid the added costs of the “essential benefits” requirement that the PPACA imposes on fully insured small group plans. However, employers shifting from fully insured to self-insured plans would explain, at most, 57 percent of the enrollment decline in fully insured group coverage.
The remaining 43 percent of the reduction can only be explained by employers’ discontinuing coverage for some or all of their workers or, in some cases, individuals losing access to such coverage due to employment changes. While it is not possible to determine the subsequent coverage status of individuals who lost group coverage, there are four possibilities: (1) some obtained replacement individual-market coverage (either on or off the exchanges); (2) some enrolled in Medicaid; (3) some enrolled in other coverage for which they are eligible (such as a plan offered by their new employer, a spouse’s plan, a parent’s policy, or Medicare); or (4) some became uninsured.
In cases where individuals who lost group coverage transitioned to coverage under another employer group plan or the individual market, those individuals would be included in the enrollment counts for those submarkets. Similarly, those that transitioned to Medicaid would be included in the Medicaid enrollment figures reported by the Centers for Medicare and Medicaid Services (CMS).
As Chart 1 shows, over the six-month period, net total enrollment for all three segments of the private coverage market increased by just over 520,000 individuals. Thus, the reduction in employer-sponsored coverage offset 77 percent of the gain in individual-market coverage during the period.
Comparison with HHS Exchange Enrollment Data
The HHS-reported figure for exchange enrollment as of March 1 is the one that is most comparable to the figures derived from the market data, since few, if any, individuals who selected coverage after March 1 would have active coverage before the end of the month, and thus have been counted in the insurance market enrollment data for Q1 2014. HHS reported that 4,242,325 individuals selected an exchange plan between October 1, 2013, and March 1, 2014.[5] Yet, the combined market data for Q4 2013 and Q1 2014 show that the net increase in total individual-market enrollment (both on and off the exchanges) was 2,236,942 individuals—which equates to 53 percent of the exchange plan selection figure reported by HHS through March 1. Even if a greater exchange enrollment lag is assumed—by using as the comparison base the figure of 3,299,492 individuals who selected exchange plans before February 1—the net increase in total individual-market enrollment is still only 68 percent of the plan selection figure reported by HHS.
These differences are likely attributable to the following factors, though it is impossible to determine the magnitude of each from the available data:
- Software problems. The exchanges experienced software problems that generated duplicate enrollments, which may have inflated the HHS counts, as well as errors in transmitting enrollment information to carriers, which likely resulted in delayed enrollments.
- HHS data detail individuals who selected plans, not purchased coverage. As HHS noted in its reports, its figures are for “pre-effectuated” enrollment—meaning that HHS counted the number of individuals who selected plans, not the number who paid the first month’s premium—which would be necessary for their coverage to take effect. It is likely that some portion of the individuals that HHS reported as picking a plan do not show up in the market data because they either never completed the transaction, did not complete the transaction in time for their coverage to take effect before the end of the quarter, or had existing coverage that was scheduled to lapse after the end of the quarter and arranged for their new coverage to take effect once their prior coverage ended.
- Enrollment in exchange coverage by individuals who had non-compliant individual-market coverage that was non-renewed by their carrier. Individuals who obtained such replacement coverage would be included in the market data whether they purchased their new coverage on or off the exchanges, but would only be included in the HHS reports if they obtained their new coverage through an exchange.
- Enrollment in exchange coverage by individuals who lost prior employer group coverage. Because of the substantial decline in employer group coverage, it is likely that such coverage transitions explain much of the difference.
- Enrollment in exchange coverage by individuals who were previously uninsured. While it can be presumed that previously uninsured individuals account for the net increase in private coverage of just over 520,000, it is also possible that more uninsured individuals gained coverage, but that any additional increase was offset by previously insured individuals becoming uninsured.
Change in Medicaid and CHIP Enrollment
The PPACA required states to expand Medicaid eligibility to all individuals with incomes below 138 percent of the federal poverty level who were not otherwise previously eligible for Medicaid. The vast majority of those individuals are able-bodied adults without dependent children. However, in June 2012, the U.S. Supreme Court ruled that Congress could not force states to adopt that expansion. Since then, 26 states and the District of Columbia have elected to adopt the expansion.
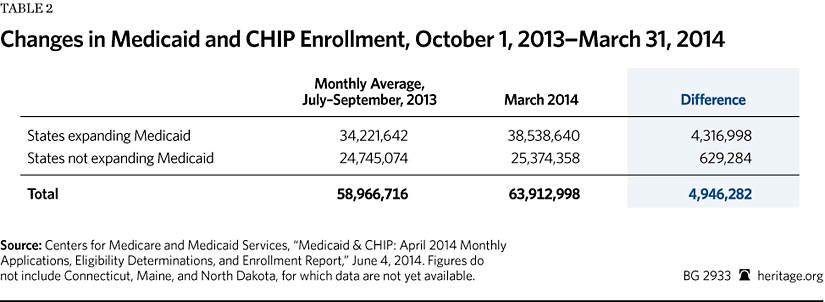
The most recent CMS monthly report on Medicaid and CHIP enrollment includes state enrollment figures for March 2014.[6] For purposes of comparison, the report also included figures for average monthly enrollment during the third quarter (Q3) of 2013—the quarter prior to the October 1, 2013, start of the open enrollment period for the new health insurance exchanges. That is the relevant basis for comparison because applications for coverage through the exchanges are evaluated to determine if the applicant is eligible for Medicaid, though Medicaid coverage for individuals determined eligible under the expansion did not take effect prior to January 2014 in most of the states that adopted the expansion.
According to the CMS report, among 25 of the states that adopted the expansion, total Medicaid enrollment in March was 4,316,998 people higher than it was for those same states in Q3 2013.[7]
Obamacare also changed the standards for determining eligibility for individuals who qualify for Medicaid coverage under prior law. Consequently, as a result of this and other PPACA interactions,states that have not adopted the Medicaid expansion also experienced increased enrollment.[8] According to the CMS report, for 23 of the 24 states that have not adopted the expansion, total Medicaid enrollment in March was 629,284 enrollees higher than it was for those states in Q3 2013.[9]
Thus, for the 47 states, and the District of Columbia, for which data are available, Medicaid and CHIP enrollment increased by a total of 4,946,282 individuals in the six months between October 1, 2013, and March 31, 2014.
In addition to the CMS report lacking data for three smaller states, it also notes a number of inconsistencies in the data reported by the other states. In some cases the reported enrollment is likely overstated (such as California’s figure, which includes individuals “whose applications are still pending verification”), while in other cases it is likely understated (such as Florida’s figure, which “does not include SSI [Supplemental Security Income] recipients enrolled in Medicaid”). Even so, correcting the omissions and inconsistencies is unlikely to change the total very much. The final figure for the increase in Medicaid enrollment during the six-month period will probably be around 5 million individuals.
What to Expect Next
Obamacare requires that individual-market coverage (both on and off the exchanges) be provided to any applicant during open enrollment periods. During the rest of the year, that requirement applies only to individuals who experience a “qualifying event,” typically a change in circumstances that causes them to lose their current coverage.[10] Examples of qualifying events include: moving to another state; changing employers; becoming unemployed; earning too much to stay on Medicaid; or losing eligibility under a family member’s policy due to death, divorce, or reaching age 27.
Consequently, any changes in individual-market enrollment that insurers report for the second quarter of 2014 will reflect those enrollments plus any enrollments by individuals who signed up for coverage during the open enrollment period, but whose coverage did not take effect until after March 31. According to the final HHS exchange report, an additional 3,777,438 individuals picked an exchange plan between March 2 and the close of open enrollment.[11] Allowing for the fact that there were individuals who picked a plan before March 1, but whose coverage did not take effect before the end of the first quarter, the maximum increase in individual-market coverage that can be expected to show up in the second-quarter insurance-market reports would be in the neighborhood of 4.5 million individuals.
In contrast, Medicaid enrollment operates year-round, so Medicaid and CHIP enrollment can be expected to further increase in the coming months, particularly in those states that adopted the Medicaid expansion. Indeed, the CMS report shows that in April Medicaid enrollment grew by an additional 920,675 people in the expansion states and by another 216,288 in the non-expansion states.[12]
The biggest uncertainty is whether enrollment in employer group coverage will experience further significant changes during the remainder of the year. Employer decisions to offer, or discontinue, coverage, or to provide coverage on a fully insured or a self-insured basis, are specific to each employer and are not governed by a timetable.
Conclusion
For the six months encompassing the open enrollment period, net total enrollment in private coverage increased by just over 520,000 individuals. Assuming no further erosion in employer group coverage, and further assuming that all individuals who picked an exchange plan during the last two months of open enrollment actually obtained coverage, the upper bound for any net increase in private coverage during the first year of Obamacare looks to be around 5 million individuals.
Given that Medicaid enrollment has already increased by about 5 million individuals, and is likely to continue growing over the remainder of the year, it is now clear that at least half of any net increase in total health insurance coverage during the first year of Obamacare will be as a result of its expansion of Medicaid.
—Edmund F. Haislmaier is Senior Research Fellow in the Center for Health Policy Studies, of the Institute for Family, Community, and Opportunity, at The Heritage Foundation. Drew Gonshorowski is Senior Policy Analyst in the Center for Data Analysis, of the Institute for Economic Freedom and Opportunity, at The Heritage Foundation.Appendix:
Data Sources and Adjustments
We limited our analysis to the 50 states and the District of Columbia; we excluded data for U.S. territories, as the PPACA treats U.S. territories differently with respect to the establishment of exchanges, eligibility of their residents for the new coverage subsidies, and federal Medicaid funding.
We used the Mark Farrah Associates dataset, derived from insurer regulatory filings, for private market enrollment, reported by market segment. We excluded, as not relevant to our analysis, enrollments in: Federal Employees Health Benefits (FEHBP) plans, Medicare Advantage plans, and supplemental coverage products (such as dental, vision, prescription drug, Medicare supplemental, and single disease).
For Medicaid and CHIP enrollment, we used the figures reported by the CMS, as they are the most current and include enrollment under both Medicaid fee-for-service and Medicaid managed-care plans.
For enrollment in self-insured employer plans, we used the data reported by Mark Farrah Associates for plans administered by an insurance carrier. Mark Farrah Associates compiles the data from insurer regulatory filings, supplemented by other public and private sources (such as filings with the Securities and Exchange Commission (SEC)). While the firm’s data on the self-insured market are the most comprehensive available, there are no reliable figures for enrollment in self-insured plans that are administered by independent third-party administrators (TPAs)—that is, TPAs that are not a subsidiary of an insurance carrier. However, based on its research, Mark Farrah Associates believes that truly independent TPAs likely account for no more than five percent of the total self-insured market.[13]
We made several adjustments to the Mark Farrah enrollment data to correct for missing data and errors. Specifically:
-
Arkansas has implemented the Medicaid expansion through a unique, “private option” design. Under that approach, qualified individuals are enrolled in the state’s Medicaid program and then, at the beginning of the month following enrollment, select (or are assigned) coverage under a Silver-level plan offered in the exchange, with Medicaid paying almost all of the premiums.
This unique arrangement could potentially create a double count in our analysis. The CMS Medicaid enrollment report notes that its figures for Arkansas Medicaid enrollment include private option enrollees, who do not appear to be included in the HHS figures for individuals picking an exchange plan. However, the regulatory filings by carriers offering exchange coverage in Arkansas appear to include private option enrollees in their enrollment counts for individual-market coverage—which, from the carrier perspective, would be appropriate.
That these data sources report private option enrollees differently also explains why the collective increase in individual-market enrollment among the Arkansas exchange participating carriers was three times the number of individuals that HHS reported as having picked an exchange plan in Arkansas. Separately, the Arkansas Department of Human Services (DHS) reported private option enrollment of 80,049 individuals through March. Consequently, to avoid counting private option enrollees twice, we subtracted the Arkansas DHS figure from the figure for total individual-market enrollment for Arkansas derived from the Mark Farrah dataset.
Thus, our analysis counts Arkansas private option enrollees as Medicaid enrollees. We believe that this is the correct approach, and the one most comparable to the data reported for other states, because the Arkansas private option design is essentially a new variant of Medicaid managed care, and in all other cases individuals covered through private Medicaid-managed plans are counted as Medicaid enrollees.
-
The figure reported by Premera Blue Cross for Q1 2014 individual-market enrollment in Alaska appears to be erroneous. However, the figures the company reported for other market segments in Alaska, as well as those it reported for Oregon and Washington where it also operates, appear to be correct. The discrepancy is most likely explained by an error that resulted in a figure for “member months” being reported where a figure for “covered lives” should have been reported instead. We adjusted the reported figure to approximate the likely number of covered lives, and our result was consistent with the size of Alaska’s individual market prior to 2014, Premera’s relative share of that market, and HHS’s figure for Alaska exchange sign-ups. Consequently, we substituted the revised figure.
-
While Centene’s business is primarily Medicaid managed care, the company also offers exchange coverage in seven states. In two of those states, Arkansas and Massachusetts, that coverage is offered through a subsidiary that only files annual regulatory reports. Using state-level enrollment data reported in Centene’s Q1 2014 SEC filing, we derived figures for the company’s non-Medicaid enrollment growth during Q1 2014 in those two states and assigned the results to the individual market.
-
Blue Cross Blue Shield of Kansas only files annual reports. We contacted the company and obtained its enrollment figures for the three private-market segments as of the end of March (the end of Q1 2014).
-
Only annual reports for Horizon Blue Cross Blue Shield of New Jersey are made publicly available. Because it is that state’s dominant carrier and offered coverage on the exchange, we presume that Horizon experienced some increase in individual-market enrollment, and likely some change in fully insured group-market enrollment as well. Consequently, we imputed enrollment changes in those two market subsets for Horizon as follows: We first identified a peer group of 42 carriers that all have the same, relevant characteristics, namely that they: (1) are Blue Cross carriers; (2) offer coverage on their state’s exchange; (3) offer coverage on a statewide basis both on and off the exchanges; and (4) had no data-reporting issues.
Using the Mark Farrah data, we found that the 42 carriers in the peer group reported an average increase in individual-market enrollment of 23 percent and an average increase in fully insured group-market enrollment of 1.8 percent in Q1 2014. We thus increased Horizon’s enrollment figures for Q4 2013 by those percentages to impute the likely enrollment changes in Q1 2014.
-
There were 12 carriers that offered coverage through the exchanges that had not offered coverage in the individual or group markets prior to 2014, and for which data are missing from the Mark Farrah Associates dataset. Two are new “consumer-operated and -oriented plan” (CO-OP) carriers. The other 10 are carriers that, prior to 2014, only provided Medicaid managed-care coverage. Q1 2014 is the first time that those 12 carriers would have filed quarterly reports with their states’ insurance departments. We presume that data for those carriers are missing because of delays in submitting filings.
Three of those carriers are in California and four are in New York, and both states have released reports that include figures for exchange enrollment by carrier as of the end of March. Thus, for those seven carriers we used the enrollment figures from the state exchange reports.[14]
One exchange carrier in Arizona that previously provided only Medicaid managed-care coverage is a subsidiary of a publicly traded company. We obtained enrollment data from the parent company’s SEC quarterly report and imputed the carrier’s Q1 2014 enrollment increase in Arizona to individual-market coverage offered through the exchange.
We were unable to obtain enrollment figures for another Arizona carrier that previously provided only Medicaid managed-care coverage.
In Colorado, another carrier’s filing was delayed, but it provided us with its enrollment figures by private market segment for Q1 2014.
Common Ground CO-OP in Wisconsin provided us with a figure for total member months for the quarter. We used the figures for total plan selections in the Wisconsin exchange taken from the HHS reports to calculate a figure for total Q1 2014 member months (that is, three months for those who picked a plan before January 1, two months for those who picked a plan during January, and one month for those who picked a plan during February) for all Wisconsin exchange carriers, and derived an average of 2.36 months of coverage per enrollee. We then estimated Common Ground’s individual-market enrollment by dividing the figure the carrier gave us for member months by 2.36.
For the other CO-OP, Health Republic Insurance of New Jersey, we used the enrollment figure found in a table of CO-OP enrollment and funding compiled and released by the U.S. House of Representatives Committee on Oversight and Government Reform.[15] The table lists the date for this carrier’s enrollment figure as April 11, 2014.
-
Finally, one carrier, Health Alliance, which has previously offered coverage in Illinois and Iowa, also began offering coverage in Nebraska through the exchange in 2014, but data for its Nebraska enrollment are missing from the Mark Farrah Associates dataset and we were unable to obtain the missing data from the carrier.


