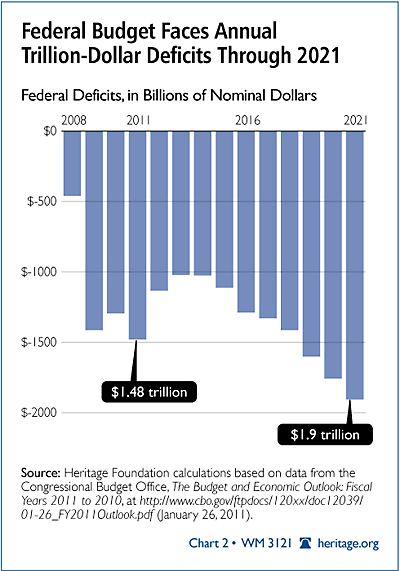
The new Congressional Budget Office (CBO) 10-year budget baseline shows a virtually unprecedented sea of red ink. The report reveals an unprecedented $1.5 trillion deficit in fiscal year (FY) 2011—an increase of $95 billion over their last 2011 estimate.[1] This will be the third consecutive year of trillion-dollar deficits.
However, the baseline includes a number of unrealistic assumptions—assumptions that Congress requires the CBO to use—that skew the results. Once the baseline is scrubbed of these unrealistic assumptions, the more realistic baseline shows historic spending levels driving the budget deficit to $1.9 trillion by 2021. Over the next decade, deficits are projected to total $13.6 trillion.
Spending Drives Historic Debt
The CBO baseline contains two important messages. First, Washington is accumulating debt at an unsustainable rate. After the debt slowly grew to $5.8 trillion through 2008, the more realistic baseline shows the federal government adding an astonishing $19.1 trillion in new debt between 2009 and 2021—$140,000 per household over those 13 years.

Annual budget deficits would never drop below $1 trillion, as the debt is now projected to reach 100 percent of the gross domestic product (GDP) by 2020—and continue growing thereafter. This steep rise in debt would eventually become too large for global capital markets to absorb, potentially triggering a financial crisis, an interest rate spike, and gigantic tax increases.
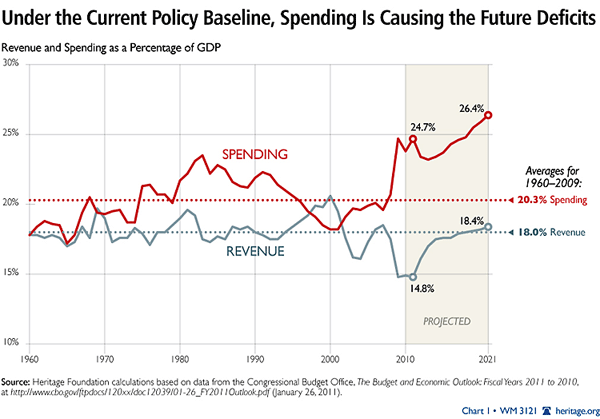
The second message is that surging government spending—not low revenues—is driving long-term deficits. Recession-depleted tax revenues are scheduled to rebound to their historical average of 18.0 percent of GDP by 2018 and reach 18.4 percent by 2021—even if all tax cuts are made permanent. By contrast, federal spending (historically 20.3 percent of GDP) is projected to reach 26.4 percent of GDP by 2021.
This means that, beginning in 2018, rising budget deficits are entirely the result of above-average spending. For example, the 2021 budget deficit is set to exceed its historical average by 5.7 percent of GDP because rising revenues (0.4 percent of GDP above their historical average) will be dwarfed by surging spending (6.1 percent of GDP above its historical average). Spending is the moving variable.
Building a Baseline
Congress requires the CBO to include in its 10-year baseline the following assumptions: The 2001 and 2003 tax cuts and all other temporary tax cuts will expire, the Alternative Minimum Tax (AMT) will not be annually adjusted for inflation, and non-war discretionary spending will grow no faster than inflation through 2021.
As these are not realistic, the CBO provides “alternative assumptions,” which are used in this paper. They include the following assumptions:
- Congress will follow the regular practice of extending certain expiring tax cuts, and the AMT will be annually adjusted for inflation;
- The Medicare “doc fix” will be enacted annually, preventing a cut in physicians’ payments;
- Spending on Iraq and Afghanistan is set at CBO’s gradual drawdown scenario; and
- Other discretionary spending will expand at the rate of the economy.
Under this more realistic “current-policy” budget baseline, the budget deficit reaches $1.5 trillion in 2011, drops to $1.0 trillion by 2013, and rises back to $1.9 trillion by 2021—and even that assumes a return to peace and prosperity. Over the 2012–2021 decade, total deficits would reach $13.6 trillion.
General Budget and Spending Trends: A Look Back[2]
- Context: Since World War II, federal spending has generally remained between 18 and 22 percent of GDP. During the Bush Administration, spending increased from 18.4 to 20.9 percent of GDP.
- In 2010, federal spending declined by $62 billion while revenues rose by $47 billion. The spending decline resulted from TARP, deposit insurance, and Fannie Mae and Freddie Mac bailouts costing $270 billion in 2009. Yet Washington recovered enough money to make a one-time $102 billion profit in 2010. Excluding those programs, 2010 federal spending rose by $309 billion (8.7 percent).
- In just four years (2007 through 2011), the federal budget is set to have expanded by nearly $1 trillion, from $2.729 trillion to $3.708 trillion. This represents a 36 percent expansion of government.
- Overall, from 2001 through 2011, federal spending surged 63 percent faster than inflation. Federal spending per household expanded from $21,510 to $31,206 over that period.[3]
- For longer-term comparisons, it is best to measure as a percentage of GDP. In 2009 and 2010, federal spending reached 24.7 percent and 23.8 percent of GDP, respectively—the highest totals since World War II. These two years have also seen the highest non-defense spending totals in American history.
- Discretionary spending increased 25 percent between 2007 and 2010—not counting the $311 billion in discretionary stimulus spending and approximately $170 billion in annual spending on the global war against terrorism.
- Over the entire 2009 through 2020 period, the Troubled Asset Relief Program (TARP) is now expected to cost $27 billion, while the Fannie Mae and Freddie Mac bailouts are estimated to cost $195 billion.
General Budget and Spending Trends: Looking Forward
- Between 2011 and 2020, recession-depleted revenues are projected to gradually rebound to 18.4 percent of GDP (above its 18.0 percent historical average). Spending is projected expand to 26.4 percent of GDP—well above its 20.3 historical average. Thus, the long-term deficits are entirely the result of the above-average spending rather than any long-term revenue decline.
- Much of this spending growth will be driven by entitlements such as Social Security, Medicare, and Medicaid. Between 2008 and 2021, the annual cost of these three programs is set to rise from $1.2 trillion to $2.2 trillion (adjusted for inflation). Medicaid costs alone are projected to soar 129 percent faster than inflation over that period, due in part to expansions from the new health care law. Social Security and Medicare face a 75-year shortfall of $43 trillion.
- Despite their intense focus, failing to extend the tax cuts for those earning more than $250,000 annually would raise just $736 billion over the next decade (closing 5 percent of the $13.6 trillion budget deficit), and even that assumes no negative economic consequences. By contrast, Social Security, Medicare, and Medicaid are forecast to spend $21 trillion over the decade.
Deficits and Debt
- Context: Before 2009, the largest budget deficit recorded since the end of World War II had been 6.0 percent of GDP in 1983. The Bush Administration oversaw budget deficits averaging 3.2 percent of GDP.
- The 2009 budget deficit of 8.9 percent of GDP was just 1.0 percent of GDP below the 2009 level that shattered the postwar record. Furthermore, the budget deficit is projected to remain above 5.9 percent of GDP indefinitely.
- By 2021, the budget baseline forecasts a $1.9 trillion annual budget deficit, publicly held debt of 104 percent of GDP, and annual net interest costs surpassing $1 trillion.
- Over what would be President Obama’s eight years in office, baseline budget deficits are projected to total $9.9 trillion—triple the $3.3 trillion in deficits accumulated by President Bush.[4] Publicly held debt—7.5 trillion at the end of 2009—is projected to triple to $24.9 trillion by 2020.
- After remaining between 23 and 49 percent of GDP since the end of World War II, publicly held debt currently stands at 62 percent of GDP and is projected to reach a peacetime-record 104 percent by 2021—well past the level that many economists believe harms economic growth.
- As the budget deficit increases over the next decade, so will net interest spending, from $197 billion (1.3 percent of GDP) in 2010 to $1.082 trillion (4.5 percent of GDP) by 2020. Even that assumes that interest rates remain lower than in the 1990s. An interest rate spike could cost trillions of dollars in additional net interest costs.[5]
- By 2021, nearly half of all income tax revenues will be needed just to pay interest on the publicly held debt.
- The coming tsunami of Social Security, Medicare, and Medicaid costs are projected to push publicly held debt to 344 percent of GDP by 2050 and 854 percent of GDP by 2080.[6]
Fundamental Reform Necessary
These spending and deficit trends are unsustainable. Historic increases in federal spending are set to create permanent trillion-dollar deficits, eventually pushing the national debt past 100 percent of the GDP. Without change, the nation could potentially face a Greece-like economic crisis.
This is unacceptable. Fundamental spending reforms are required to avert a budget crisis. Lawmakers should immediately bring non-defense discretionary spending down to 2008 or even 2006 levels. Next, they should enact tough spending caps to help lawmakers set priorities and make trade-offs. Then, Congress should disclose the massive unfunded obligations of Social Security, Medicare, and Medicaid and put those programs on long-term budgets.[7] Finally, lawmakers should enact the necessary entitlement and programmatic reforms that can keep government within those limits.[8]
These spending reforms may not be easy, but the alternative—record government debt and historic tax increases—is even worse.
Brian M. Riedl is Grover M. Hermann Fellow in Federal Budgetary Affairs in the Thomas A. Roe Institute for Economic Policy Studies at The Heritage Foundation.


