The Congressional Budget Office (CBO) has updated its 10-year budget baseline, and America’s fiscal outlook continues to worsen. The CBO projects $6.2 trillion in additional deficits over the next decade. This darkening budget forecast would have been even worse, were it not for the unrealistic assumptions that Congress requires the CBO to employ to make future budget deficits appear smaller.
With more realistic assumptions, the budget baseline shows that:
- Even as war spending phases out and the economy recovers, the projected budget deficit never drops below $1 trillion, and reaches nearly $2 trillion by 2020;
- The national debt held by the public is set to surpass 100 percent of gross domestic product (GDP) by 2020;[1]
- By 2020, half of all income tax revenues will go toward paying interest on a $23 trillion national debt;
- Federal spending per household, which has risen from $25,000 to nearly $30,000 over the past three years, would top $38,000 by 2020. The national debt per household, which was $52,000 before the recession, would approach $150,000 by 2020;[2] and
- Even if all tax cuts are extended, revenues will still surpass the historical average—18 percent of GDP—by 2020. The reason the deficit will surge 6 percent of GDP above its average is because spending will surge to 6 percent of GDP above its average.
These spending and deficit trends are completely unsustainable. Yet President Obama and Congress continue to push spending and budget deficits even higher with endless failed “stimulus” spending that is now expected to continue into the middle of this decade. They have also enacted a massive new health care law that—far from reining in spiraling health care costs—increases spending (and likely deficits) even further. In short, Washington is digging this budget hole deeper.
Building a Baseline with More Reasonable Assumptions
Congress requires the CBO to include the following unrealistic assumptions in its 10-year baseline: The 2001 and 2003 tax cuts and all other temporary tax cuts will expire, the Alternative Minimum Tax (AMT) will not be annually adjusted for inflation, and non-war discretionary spending will grow no faster than inflation through 2020.
Using the “alternative assumptions” section of the CBO report, this paper’s projections adjust the CBO’s baseline with the following assumptions:
- Congress will follow regular practice by extending certain expiring tax cuts, and the AMT will be annually adjusted for inflation;
- The Medicare “doc fix” will be enacted annually, preventing a cut in physicians’ payments;
- Spending on Iraq and Afghanistan will grow at CBO’s “fast drawdown” scenario; and
- Other discretionary spending will expand at the rate of the economy, which is about 5 percent annually (roughly 2.5 percent after inflation).
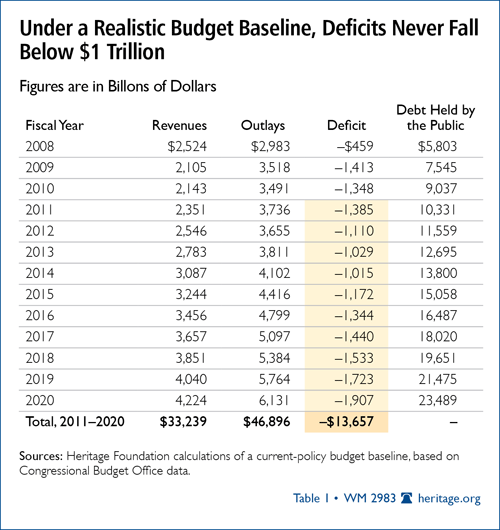
Under this more realistic budget baseline, the annual budget deficit never drops below $1 trillion. Rather, it ends at $1.3 trillion in 2010, drops to $1.0 trillion by 2014, and rises back to 1.9 trillion by 2020 (see Table 1).

General Budget and Spending Trends: A Look Back[3]
- Context: Since World War II, federal spending has generally remained between 18 and 22 percent of GDP. During the George W. Bush Administration, spending increased from 18.4 to 20.9 percent of GDP.
- Over the past two years, revenues have fallen by $381 billion, and spending has increased by $508 billion—increasing the deficit from $459 billion to $1,348 billion.
- Overall, from 2000 through 2010, federal spending will have surged 52 percent faster than inflation. Federal spending per household will have expanded from $21,875 to $29,466. By 2020, it is projected to surpass $38,000 per household.[4]
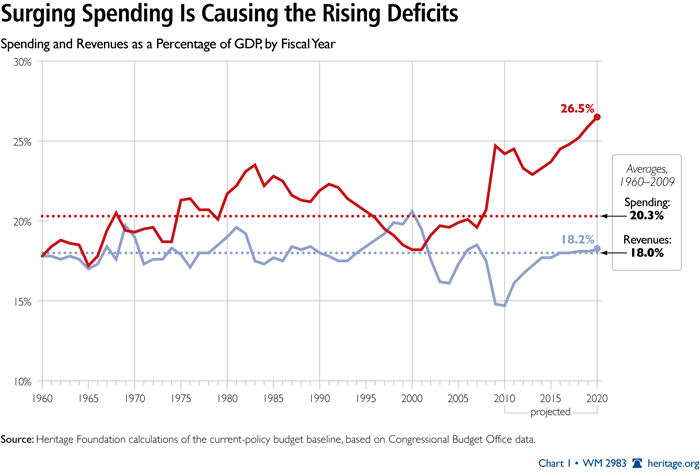
- For longer-term comparisons, it is best to measure as a percentage of GDP. After last year’s post-war record of 24.7 percent of GDP, spending is projected to dip to 23.8 percent of GDP this year, before rising to 26.5 percent of GDP by 2020.
- Non-defense discretionary spending has leaped 28 percent over the past two years.
- Over the entire 2009-to-2020 period, the Troubled Asset Relief Program (TARP) is expected to cost $67 billion, while the Fannie Mae and Freddie Mac bailouts are estimated to cost $190 billion.
General Budget and Spending Trends: Looking Forward
- Rising spending is driving future deficits. Over the past 50 years, Washington has collected 18 percent of GDP while spending 20.3 percent of GDP. Annual figures have not deviated much from these averages. Even if all tax cuts are extended, revenues are projected to reach 18.2 percent of GDP by 2020—slightly above their historical average. Thus, the rising deficit will wholly result from projected spending leaping to 26.5 percent of GDP—a level never before seen except for the height of World War II (see Chart 1).[5]
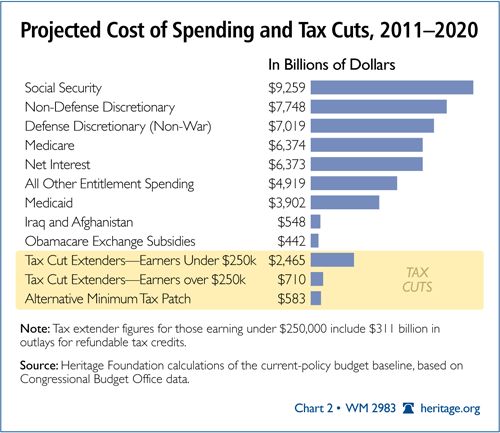
- Virtually all of this spending and deficit growth will be driven by rising Social Security, Medicare, Medicaid, and net interest costs. Between 2008 and 2020, the cost of Social Security, Medicare, and Medicaid is set to rise by 2.7 percent of GDP (and even that assumes Congress does not reverse the Medicare cuts that were intended to offset Obamacare). Net interest costs will rise by 3 percent of GDP. This combined 5.7 percent of GDP expansion of government accounts for virtually the entire increase in the 2020 budget deficit over the pre-recession deficit (see Chart 2).[6]


Deficits and Public Debt
- Context: Before 2009, the largest budget deficit recorded since the end of World War II had been 6 percent of GDP in 1983. The Bush Administration oversaw budget deficits averaging 3.2 percent of GDP.
- The 2009 budget deficit of 9.9 percent of GDP shattered the postwar record. Furthermore, the budget deficit is projected to be 9.2 percent of GDP in 2010, and to remain above 5.7 percent of GDP indefinitely.
- After remaining between 23 percent and 49 percent of GDP since the end of World War II, the public debt currently stands at 62 percent of GDP and is projected to top 100 percent by 2020.
- By 2020, the budget forecasts a $1.9 trillion annual budget deficit, a public debt of 101 percent of GDP, and annual net interest spending of $1.1 trillion.
- By 2020, nearly half of all income tax revenues would go toward paying interest on the national debt.
- Over eight years of an Obama Administration, baseline budget deficits are projected to total $10 trillion—triple the $3.3 trillion in deficits accumulated by President George W. Bush.[7] The public debt—7.5 trillion at the end of 2009—is projected to triple to $23.5 trillion by 2020.
- As the budget deficit increases over the next decade, so will net interest spending, from $187 billion (1.3 percent of GDP) in 2009 to $1,109 billion (4.8 percent of GDP) by 2020. Even that assumes that interest rates remain lower than they were in the 1990s. Every percentage point rise in interest rates over projected levels would add approximately $1 trillion in net interest costs over the decade.[8]
- The coming tsunami of Social Security, Medicare, and Medicaid costs are projected to push the federal public debt to more than 300 percent of GDP by 2050 and above 800 percent of GDP by 2080.[9] The CBO does not project that the expensive Obamacare legislation will significantly bend the health care cost curve downward.
Difficult Decisions Needed: What to Do
Genuine spending reforms are the only way to bring the budget under control. Lawmakers should rescind the remaining funds from TARP and the failed stimulus bill, as well as repeal the unaffordable health care law. Next, they should enact tough spending caps to help lawmakers set priorities and make trade-offs. Congress should then disclose the massive unfunded obligations of Social Security, Medicare, and Medicaid; put those programs on long-term budgets; and create an entitlement reform commission.[10] Finally, lawmakers should enact the necessary entitlement and programmatic reforms that can keep government within those limits.[11]
These spending reforms may not be easy, but the alternative—record government debt and historic tax increases—is even worse.
Brian M. Riedl is Grover M. Hermann Fellow in Federal Budgetary Affairs in the Thomas A. Roe Institute for Economic Policy Studies at The Heritage Foundation.


