Changes in the Medicare spending projections by the Congressional Budget Office (CBO) have prompted a new debate over the fiscal health of the Medicare program. Some journalists and commentators have interpreted the CBO’s lowering of its Medicare spending projections over the past nine years as a possible indication that Medicare’s fiscal crisis is tapering. The New York Times declared that Medicare is “not such a budget-buster anymore,”[1] and economist and liberal commentator Paul Krugman dubbed the changes as a “Medicare miracle,” asserting that “our supposed fiscal crisis has been postponed, perhaps indefinitely.”[2]
They are mistaken. Medicare still presents a significant budget problem. As Social Security and Medicare Trustee Charles Blahous writes, “These articles exhibit substantial confusion about the significance of recent changes in Medicare projections. Full understanding of these factors renders it clear that the Medicare cost problem (and the broader federal budget challenge) has not been solved.”[3]
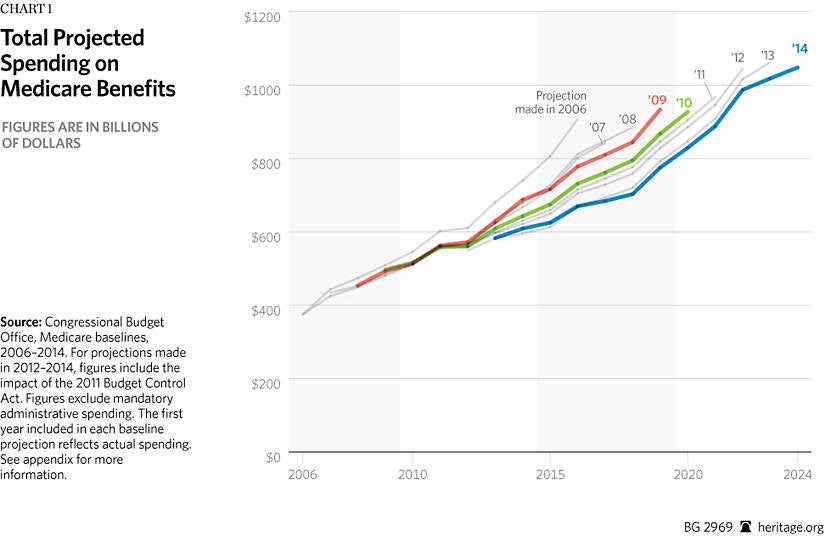
Medicare remains the largest driver of entitlement spending, rapidly adding to the federal deficit and growing even more unsustainable as it gains more beneficiaries. Federal spending on Medicare is expected to increase from $612 billion in 2014 to $1.05 trillion in 2024.[4] Thus, any reductions in future projections may reduce spending in any given year, but do not fundamentally change its trajectory.
CBO Baseline Updates
The CBO regularly updates its detailed 10-year projections for federal spending on Medicare. This is referred to as the Medicare baseline projections. Importantly, the CBO estimates are based on the assumption that current laws remain unchanged.
Although the CBO projects total Medicare spending and spending in each subprogram part to increase steadily, it has lowered its projections of those increases several times since 2009. A large portion of these projected spending reductions in Medicare can be attributed to legislative action, specifically the enactment of the Affordable Care Act (ACA) of 2010 and the Budget Control Act (BCA) of 2011.
The ACA cut Medicare spending significantly. In fact, the CBO estimates a reduction of $716 billion from 2013 to 2022, with $517 billion cut from Medicare Part A, $247 billion from Medicare Part B, and a $48 billion increase in spending in Medicare Part D.[5] As the CBO has explained in separate reports, most of the savings from the ACA Medicare cuts will not be retained to shore up Medicare solvency, but will instead pay for new spending under the ACA.[6] Whether Medicare’s fiscal condition will improve as a result of these cuts remains uncertain.
In addition to the ACA cuts in Medicare, the BCA (sequestration), which was extended by the Bipartisan Budget Act of 2013, requires an annual across-the-board spending cut to Medicare from 2013 through September 2024.[7] These cuts are expected to reduce Medicare spending by $172 billion from 2013 to 2024.[8]
Another portion of the projected reductions stems from “technical changes,” which includes anything that is not attributed to legislative or economic changes. As the CBO explained,
Changes in projections for technical reasons may encompass changes made for a wide variety of reasons, including new information from survey and agency data on programs’ enrollment and spending, improvements in the methods CBO uses to project spending, and the effects of administrative actions and judicial decisions.
The CBO credits a 12 percent reduction in total spending to technical changes in its forecast for 2011–2020.[9]
CBO Baseline Projections by Medicare Part
Beyond understanding the CBO’s total Medicare spending projection changes, it is equally as informative to understand these changes in context of the separate Medicare program components. Excluding the effects of the BCA, the CBO provides separate projections for spending on Medicare Parts A, B, and D.
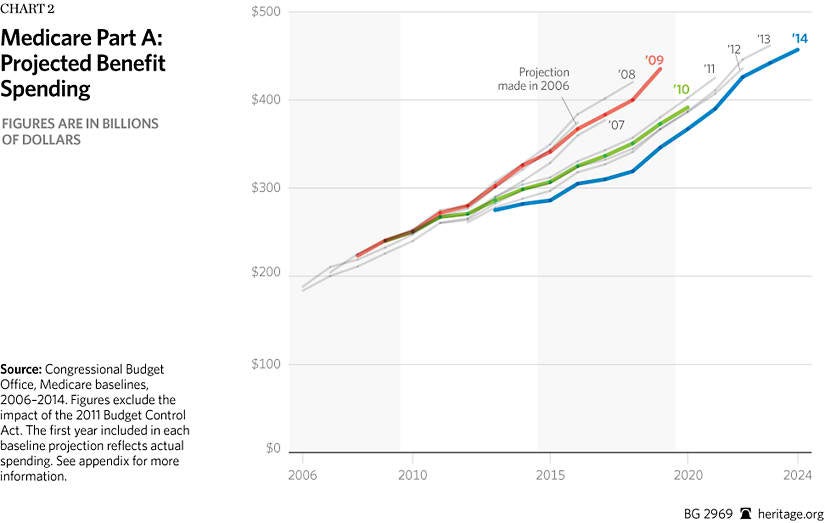
Medicare Part A. Part A, which pays for inpatient care (i.e., hospital services) and is financed by the Medicare payroll tax, has contributed to the decline in spending projections. As shown in Chart 2, spending dropped significantly between the 2009 projection and the 2010 projection. Much of the change is attributed to the significant cuts in provider payments (which includes hospital payments) required by the ACA. In 2009, the CBO projected Part A benefits spending would be $435.2 billion in 2019.[10] In 2010, the CBO lowered its projections for 2019 Part A spending to $372.5 billion,[11] and its April 2014 projection dropped further to an estimated $346 billion in 2019.[12]

However, both the Centers for Medicare and Medicaid Services’ Office of the Actuary and the Medicare Trustees have questioned the sustainability of these cuts over time, warning that they will likely harm seniors’ access to care and quality of care if implemented as the ACA requires.[13] If the cuts harm seniors’ access to quality care, Congress will likely override them, much as they have done each year for more than a decade with the scheduled reductions in Medicare’s reimbursements to physicians. Thus, since the CBO projection assumes that current law will remain unchanged, these savings in the baseline remain highly uncertain.
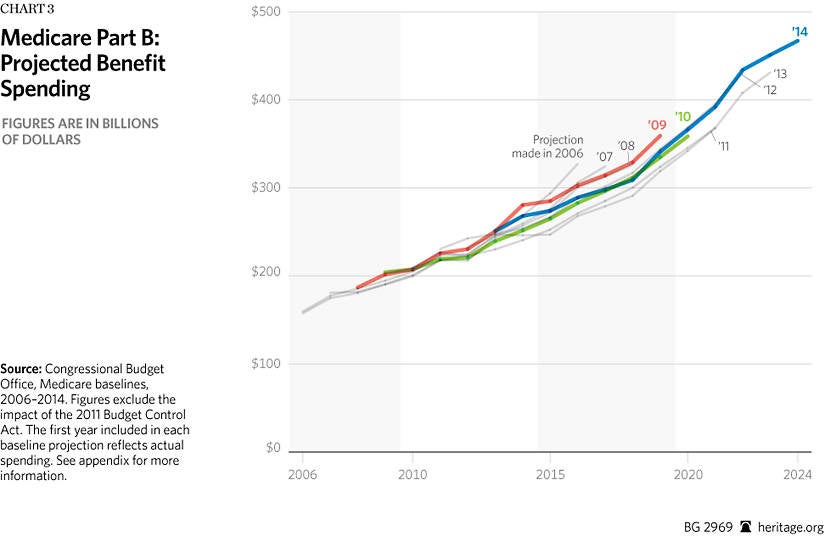
Medicare Part B. Spending projections for Medicare Part B, which covers outpatient and physician services, are actually increasing. As shown in Chart 3, the baseline projections in 2014 are higher than the baselines of some of the previous years. In its 2010 projections, the CBO estimated Part B spending would reach $334.8 billion by 2019.[14] In its 2014 projections, the CBO estimates Part B spending will be $341 billion, $6.2 billion more than projected four years earlier.[15]
Moreover, Part B spending will almost certainly be higher than portrayed in the latest projections. Last year, Congress overrode dramatic cuts to physician reimbursement based on the sustainable growth rate (SGR) through March 2015. This is largely due to the fact that if the cuts were implemented, Medicare physicians would have faced a 24 percent cut in reimbursement, which would undoubtedly affect access to physicians for seniors. The 2014 CBO projection reflects this one-year override, but assumes that future cuts will take place. However, Congress is more likely to override the formula’s cuts in the coming years as well, as it has every year since 2003. The ten-year cost of repealing and replacing the SGR would increase Medicare Part B spending by an estimated $138 billion.[16]
Medicare Part D. Medicare Part D, which provides prescription drug coverage, has significantly contributed to the CBO’s lower spending projections. Although the ACA increased spending in Part D by phasing out the “donut hole,” the CBO still estimates that Part D spending will be less than projected in 2009 (pre-ACA), as noted in Chart 4. In 2009, the CBO projected spending would be $138.8 billion in 2019.[17] In 2014, the CBO estimates Part D spending will be $102 billion in 2019.[18] Moreover, in 2013, overall Part D spending was about 50 percent less than the CBO originally expected when the law was enacted in 2003.[19]
Unlike Parts A and B, Part D is based on a competitive, consumer-choice model in which Medicare enrollees receive a government defined contribution to offset the cost of their chosen plan. Under this type of arrangement, private plans are compelled to compete directly for enrollees’ dollars, keeping costs lower.[20] Some analysts have noted that expiring patents and the availability of less expensive generic drugs may also be a factor in lower Part D spending. The CBO cites technical changes in its projections for Part D as the largest factor in its total downward revisions in 2013[21] and 2014.[22]
Comparing Projection Changes within Medicare
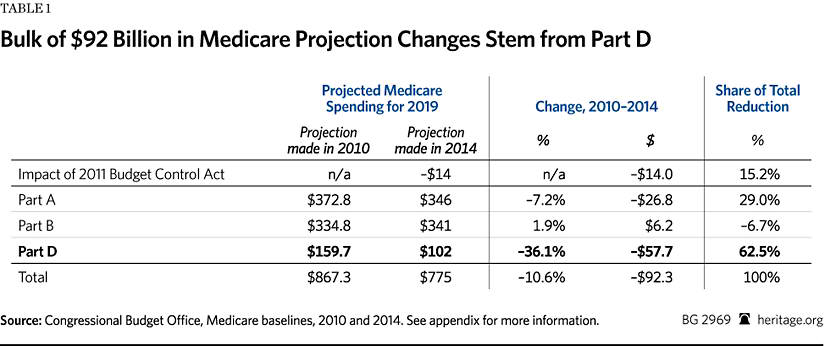
Comparing 2010 CBO projections to 2014 CBO projections for the year 2019, total Medicare spending projections have declined by about $92 billion.[23] The BCA sequestration cuts account for 15 percent of the total spending projection reduction. From there, disaggregating total spending reductions by each subprogram part shows that Medicare Part D is the largest contributor to the projected decline in spending. As shown in Table 1, Part D spending accounts for over 62 percent ($57.7 billion) of the decrease, Part A accounts for 29 percent ($26.8 billion) of the decline, while Part B spending increased by almost 7 percent ($6.2 billion).
It is also important to consider these numbers in terms of total spending on each program part. Part A accounts for the largest amount of total Medicare spending. Part D accounts for the smallest amount of total Medicare spending. Thus, Part A’s projected spending decrease of $27 billion is only slightly more than a 7 percent total reduction in Part A spending. Whereas, Part D’s projection reduction of $58 billion is a decrease in total Part D spending of about 36 percent.
Medicare Reform Still Needed
A variety of factors, including some outside Medicare, could be contributing to the changes in Medicare spending projections.[24] Yet the slowdowns in annual spending growth say nothing about the program’s long-term fiscal health.[25] Medicare spending remains a threat to America’s fiscal welfare. The facts are clear and ominous: The 10-year cost of the program is still rising with each baseline. By 2023, total Medicare spending is projected to surpass $1 trillion per year.[26] Beyond the 10-year budget window, Medicare faces an exhausted Part A trust fund in 2030[27] and between $28 trillion and $35 trillion in total unfunded obligations over the long term.[28]
Medicare is an engine of massive long-term debt. Indeed, the Medicare trustees recommend urgent reforms:
Notwithstanding recent favorable developments … Medicare still faces a substantial financial shortfall that will need to be addressed with further legislation. Such legislation should be enacted sooner rather than later to minimize the impact on beneficiaries, providers, and taxpayers.[29]
Congress should make serious reforms to Medicare.[30] Replicating the success of consumer choice and intense competition in Part D—a defined-contribution (premium support) model—could control costs, slow spending, and put Medicare on more solid fiscal footing for the future.
—Alyene Senger is a Research Associate in the Center for Health Policy Studies, of the Institute for Family, Community, and Opportunity, at The Heritage Foundation.
Appendix: Sources for Charts
Congressional Budget Office, “April 2014 Medicare Baseline,” April 14, 2014, p. 1, http://www.cbo.gov/sites/default/files/cbofiles/attachments/44205-2014-04-Medicare.pdf (accessed September 25, 2014).
, “CBO’s August 2010 Baseline: Medicare,” August 25, 2010, p. 1, http://www.cbo.gov/sites/default/files/cbofiles/attachments/MedicareAugust2010FactSheet.pdf (accessed September 25, 2014).
, “CBO’s March 2008 Baseline: Medicare,” March 12, 2008, p. 1, http://www.cbo.gov/sites/default/files/cbofiles/attachments/medicare_0.pdf (accessed September 25, 2014).
, “CBO’s March 2009 Baseline: Medicare,” March 24, 2009, p. 1, https://www.cbo.gov/sites/default/files/cbofiles/attachments/medicare.pdf (accessed September 25, 2014).
, “CBO’s May 2013 Medicare Baseline,” May 14, 2013, p. 1, http://www.cbo.gov/sites/default/files/cbofiles/attachments/44205-2013-05-Medicare.pdf (accessed September 25, 2014).
, “Fact Sheet for CBO’s March 2006 Baseline: Medicare,” March 15, 2006, p. 1, http://amcp.org/WorkArea/DownloadAsset.aspx?id=12757 (accessed September 25, 2014).
, “Fact Sheet for CBO’s March 2007 Baseline: Medicare,” March 7, 2007, p. 1, http://www.cbo.gov/sites/default/files/cbofiles/attachments/medicare_1.pdf (accessed September 25, 2014).
, “March 2011 Medicare Baseline,” March 18, 2011, p. 1, http://www.cbo.gov/sites/default/files/cbofiles/attachments/medicare2011.pdf (accessed September 25, 2014).
, “March 2012 Medicare Baseline,” March 13, 2012, p. 1, http://www.cbo.gov/sites/default/files/cbofiles/attachments/43060_Medicare.pdf (accessed September 25, 2014).


