Chairman Harkin, Ranking Member Alexander, and Members of the HELP Committee, thank you for inviting me to testify this afternoon. My name is James Sherk. I am a Senior Policy Analyst in Labor Economics at The Heritage Foundation. The views I express in this testimony are my own, and should not be construed as representing any official position of The Heritage Foundation.
Supporters of the minimum wage intend it to lift low-income families out of poverty. Unfortunately, despite these good intentions, the minimum wage has proved ineffective at doing so. Indeed, it often holds back many of the workers its proponents want to help. Higher minimum wages both reduce overall employment and encourage relatively affluent workers to enter the labor force. Minimum wage increases often lead to employers replacing disadvantaged adults who need a job with suburban teenagers who do not.
This can have long-term consequences. Minimum wage positions are typically learning wage positions—they enable workers to gain the skills necessary to become more productive on the job. As workers become more productive they command higher pay and move up their career ladder. Two-thirds of minimum wage workers earn a raise within a year. Raising the minimum wage makes such entry-level positions less available, in effect sawing off the bottom rung of many workers’ career ladders. This hurts these workers’ career prospects.
Even if minimum wage workers do not lose their job, the overlapping and uncoordinated design of U.S. welfare programs prevents those in need from benefitting from higher wages. As their income rises they lose federal tax credits and assistance. These benefit losses offset most of the wage increase. A single mother with one child faces an effective marginal tax rate of 91 percent when her pay rises from $7.25 to $10.10 an hour. Studies also find higher minimum wages do not reduce poverty rates. Despite the best of intentions, the minimum wage has proved an ineffective—and often counterproductive—policy in the war on poverty.
Congress could do more to help low-income families by restructuring and coordinating welfare programs and their associated phase-out rates. No one in American—and especially not low-income workers—should face tax rates in excess of 50 percent.
History of the Minimum Wage
Congress instituted the minimum wage in 1938 as part of the Fair Labor Standards Act (FLSA). The first minimum wage stood at 25 cents an hour. The last minimum wage increase occurred in 2007, when Congress raised the rate in steps from $5.15 an hour that year to $7.25 an hour in July 2009. The District of Columbia and 19 states have also established local minimum wages higher than the federal rate. The highest state minimum wage in the country occurs in Washington State at $9.19 an hour. The average minimum wage in the U.S.—including higher state rates—currently stands at $7.57 an hour.[1]
Over the past 65 years the minimum wage has varied considerably in inflation-adjusted buying power. It has averaged $6.60 an hour in purchasing power in 2013 dollars. But it has ranged from a low of $3.09 an hour in late 1948 to a high of $8.67 an hour in 1968.[2] Today’s minimum wage buys somewhat more than the minimum wage has historically, although it remains over a dollar an hour below its historical high.[3]

Congress typically raises the minimum wage only during times of healthy economic growth and low unemployment. In 1990, Congress enacted a minimum wage hike that took effect on April 1 of that year, when unemployment stood at 5.4 percent. Congress voted to raise the minimum wage again in August 1996—when unemployment stood at 5.1 percent. The next vote to raise the minimum wage occurred in May 2007, when unemployment stood at 4.4 percent.[4] Congress has not voted to raise the minimum wage when unemployment stood above 7.5 percent since the Great Depression ended.[5]
Who Earns the Minimum Wage?
Stereotypes of minimum wage earners range from teenagers holding summer jobs to single mothers struggling to support their family. Bureau of Labor Statistics (BLS) data sheds light on who actually makes the minimum wage.
Relatively few Americans do so. In 2011 and 2012, 3.7 million Americans reported earning $7.25 or less per hour—just 2.9 percent of all workers in the United States.[6][7][8] Those who do work in minimum-wage jobs fall into two distinct categories: young workers, usually in school, and older workers who have left school. Most minimum-wage earners fall into the first category; just over half are between the ages of 16 and 24.[9] The rest are 25 or older. Table 1 shows the characteristics of minimum wage workers overall, and broken down by age groups.
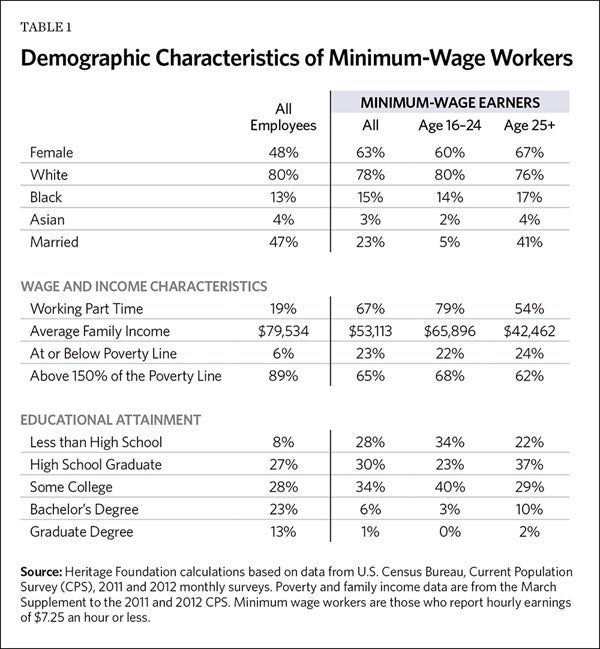
Minimum-wage workers under 25 are typically not their family’s sole breadwinners. Rather, they tend to live in middle-class households that do not rely on their earnings—their average family income exceeds $65,000 a year. Generally, they have not finished their schooling and are working part-time jobs. Over three-fifths of them (62 percent) are currently enrolled in school.[10] Only 22 percent live at or below the poverty line, while two-thirds live in families with incomes exceeding 150 percent of the poverty line. These workers represent the largest group that would benefit directly from a higher minimum wage, provided they kept or could find a job.
Adults who earn the minimum wage are less likely to live in middle- and upper-income families. Nonetheless, three-fourths of older workers earning the minimum wage live above the poverty line. They have an average family income of $42,500 a year, well above the poverty line of $23,050 per year for a family of four. Most (54 percent) of them choose to work part time, and two-fifths are married.
Many advocates of raising the minimum wage argue it will help low-income single parents surviving on it as their only source of income. Minimum-wage workers, however, do not fit this stereotype. Just 4 percent of minimum-wage workers are single parents working full time, compared to 5.6 percent of all U.S. workers.[11] Minimum-wage earners are actually less likely to be single parents working full time than the average American worker.
Though some minimum-wage workers do struggle with poverty, they are not representative of the typical worker in minimum-wage jobs. The data simply does not support the stereotype of minimum-wage workers living on the edge of destitution.
Learning Wage Positions
Most minimum wage jobs are entry-level positions filled by workers with limited education and experience. As Table 1 shows, almost three-fifths of minimum wage workers have no more than a high school education. They work for the minimum wage because they currently lack the productivity to command higher pay.
Minimum-wage jobs give these workers experience and teach them essential job skills. Sometimes these skills are unique to an individual job, such as how to operate a particular piece of equipment. More often they pertain to general employability: the discipline of waking up early to go to work each day, learning how to interact with customers and coworkers, how to accept direction from a boss. These skills are essential to getting ahead in the workplace, but difficult to learn without actual on-the-job experience.
Once workers gain these skills they become more productive, and most quickly earn raises. Over two-thirds of workers starting out at the minimum wage earn more than that a year later.[12] Minimum-wage jobs are learning wage jobs—they teach inexperienced employees skills that make them more productive. They are the first step on many workers’ career ladders.
While very few Americans currently work for the minimum wage, a substantial number once did so. Over half of American started their careers making within one dollar of the minimum wage.[13] Most quickly get promoted as their productivity increases.
Workers have a say in how quickly they get promoted. Most minimum-wage earners work part time, and many are students and young adults who desire this flexibility. But minimum-wage workers who choose to work longer hours gain more skills and experience than those who work part time and, as expected, earn larger raises. A typical minimum-wage employee who works 35 hours or more a week is 13 percentage points more likely to be promoted within a year than is a minimum-wage worker putting in fewer than 10 hours per week.[14]
The notion that workers are trapped earning $7.25 an hour for much of their working lives is mistaken and ignores the primary value of minimum-wage jobs. Their importance lies not so much in the low wages they pay in the present, but in making workers more productive so they can command higher pay in the future.
Labor Demand Falls as Prices Increase
One of the central premises of economics is that “demand curves slope downwards”—when prices rise people buy less of a good or service. When gasoline becomes more expensive Americans drive less, and when it becomes less costly Americans drive more. The same applies to business owners. When the price of goods or services they use in production rises, they buy less of them. This includes labor costs—when wages rise employers hire fewer workers. Economists estimate the long-run elasticity of labor demand in the U.S. economy at around –0.3.[15] In other words, a ten percent increase in labor costs causes employers to cut their workforce by three percent. Higher compensation costs without corresponding increases in productivity cause employers to hire fewer workers.
This finding applies to employers of both highly skilled and unskilled workers.[16] Employers will not pay a worker more than their productive value to a firm. Businesses that do so quickly go out of businesses.
American Samoa
The recent experience of American Samoa dramatically illustrates how wage increases reduce employment. The tiny Pacific island chain has been an American territory for over a century. However, American Samoans have a largely separate economy and considerably lower incomes than residents of the continental United States: the average Samoan worker made $12,000 in 2009.[17] The tuna canning industry makes up a significant portion of their private sector.
Until recently American Samoa had a different minimum wage schedule than the continental United States. A committee within the Department of Labor set Samoan wage minimums according to local economic conditions. In January 2007 the minimum wage in the canning industry stood at $3.26 an hour. Unfortunately for American Samoa, Congress applied the 2007 federal minimum wage increase to the territory. The legislation aligned the Samoan minimum wage with the U.S. rate of $7.25 an hour in 50 cent annual increments.[18]
Almost every hourly worker in the tuna canning industry makes less than $7.25 an hour.[19] At that level the minimum wage would cover 80 percent of the islands’ hourly workers.[20] This would be the economic equivalent of raising the minimum wage to $20.00 an hour in the continental U.S.[21]
By May 2009 the third scheduled minimum wage increase in Samoa took effect, rising to $4.76 an hour and covering 69 percent of canning workers. This did not increase purchasing power, stimulate demand, and raise living standards, as many minimum wage proponents theorize. Instead StarKist—one of the two canneries then located in Samoa—laid off workers, cut hours and benefits, and froze hiring.[22] The other cannery—Chicken of the Sea—shut down entirely in September 2009.[23]
The Government Accountability Office reports that between 2006 and 2009 overall employment in American Samoa fell 14 percent and inflation-adjusted wages fell 11 percent. Employment in the tuna canning industry fell 55 percent.[24] The GAO attributed much of these economic losses to the minimum wage hike.
The Democratic Governor of American Samoa, Togiola Tulafona, harshly criticized this GAO report for understating the damage done by the minimum wage hike. Testifying before Congress Gov. Tulafona objected that “this GAO report does not adequately, succinctly or clearly convey the magnitude of the worsening economic disaster in American Samoa that has resulted primarily from the imposition of the 2007 US minimum wage mandate.”[25] Gov. Tulafona pointed out that American Samoa’s unemployment rate jumped from 5 percent before the last minimum wage hike to over 35 percent in 2009.[26] He begged Congress to stop increasing the islands’ minimum wage:
“We are watching our economy burn down. We know what to do to stop it. We need to bring the aggressive wage costs decreed by the Federal Government under control. But we are ordered not to interfere …Our job market is being torched. Our businesses are being depressed. Our hope for growth has been driven away…Our question is this: How much does our government expect us to suffer, until we have to stand up for our survival?”[27]
Samoan employers responded to higher labor costs the way economic theory predicts: by hiring fewer workers. Congress hurt the very workers it intended to help. Fortunately, Congress heeded the Governor’s plea and suspended the future scheduled minimum wage increases.
Minimum Wage Employment Effects
Virtually no economist doubts that raising the minimum wage to $20.00 an hour in the mainland U.S. would have similar consequences. Economists only debate the consequences of small minimum wage increases.
In part this is because, at current rates, the minimum wage affects very few workers, so it has relatively small effects on the overall economy. Even groups considered highly affected by the minimum wage have few minimum-wage workers overall. Just one-fifth of teenagers and restaurant employees work for the federal minimum wage.[28] Raising the minimum wage by $1.00 an hour – as many states have done – has little effect on most workers, even most teenagers. Consequently, a moderate increase in the minimum wage will have only small effects on the U.S. economy. It affects too few workers to have a larger impact. A law eliminating a tenth of minimum-wage jobs would raise overall unemployment by less than 0.3 percentage point.[29] Congress should not conflate small effects with no effect. The minimum wage does hurt the prospects of the relatively small number of workers it covers.
Until the mid-1990s, labor economists had a consensus that a 10 percent increase in the minimum wage reduced employment of impacted groups (like teenagers) by about 2 percent.[30] Research by David Card of the University of California-Berkeley challenged this conclusion.[31] His research, focusing on case studies of states that raised the minimum wage and states that did not, concluded the minimum wage had no adverse effect on employment. This spurred an explosion of research on the topic. This research coincided with a significant number of states raising their minimum wages above the federal level in the 1990s and 2000s. These state increases created far more case studies for economists to analyze and permitted panel studies utilizing variation in minimum wage rates across all U.S. states.
Two-thirds of the studies in this “new minimum wage research” utilizing state variation in minimum wages came to the same conclusion that previous economists had: higher minimum wages reduce the employment of less-skilled workers.[32] Among the most methodologically rigorous studies, 85 percent came to this conclusion.
A recent line of papers by Michael Reich, Arindrajit Dube, and Sylvia Allegretto contest these findings.[33] They argue that states that raised their minimum wage above the federal level (typically in the Northeast and West Coast) have slower underlying employment growth than states that did not raise their minimum wage (typically in the South and Mountain West). They contend that studies finding negative employment effects conflate these pre-existing trends with the effects of higher minimum wages. They find that once researchers control for state or regional trends the negative relationship goes away. They then compared counties that border each other across a state line and concluded higher minimum wages have negligible employment effects on teenagers and restaurant employees.
David Neumark of the University of California–Irvine and William Wascher of the Federal Reserve Board strongly dispute this critique.[34] They show that the evidence for pre-existing trends biasing previous studies is weak. They demonstrate that it takes very specific controls to make the relationship between the minimum wage and job losses disappear. Using more general specifications favored by economists produces the standard conclusion that minimum wage increases cost jobs.
Neumark and Wascher also argue that the many counties compared across state borders have very different economic climates. For example, Dube et al. compare urban Leon County in Florida (the home county of Tallahassee) with its population of 275,000 to rural Grady County, Georgia – population 25,000. Neumark and Wascher used statistical tests to analyze how closely the labor markets of these cross-border counties resemble each other. They find that among reasonable candidates for comparison, the cross-border counties “appear no better than a random draw.”[35]
They conclude that economists should look at data from all states, not just cross-border comparisons, and use standard specifications to control for pre-existing trends. Doing so produces the usual finding that minimum wage increases cost jobs. Raising the price of unskilled labor causes employers to hire fewer unskilled workers.
Crowding Out Disadvantaged Workers
The minimum wage especially hurts disadvantaged workers’ job prospects. Higher minimum wages encourage employers to replace less-skilled workers with more productive employees. Given the choice between hiring an unskilled worker for $10.10 an hour and a worker with more experience for the same rate, companies will always choose the more experienced and productive employee.
Higher minimum wages also make working in such jobs more attractive, drawing greater numbers of workers with outside sources of income into the labor market. Many suburban teenagers and college students enter the labor market when the minimum wage rises. As they apply for job openings they crowd out urban teenagers and disadvantaged adults who would have sought the jobs at the previous wages. Overall, the minimum wage reduces disadvantaged workers’ employment much more than it reduces overall employment. It causes the very workers minimum wage advocates most want to help to have the greatest difficulty finding jobs.
Empirical research consistently bears this out. One recent study examined administrative data from a large retail chain.[36] When the minimum wage rose, the chain slightly reduced overall employment. Surprisingly, however, teenage employment rose in several stores. These teen employment gains came at the expense of larger job losses among adults. The composition of teenage employment also changed, with more teens coming from wealthier neighborhoods and fewer from low-income neighborhoods. The higher wages prompted many suburban teenagers to apply for work. They crowded many low-income adults and youth out of jobs.
Another study examined how teenage employment and school enrollment changed after states raised their minimum wage.[37] It found that when states raised their minimum wage, younger teens and those who had dropped out of school were more likely to become unemployed. At the same time, higher-skill teenagers were more likely get jobs. When they have to pay higher wages, businesses hire higher-skill workers, freezing the least productive workers out of the job market.
Even studies that find the minimum wage has negligible overall employment effects find it decreases the employment of disadvantaged workers. Kevin Lang and Shulamit Kahn of Boston University examined how restaurant employment changed after minimum wage hikes in the late 1980s and early 1990s.[38] They found no evidence that the minimum wage reduced total restaurant employment, but they did find that it dramatically changed the mix of workers that restaurants hired. Teenage and student employment rose, while adult employment dropped.
A higher minimum wage is great news for a high school student working part time to buy an iPhone. It hurts lower-skill adult workers who need work to support themselves and perhaps their families. Making entry-level jobs less available makes it harder for them to gain the skills and experience necessary to advance to better paying jobs. The minimum wage effectively saws off the first rung on their career ladder.
Little Benefit to Families in Poverty
The minimum wage raises the pay of many workers at the cost of some jobs. A lot of advocates for minimum wage increases consider this a good trade-off. They argue that the gains for the workers who benefit far outweigh the costs to those who lose out. For example, raising the minimum wage by 40 percent – from $7.25 an hour to $10.10 an hour – would cost roughly 8 percent of heavily affected worker groups their jobs (although losses would be larger among the most disadvantaged workers).[39] At first glance this may seem like a good deal.
However, this analysis ignores the way American tax and welfare programs claw back wage gains made by low-income workers. Congress has created many overlapping means-tested benefit programs: the supplemental nutrition assistance program (SNAP, formerly called food stamps), temporary assistance for needy families (TANF), the Earned Income Tax Credit (EITC), child-care subsidies, housing vouchers, and Women, Infants, and Children (WIC) benefits. The government also provides extensive in-kind health care benefits: Medicaid, SCHIP, and the soon to be operating health care exchange subsidies.
These benefits phase out at different rates as income rises. Earning an additional dollar of income reduces SNAP benefits by 24 cents. Workers in the EITC phase-out range lose 21 cents for each additional dollar they earn. Housing vouchers phase out at a 30 percent rate. Low-income workers must also pay payroll (15 percent) and income taxes (10-15 percent) on each additional dollar of income. Medicaid operates with a cliff: when workers’ incomes exceed a certain threshold, they lose all benefits.
Congress did not coordinate these benefit phase-outs across programs. Consequently low-income workers can face very high effective tax rates as they lose benefits from multiple programs. Consider workers both losing SNAP benefits and landing in the EITC phase out range. For each additional dollar they earn they pay 15 cents in additional payroll taxes, 15 cents in income taxes, an average of 5 cents in state income taxes, as well as losing 21 cents of their EITC benefit and forgoing 24 cents of SNAP benefits – an effective marginal tax rate of 80 percent. Each extra dollar earned increases their net income by only 20 cents. Not even millionaires pay such high tax rates.
The Congressional Budget Office studied this issue in a report released last year.[40] It found that a single parent with one child earning between $15,000 to $25,000 experiences almost no financial benefit from working additional hours or getting a raise.[41] What they gain in market income they lose in reduced benefits, leaving them no better off.
The academic literature concludes that low-income families financially benefit when the head of the household enters the labor force and takes a job that pays near the poverty level. However, additional hours of work – or higher wages – beyond that generally produce little additional net benefit until earnings exceed 150 to 200 percent of the poverty level.[42]
Unfortunately, minimum-wage workers with incomes below the poverty level fall into this earnings dead zone. A childless adult working full time for the minimum wage earns $15,080 a year, above the poverty level for one person ($11,490). That adult (or a teenager) qualifies for relatively few federal benefits. But a single parent working the same job would fall below the poverty level for either one ($15,510) or two ($19,530) children. That single parent qualifies for many means-tested federal benefits. If the federal minimum wage rose to $10.10 an hour ($21,008 a year for a full-time job) benefit reductions would claw back the majority of his or her raise.
Table 2 shows the effective marginal tax rates facing full-time workers in various family situations whose incomes rise from $7.25 an hour to $10.10 an hour. The figures come from the Urban Institute’s Net Income Change Calculator. Some columns show the effective tax rates when workers participate in all programs for which they are eligible. Others show the tax rate when workers only participate in food stamps and pay their taxes. Note that these figures understate the effective marginal tax rates because they exclude the loss of health care benefits like Medicaid and SCHIP. Even without including health benefits, workers lose at least 50 percent of their benefits and in some cases much more.
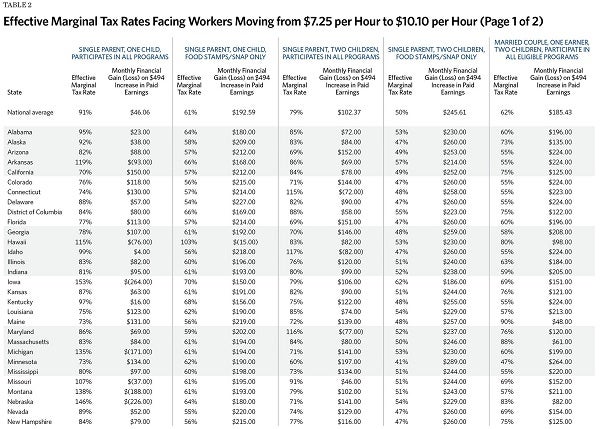
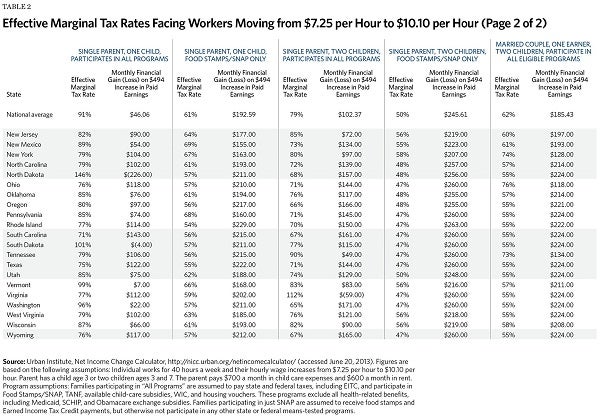
Nationwide, the average single parent with one child who participates in all programs for which they are eligible faces an effective marginal tax rate of 91 percent. The same parent with two children faces an effective tax rate of 79 percent. In some states the raise would actually financially hurt families.
Consider a Patty Jones, a hypothetical single mother in Des Moines, Iowa, who gets an offer for a job at minimum wage.[43] If she goes from not working to working full time, her monthly income rises from $1,146 to $1,838. However, if she gets a raise to $10.10 an hour, her monthly income falls to $1,574. She loses over $260.While her market income rises by $494, she loses $71 in EITC refunds, pays $37 more in payroll taxes and $45 more in state income taxes. She also loses $88 in food stamp benefits and $528 in child-care subsidies. Patty would be better off without the raise.
This system makes it very difficult to lift families out of poverty by raising the minimum wage. Higher minimum wages make it more difficult for disadvantaged adults to find jobs. This hurts their finances. However, for those living below the poverty line who keep their job, the raise provides little net benefit. Much or all of what they gain in higher pay gets clawed back as reduced benefits.
College students and teenagers with jobs do benefit from a higher minimum wage; they have few government benefits to lose. But Congress does not raise the minimum wage to help teenagers buy jeans or iPhones. It does so to help families struggling below the poverty line. Current law makes it almost impossible to achieve that goal.
No Effect on Poverty
Economic research further shows that raising the minimum wage does not reduce poverty.[44] Economists have studied changes in aggregate state poverty rates when states raise their minimum wage. They have also examined micro-data on individual families’ finances when the minimum wage changes. A study finds minimum wages reduce poverty.[45] One other study finds the opposite result.[46] But the overwhelming balance of recent research finds no effect of the minimum wage on poverty.[47] Even David Card, a researcher celebrated by minimum wage advocates, comes to this conclusion.[48]
This should come as little surprise. Besides reducing job opportunities and the perverse structure of the welfare state, very few poor families have any minimum wage workers. Only 11 percent of the workers who would gain from raising the minimum wage to $9.50 an hour live at or below the poverty line.[49]
In fact, very few poor families have any full-time workers at all. Only 9 percent of adults living below the poverty line work full time year round. One quarter work part time. Two-thirds of adults living below the poverty line do not work at all.[50] Raising the minimum wage hurts their job prospects but does nothing to increase their earnings – they have none.
If Congress wants to reduce poverty it should focus on restructuring the welfare state to remove the current disincentives to work. For too many low-income families additional work does not pay. Few Americans at any income level would work longer hours when faced with a tax rate exceeding 50 percent.
The Heritage Foundation is a public policy, research, and educational organization recognized as exempt under section 501(c)(3) of the Internal Revenue Code. It is privately supported and receives no funds from any government at any level, nor does it perform any government or other contract work.
The Heritage Foundation is the most broadly supported think tank in the United States. During 2013, it had nearly 600,000 individual, foundation, and corporate supporters representing every state in the U.S. Its 2013 income came from the following sources:
Individuals 80%
Foundations 17%
Corporations 3%
The top five corporate givers provided The Heritage Foundation with 2% of its 2013 income. The Heritage Foundation’s books are audited annually by the national accounting firm of McGladrey, LLP.
Members of The Heritage Foundation staff testify as individuals discussing their own independent research. The views expressed are their own and do not reflect an institutional position for The Heritage Foundation or its board of trustees.
Endnotes
[1] Heritage Foundation calculations using data on state minimum wage rates from the Department of Labor, Wage and Hour Division. The figure is a weighted average, where the weights are each state’s respective share of hourly employees in the U.S.
[2] Source: Heritage Foundation calculations using data from the Department of Labor, Wage and Hour Division. Inflation adjusted using the Personal Consumption Expenditures (PCE) price index.
[3] Analysis inflation adjusting historical minimum wage rates with the Consumer Price Index (CPI) will report higher real rates. The CPI estimates higher inflation than the PCE index and other chained measures of inflation do. This results in a larger upwards to historical rates to account for inflation. Using the CPI the minimum wage stood at $10.60 an hour in 1968. However, economists widely agree that the Laspreyes fixed-basket methodology the CPI utilizes produces less accurate estimates than a chained-index methodology. Consequently this paper uses the PCE index to adjust for past inflation. See for example Clinton McCully, Brian Moyer, and Kenneth Stewart, “A Reconciliation between the Consumer Price Index and the Personal Consumption Expenditures Price Index,” Bureau of Economic Analysis Papers, September 2007.
[4] Department of Labor, Bureau of Labor Statistics, “The Employment Situation,” April 1990, August 1996, May 2007.
[5] Although the economy has slipped into recessions after minimum wage increases (such as in 2007), these contractions were not expected when Congress voted.
[6] Heritage Foundation analysis of data from the Current Population Survey (CPS). The Census Bureau and Bureau of Labor Statistics jointly conduct the CPS. All numbers, except average family income and poverty status, come from analysis of the 2011 and 2012 Merged Outgoing Rotation Group (MORG) file of the CPS. Minimum-wage earners were defined as hourly employees paid $7.25 an hour or less. Poverty and family income statistics come from the March supplement to the 2011 and 2012 CPS data. Data available for download at http://thedataweb.rm.census.gov/ftp/cps_ftp.html and https://cps.ipums.org/cps/
[7] The 2.9 percent figure includes both salaried and hourly employees. Approximately 5 percent of hourly employees get paid the federal minimum wage.
[8] These numbers include workers who also earn tip income. Many of those earning less than the minimum wage work in restaurants and make more than the minimum wage after taking tips into account.
[9] 50.5 percent of minimum wage earners are between the ages of 16 and 24.
[10] Heritage Foundation calculations using the 2011 and 2012 Current Population Survey. The months of June, July, and August were excluded to avoid conflating summer breaks with non-enrollment.
[11] Heritage Foundation analysis of data from the Current Population Survey (CPS). A single parent is defined as someone who reports that he or she has one or more of his or her own children present in the household and who is widowed, divorced, separated, or never married. Full-time employees are classified as those working 35 or more hours a week.
[12] David Macpherson and William Even, “Wage Growth Among Minimum Wage Workers,” Employment Policies Institute, June 2004, p. 3-5, at www.epionline.org/studies/macpherson_06-2004.pdf.
[13] William Carrington and Bruce Fallick, “Do Some Workers Have Minimum Wage Careers,” Monthly Labor Review, May 2001, pp. 17-27, Table 2
[14] Macpherson and Even, “Wage Growth Among Minimum Wage Workers,” pp. 8-11.
[15] Daniel S. Hamermesh, Labor Demand (Princeton, N.J.: Princeton University Press, 1993).
[16] Although studies typically find workers with greater skills have a smaller elasticity of demand.
[17] Government Accountability Office, American Samoa and the Commonwealth of the Northern Mariana Islands: Employment, Earnings, and Status of Key Industries Since Minimum Wage Increases Began, Report No. GAO-11-427, June 2011, Figure 11.
[18] Ibid., Table 4.
[19] Government Accountability Office, American Samoa and the Commonwealth of the Northern Mariana Islands, p. 63.
[20] U.S. Department of Labor, Impact of Increased Minimum Wages on the Economies of American Samoa and the Commonwealth of the Northern Mariana Islands, January 2008.
[21] Heritage Foundation calculations using data from the Outgoing Rotation Groups of the 2012 monthly current population survey. $20.00 an hour is the 80th percentile for workers paid hourly wages.
[22] Government Accountability Office, American Samoa and the Commonwealth of the Northern Mariana Islands p. 63.
[23] Ibid., p. 40.
[24] Ibid., Table 2.
[25] Testimony of American Samoa Governor Togiola Tulafona before the Subcommittee on Fisheries, Wildlife, Oceans and Insular Affairs of the Committee on Natural Resources, U.S. House of Representatives, September 23, 2011. Opening statement available online at http://americansamoa.gov/index.php/news-bottom/30-gov-togiola-tells-u-s-congress-minimum-wage-increase-will-destroy-as-economy
[26] Ibid., Written Testimony, Table 3.
[27] Ibid., opening statement.
[28] Department of Labor, Bureau of Labor Statistics, “Characteristics of Minimum Wage Workers – 2012,” Tables 1 and 4, athttp://www.bls.gov/cps/minwage2012tbls.htm.
[29] The increase in unemployed would probably be less – many of these workers, especially teenagers and college students, would probably drop out of the labor market altogether and no longer count as unemployed.
[30] Charles Brown, Curtis Gilroy, and Andrew Kohen, “The Effect of the Minimum Wage on Employment and Unemployment,” Journal of EconomicLiterature Vol. 20, No. 2 (June 1982), pp. 487–528.
[31] David Card and Alan Krueger. “Minimum Wages and Employment: A Case Study of Fast-Food Industry in New Jersey and Pennsylvania,” American Economic Review, Vol. 48, No. 4 (1994), pp. 772-793.
[32] David Neumark and William Wascher, Minimum Wages (Cambridge, MA: The MIT Press, 2008).
[33] See for example Sylvia Allegretto, Arindrajit Dube, and Michael Reich, “Spatial Heterogeneity and Minimum Wages: Employment Estimates for Teens Using Cross-State Commuting Zones,” Berkeley, CA: Institute for Research on Labor and Employment, 2009; Sylvia Allegretto, Arindrajit Dube, and Michael Reich, “Do Minimum Wages Really Reduce Teen Employment? Accounting for Heterogeneity and Selectivity in State Panel Data,” Industrial Relations, Vol. 50, No. 2, pp. 205-240; Arindrajit Dube, T. William Lester, and Michael Reich, “Minimum Wage Effects Across State Borders: Estimates Using Contiguous Counties,” Review of Economics and Statistics, Vol. 92, No. 4 (2010), pp. 945-964.
[34] David Neumark, Ian Salas, and William Wascher, “Revisiting the Minimum Wage- Employment Debate: Throwing Out the Baby with the Bathwater?” National Bureau of Economic Research Working Paper No. 18681 (2013), http://www.nber.org/papers/w18681.
[35] Ibid., pp. 27-28.
[36] Laura Giuliano, “Minimum Wage Effects on Employment, Substitution, and the Teenage Labor Supply: Evidence from Personnel Data,” The Journal of Labor Economics, Vol. 31, No. 1 (January 2013), pp. 155-194.
[37] David Neumark and William Wascher. “The Effects of Minimum Wages on Teenage Employment and Enrollment: Evidence from Matched CPS Surveys,” in Solomon Polchek, ed. Research in Labor Economics, Vol. 15 (Greenwich, Conn.: JAI Press, 1996).
[38] Kevin Lang and Shulamit Kahn, “The Effect of Minimum-Wage Laws on the Distribution of Employment: Theory and Evidence,”Journal of Public Economics, Vol. 69, No. 1 (July 1998), pp. 67-82.
[39] This assumes an employment elasticity of –0.2.
[40] Congressional Budget Office, “Effective Marginal Tax Rates for Low – and Moderate- Income Workers,” November 2012,http://www.cbo.gov/sites/default/files/cbofiles/attachments/11-15-2012-MarginalTaxRates.pdf.
[41] Ibid., Summary Figure 1.
[42] Elaine Maag, C. Eugene Steuerle, Ritadhi Chakravarti, and Caleb Quakenbush, “How Marginal Tax Rates Affect Families at Various Levels of Poverty,” National Tax Journal, Vol. 65, No. 4 (December 2012), pp 759-782.
[43] All assumptions are the same as for a single parent with one child as explained in the footnotes of Table 2.
[44] Note that this does not follow directly from the preceding section. Poverty calculations exclude non-cash benefits like Medicaid, SNAP, and housing vouchers.
[45] John Addison and McKinley L. Blackburn, “Minimum Wages and Poverty, Industrial and Labor Relations Review Vol. 52, No. 3 (1999), pp. 393–409.
[46] David Neumark, Mark Schweitzer, and William Wascher, “The Effects of Minimum Wages on the Distribution of Family Incomes: A Non-Parametric Analysis,” Journal of Human Resources Vol. 40, No. 4 (2005), pp.867–94.
[47] Richard V. Burkhauser and Joseph J. Sabia, “Minimum Wages and Poverty: Will a $9.50 Federal Minimum Wage Really Help the Working Poor?” Southern Economic Journal, Vol. 77, No. 3 (January 2010); Richard Vedder and Lowell Gallaway, “Does the Minimum Wage Reduce Poverty?” Employment Policies Institute, June 2001; Jill Jenkins, “Minimum Wages: The Poor Are Not Winners,” Employment Policy Foundation, January 12, 2000; Ronald B. Mincy, “Raising the Minimum Wage: Effects on Family Poverty,” Monthly Labor Review Vol. 113, No. 7 (July 1990); Richard Burkhauser, and Joseph J. Sabia, 2007. “The Effectiveness of Minimum Wage Increases in Reducing Poverty: Past, Present, and Future,” Contemporary Economic Policy Vol. 25, No. 2 (2007), pp. 262–281; Craig Gundersen, and James Patrick Ziliak, 2004. “Poverty and Macroeconomic Performance Across Space, Race, and Family Structure,”Demography Vol. 41, No. 1 (2004), pp. 61–86; David Neumark, and William Wascher. 2002. “Do Minimum Wages Fight Poverty?”Economic Inquiry Vol. 40, No. 3(2002) pp. 315–333.
[48] David Card and Alan B. Krueger, Myth and Measurement: The New Economics of the Minimum Wage (Princeton, N.J.: Princeton University Press, 1995).
[49] Burkhauser and Sabia, “Minimum Wages and Poverty: Will a $9.50 Federal Minimum Wage Really Help the Working Poor?”
[50] U.S. Census Bureau, Historical Poverty Tables, Table 25, “Work Experience and Poverty Status for People 16 years Old and Over: 1987-2011,” http://www.census.gov/hhes/www/poverty/data/historical/hstpov25.xls