Many commentators claim that labor’s share of income has fallen to historic lows. They claim that a combination of automation, decreased unionization, and free trade reduced workers’ ability to command higher pay. However, changes in how the government measures self-employment income and faster depreciation explain—entirely—the apparent decline in labor’s share. Neither of these factors has any bearing on workers’ well-being. Adjusting for depreciation and self-employment shows that workers take home the same proportion of net income today as they did in 1948.
Labor Share of Income Is Stable
Every dollar earned or spent ultimately goes to labor or capital. For example, the money that drivers spend on gas goes toward paying the employees who drilled, refined, and transported that oil or the shareholders of the companies they work for. Economists call the proportion of income going to employees the “labor share of income.”
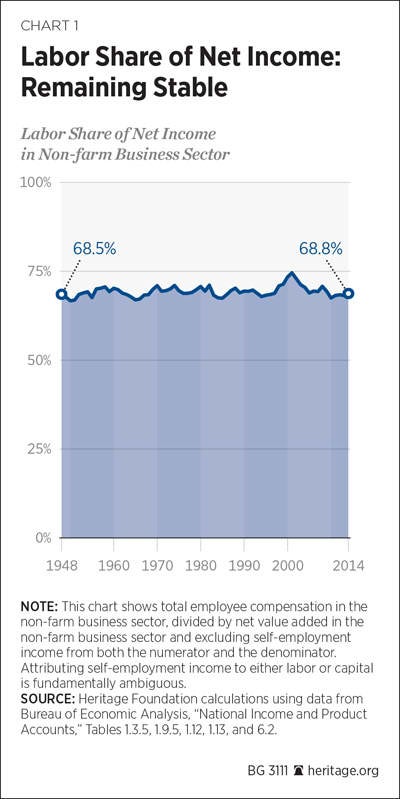
Labor’s share of income has remained remarkably stable in the post-war era. Chart 1 shows labor’s share of net income in the non-farm business sector.[1] Since 1948, labor’s share has fluctuated narrowly between 67 percent and 71 percent of net income. In 1948, workers took home 68.5 percent of the domestic economic pie. In 2014, that figure was almost unchanged at 68.8 percent. The only significant exception to this stability occurred during and immediately after the late-1990s tech bubble. During that period of rapidly rising wages, labor’s share briefly approached 75 percent. During the rest of the post-war era, labor consistently earned about two-thirds of non-farm businesses’ net income.
Popular wisdom remembers this history differently. From New York Times articles to prominent blogs, commentators declare that labor’s share of income has fallen to historic lows.[2] Analysts alternatively blame this decline on falling union membership, increased automation, globalization, or a combination of all three.
These claims rest largely on a figure produced by the Bureau of Labor Statistics (BLS): “Labor Share in the Nonfarm Business Sector.”[3] This BLS figure does indeed show labor’s share of income falling since the 1970s and hitting historic lows in the 2000s. However, the BLS headline statistic examines gross income instead of net income and uses a variable measure of labor’s share of self-employment income. These factors—not unions or robots or trade—drive the entire reported decline in labor’s share. However, they have no direct bearing on workers’ well-being. Looking at labor’s share of net income and measuring self-employment income consistently—as Chart 1 does—shows that workers’ share of income has changed little since 1948.
Depreciation Matters
Chart 1 shows labor’s share of net income, not gross income. Gross income is the total income earned by workers and enterprises without accounting for depreciation. Capital used in production wears out over time. Buildings decay, machines fall apart, computers and software become obsolescent. Business owners must spend part of their earnings repairing or replacing this depreciated capital. Net income is what remains.
Economists of all political stripes recognize that labor’s share of net income matters much more than labor’s share of gross income.[4] Increases in income offset by faster depreciation benefit neither workers nor capital owners. As Dean Baker, director of the liberal Center for Economic Policy Research, explains, “no one can eat depreciation.”[5]
This matters because depreciation has increased significantly over time, as Chart 2 shows. In 1948, depreciation consumed 7.9 percent of gross income in the non-farm business sector. By 2014, annual depreciation expenses had nearly doubled, rising to 13.9 percent of gross non-farm business income. As a result, net income has grown more slowly than gross income.
Businesses use far more computers and software in production today than in the past. These investments are short-lived and need replacement within a few years. Employers can still use a factory built in 1993. Virtually no one still uses 1993-era computers. So businesses now spend more of their revenues replacing obsolete equipment than in the past. This reduces the net income available to both employees and shareholders.

Changing Measure of Self-Employment Income
Chart 1 also excludes self-employment income.[6] Many Americans work for themselves; their earnings include a return both on their own labor and on their capital. As former chairman of the Council of Economic Advisers Alan Krueger explains, dividing self-employment income into labor and capital shares is arbitrary.[7] Analysts often assume that the proportion of self-employment income going to labor mirrors the labor share in the rest of the economy. This avoids arbitrary assumptions about the self-employment labor share driving conclusions about the overall labor share.[8]
The BLS does not follow this approach. Worse, the BLS has changed how it accounts for self-employment income. Until 2001, the BLS methodology attributed over four-fifths of self-employment income to labor. Then the BLS switched to a new approach that attributes about half of self-employment income to labor.[9] This computational change automatically reduced labor’s share of income. Unsurprisingly, the BLS headline figure for labor share of income dropped significantly after the BLS switched methods, but this measurement change has no bearing on workers’ compensation.
Depreciation and Self-Employment Income Explain Drop in Headline Figures. Economists have separately noted that depreciation and changes in measuring self-employment artificially decrease the reported labor share of income.[10] However, few reports point out that, collectively, these two factors account for the entirety of the drop in labor’s share that BLS reports.[11] Chart 3 shows the difference that accounting for depreciation and self-employment income makes. The chart shows the change since 1948 in labor’s share of income measured three different ways: (1) the BLS headline labor share; (2) the BLS headline measure excluding self-employment income; and (3) the same measure as a share of net income instead of gross income.
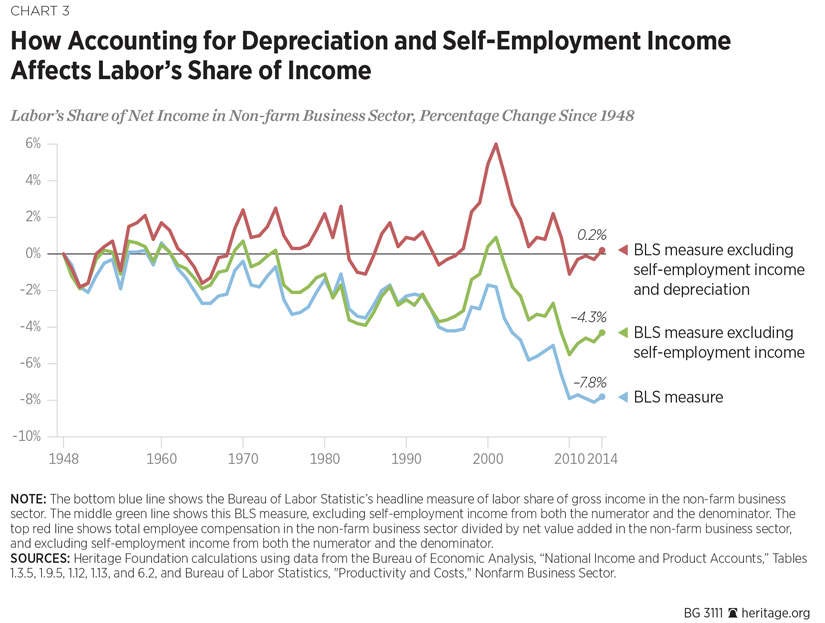
The bottom blue line shows the headline BLS measure of labor share in the non-farm business sector. It shows the labor share falling since the 1970s and how that decline accelerates sharply in the 2000s. By 2014, the headline measure has workers collecting 7.8 fewer percentage points of the economic pie than in the 1940s. This image has persuaded many commentators that economic changes have reduced workers’ well-being.
The middle green line shows the BLS headline measure, excluding self-employment income.[12] Changes in apportioning self-employment income between labor and capital do not affect this measure. This change reduces the drop in labor share considerably, especially in the 2000s—after the measurement change took effect. From 1948 to 2014, this measure fell 4.3 percentage points—just half the drop in the headline measure. Much of the seeming decline in labor share is a statistical illusion.
The top red line shows the change in labor share, excluding self-employment income and the effects of faster depreciation.[13] This entirely eliminates the apparent drop in labor’s share of income. In 2014, workers took home 0.2 percentage points more net income in the non-farm business sector than in 1948.
Faster depreciation and the change in self-employment income’s apportionment explain the entire apparent decline in labor’s share in the BLS nonfarm-business-sector data. These factors have nothing to do with workers’ bargaining strength. Nor can they be attributed to declining unionization or global trade. Workers collectively enjoy the same portion of net income in 2014 as they did in the much more heavily unionized and much less globalized economy of 1948.
Labor Share in the Corporate Sector
The Bureau of Economic Analysis (BEA) produces similar data that can be used to analyze labor’s share in corporations (a somewhat smaller sector of the economy than the non-farm business sector). The BEA compiles these data slightly differently than the BLS does.[14] By definition, the corporate sector of the economy excludes the self-employed. These figures also account for depreciation.[15] So the corporate sector labor share does not suffer from the same problems as the BLS headline measure. Chart 4 shows the change in labor’s share of corporate income.[16]
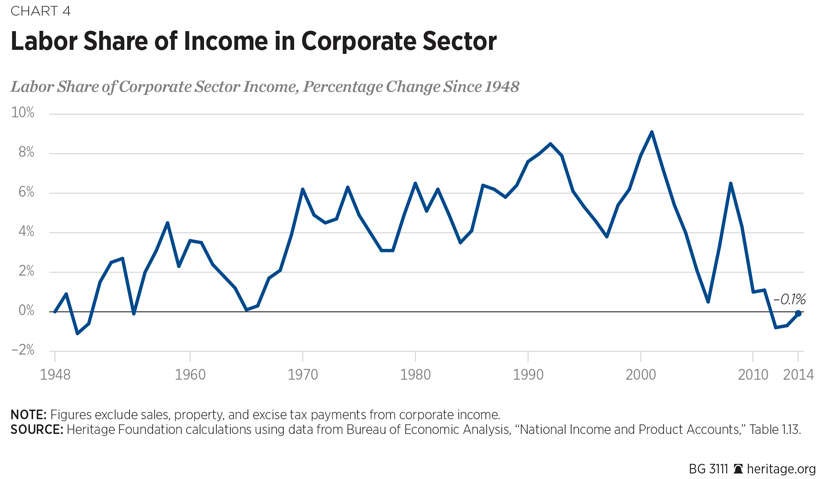
Chart 4 differs somewhat from the depreciation and self-employment-adjusted labor share displayed in Charts 1 and 3. The BLS approach shows the properly measured labor share unchanged over nearly the entire period. The BEA corporate-sector data show labor’s share rising and then falling back to its previous level. The BEA has labor’s share rising roughly 8 percentage points from the 1940s through the 1990s. Then it shows labor’s share falling sharply after the collapse of the tech bubble, followed by a sharp rebound. As of 2008, the labor share in the corporate sector stood higher than it did in 1970. During and after the Great Recession, the labor share once again fell sharply in the BEA data, returning to 1940s levels. The BEA data speak to the severity of the recession and the subsequent slow recovery, but even with those changes, labor’s share remains within historical levels.
Unions, Robots, and Trade
Both the BLS nonfarm-business-sector data and the BEA corporate-sector data show labor’s share in 2014 at almost exactly its 1948 level. These data seriously challenge the theories arguing that the decline of unions, automation, or expanded trade reduced worker leverage in salary negotiations.
America had much stronger unions, much less advanced technology, and considerably less foreign trade in the 1940s than today. Since 1948, technological advances have enabled workers and firms to more than triple hourly productivity.[17] China and India have entered the global economy, and trade barriers have come down around the world. Between then and 2014, union membership in America fell from 32 percent to 11 percent (and just 7 percent in the private sector).[18] But American workers collectively take home the same portion of the economic pie today as they did then. This strongly suggests that unions, robots, and trade have at most modest effects on labor’s share of income.
The only data showing labor’s share declining below historic levels ignore depreciation and use an inconsistent measure of self-employed labor income. Correcting for these problems shows that workers have the same leverage today as they did when unions were stronger, computers filled an entire room, and international trade was far more restricted than today.
—James Sherk is Research Fellow in Labor Economics in the Center for Data Analysis, of the Institute for Economic Freedom and Opportunity, at The Heritage Foundation.
Appendix: Data and Methodology
The BLS derives its nonfarm-business-sector compensation figures from the figures reported in the BEA’s National Income and Product Accounts (NIPA). BEA staff explained how to construct nonfarm-business-employee compensation from the publicly released NIPA Tables.[19] The Heritage Foundation’s Center for Data Analysis (CDA) followed these directions to calculate total nonfarm-business-employee compensation excluding self-employment income. This involved taking the compensation of employees, domestic industries (NIPA Table 6.2, line 2), and subtracting from it:
- Farm compensation (Table 6.2, line 5);
- Federal general government compensation (Table 6.2, line 88);
- State and local general government compensation (Table 6.2, line 93);
- Compensation, households (Table 1.13, line 43); and
- Compensation, institutions (Table 1.13, line 50).
The CDA divided this measure of employee compensation by gross value added in the non-farm business sector (Table 1.3.5, line 3) less sole proprietors income in the non-farm business sector (Table 1.12, line 11) to estimate labor’s share of gross income, excluding self-employment income as shown in the middle green line in Chart 3. The CDA divided this measure of employee compensation by net value added in the non-farm business sector (Table 1.9.5, line 3) less sole proprietors income in the nonfarm business sector to estimate the labor share of net income. Chart 1 and the top red line in Chart 3 display this figure.
The BLS adds to nonfarm-business-sector-employee compensation an estimate of imputed labor income for sole proprietors. The CDA did not attempt to replicate these BLS imputations; the bottom blue line in Chart 3 shows the publicly released BLS labor share figures.
The CDA calculated depreciation costs in the nonfarm business sector as shown in Chart 2 by dividing nominal net value added in that sector (Table 1.9.5, line 3) by gross value added (Table 1.3.5, line 3).
The CDA calculated the labor share in the corporate sector by dividing corporate-sector-employee compensation (Table 1.13, line 4) by total corporate-sector income (Table 1.13, line 3) excluding taxes on production and imports less subsidies plus current business-transfer payments (Table 1.13, line 9). These taxes primarily consist of sales taxes, excise taxes, and property taxes. They do not include direct taxes on corporate income, such as the corporate income tax.


