Washington, DC, Public Schools (DCPS) receives $29,000 per pupil—the highest per pupil revenues in the nation. Despite improvement, DCPS ranks near the bottom of American urban districts, with a majority of students failing to obtain the knowledge and skills necessary for success in life. What educational improvement has occurred in the Washington, DC, public school system seems to be concentrated heavily among the most advantaged students. Educational options should serve as an engine of upward mobility and opportunity for all students in the nation’s capital. In order to realize this goal, however, a new approach to education reform is needed.
Instead of attempting to restructure or “reform” DCPS, policymakers should free District parents to reform education from the bottom up. Congress should consider two approaches to accomplish such reform. With jurisdiction over Washington, DC, Congress can either restructure DCPS per pupil funding so that it is delivered through parent-controlled education savings accounts, or it can create a stand-alone education savings account program that is universally available to all children in the District, for which families would opt-in. Either approach would make education financing in the District entirely student-centered, thereby empowering every family to choose from a variety of educational options that fit their children’s unique learning needs.
District, Charter, and Private School Choice: Finance and Enrollment
The District of Columbia has three sets of providers of publicly funded K–12 education: The District of Columbia Public Schools (DCPS), public charter schools, and the Opportunity Scholarship Program (OSP), which is a school voucher program for low-income District students. Congress passed the charter school law for the District in 1996, and Opportunity Scholarships in cooperation with then-Mayor Anthony Williams in 2003. In the 2015–2016 school year, DCPS enrolled 48,653 students; charter schools enrolled 39,096 students.[1] During the 2014–2015 school year, 1,442 students enrolled in the Opportunity Scholarship Program.[2]
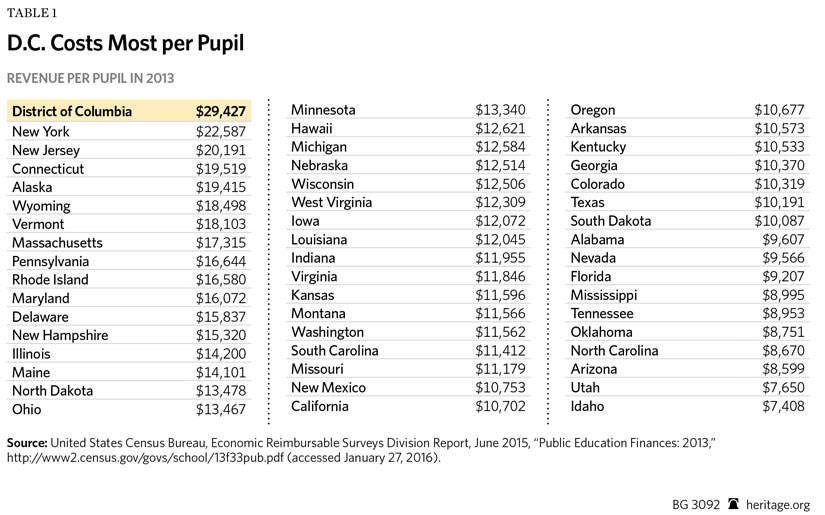
The greatest taxpayer financial commitment, both in total and on a per pupil basis, goes to DCPS. Data collected by the United States Census Bureau show DCPS as having by far the highest revenue per pupil in the country when compared to statewide averages at $29,427. This per pupil figure could comfortably pay the average tuition and fees costs for three students to attend state universities at the average national cost for in-state students.[3]
The other two options for publicly funded K–12 education in the District have a considerably smaller per pupil cost than DCPS. Passed by Congress in 1996, District of Columbia charter schools have neared parity with the district in terms of the number of students educated. According to the Center for Education Reform, the District of Columbia has the nation’s strongest charter school law.[4] Charter schools educated 44 percent of District students in 2014–2015, and spent an average of $14,629 per pupil.[5]
The DC Opportunity Scholarship program provides scholarships worth up to $8,256 for K–8 students and $12,385 for students in grades 9–12. Opportunity scholarships, which are available to current low-income District residents, first pay for tuition, with any remaining amount available for qualified expenses. To qualify for the Opportunity Scholarship Program, students must either receive benefits under the Supplemental Nutrition Assistance Program (SNAP) or have a family earning no more than 185 percent of the federal poverty level when they enter the program ($43,568 for a family of four in 2013–2014). Students may continue to receive vouchers in later years if their family’s household income does not rise above 300 percent of the poverty level. Students receive priority for participation if they attend public schools in need of improvement, or if they or their siblings already participate in the program. Opportunity scholarships may be used only at private schools within the District of Columbia.[6]
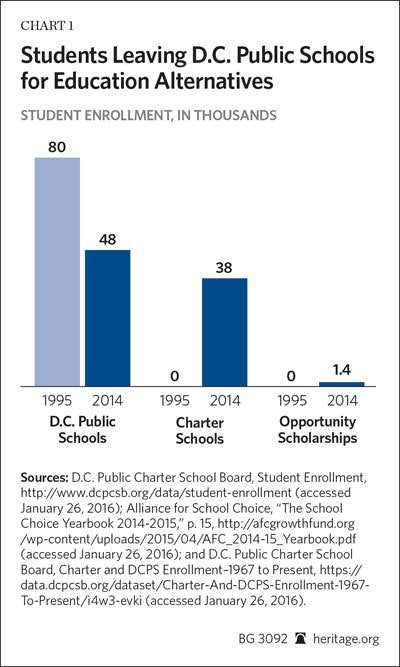
Charter schools, and to a much lesser extent Opportunity Scholarships, have led to a reduction in the overall enrollment in the District of Columbia Public Schools. However, total enrollment across the three sectors—regular public schools, charter, and Opportunity Scholarship—has increased from 79,802 in 1995 to 86,874 in 2014.
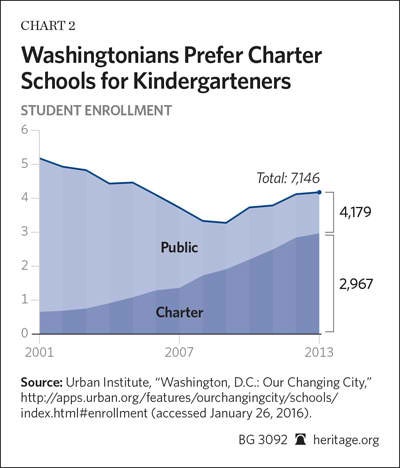
The Urban Institute has tracked enrollment in the District of Columbia by district and charter. Kindergarten enrollment, presented in Chart 2 below, demonstrated across grades a surge in charter enrollment followed by a recent trend toward stabilization in the District.
In 2001 5,836 kindergarten students enrolled in district and charter schools. By 2013, that number had increased to 7,146. More people finding schooling options in the District contributed to the District’s recent defiance of a long-standing depopulation trend.
District Academic Trends: Improving but Stubbornly Low
Student achievement data tell a remarkable story of progress in the District of Columbia. Sadly, putting this data into context quickly provides a sobering dose of reality regarding just how far the District’s schooling system still has to go.
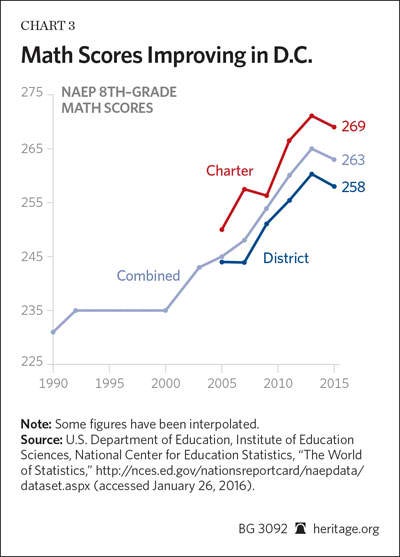
First, the good news: District scores have climbed substantially. Chart 3 presents eighth-grade mathematics scores from the National Assessment of Educational Progress (NAEP). The earliest available data from the District (1990) had a score of 231.[7]
In 1990, 83 percent of DC students scored “below basic”; 17 percent at “basic or better”; 3 percent “proficient or better”; and 1 percent “advanced.” In the 2015 NAEP, District-wide scores improved by 32 points. For an appreciation of just how large a gain this is, on the NAEP 10 points roughly equates to a grade level worth of progress. For the purpose of illustration, on the 2015 NAEP, fourth graders scored an average of 240 nationwide, while eighth graders scored 281—a 41 point difference across four grades.
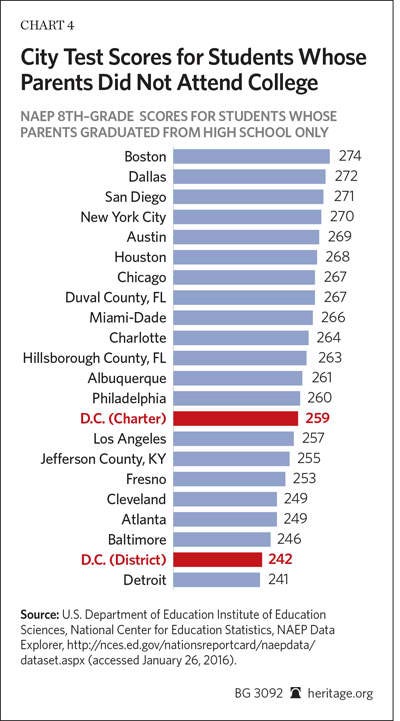
In 1990, the average DC eighth grader performed math at what today would roughly equate to a third-grade level. With an average score of 258, DC students attending DCPS regular public schools fall roughly around the national average for sixth graders in 2015 (students nationally scored 281 on average in 2015).[8]
Chart 5 displays data for district and charter achievement by parental income along with the national rate of progress for both Free and Reduced Lunch (FRL) eligible and ineligible students nationwide.
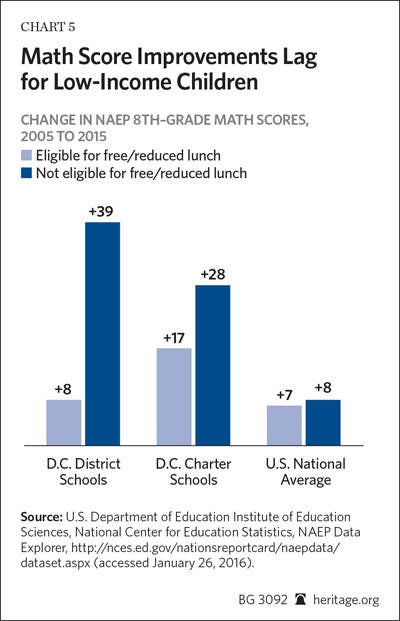
Chart 5 bears close examination—the national average for improvement among low-income students (FRL eligible) equaled seven points. In Washington, DC, improvement among regular public school students matched the national rate of improvement with an eight-point gain. The average gain for FRL students attending charter schools, however, equaled 17 points—more than double the national average gain. The same trend displayed in NAEP eighth-grade math repeats across other NAEP exams, with low-income students in charter schools having consistently higher scores than their low-income peers attending regular public schools.
An examination of students whose family income lies above the Free and Reduced Lunch eligibility threshold (effectively middle-income and high-income students) reveals a national gain of eight points. In Washington, DC, however, we see much higher gains for students from middle-income and upper-income families among both DCPS and DC charter students—39 points and 28 points, respectively.For students from low-income families attending regular public schools, the improvement has been unremarkable. Improvement for students from low-income families attending charter schools has, however, doubled the national average gain. That is, non-poor students attending regular public schools are seeing gains, as are poor children in charter schools. Yet, children from low-income families attending regular public schools are not seeing the same types of improvements. If Americans are hoping to see public education work as an engine of upward mobility, the gains among low-income students attending charter schools are an encouraging development.
The trend in academic data supports a nuanced conclusion. Despite decades of overall progress, public education in the District of Columbia remains troubled, with significant room for improvement. Coupled with sky high per-pupil spending, far too few District students acquire the sort of education needed to fulfill their potential. On the positive side, the District of Columbia’s charter school sector has produced better academic results at a fraction of the per pupil costs in the District. Moreover, the best may be yet to come for District charters. Economist Caroline Hoxby performed an analysis of scores on DC charter and regular public schools in 2004. Dr. Hoxby not only found evidence of higher scores in DC charters, but also of older schools producing higher scores.[9]
Schools, like most any organization, tend not to hit peak effectiveness in their earliest years. In addition, students generally experience a temporary academic setback after transferring to a new school. Thus, a charter sector with a large number of new schools filled with students who have transferred in from other schools can create an “optical illusion” in a snapshot test score comparison.[10] Charter schools sometimes therefore “improve with age” as established schools come to predominate. The best may be yet to come for DC charters.
Opportunity Scholarships Succeed but District Private Education Withers
At the time of this writing, supporters of the DC Opportunity Scholarship Program are seeking congressional reauthorization of the Scholarships for Opportunity and Results Act (H.R. 10). After Congress failed to reauthorize the program in 2015, The Washington Post noted:
The program was created in 2004 as part of a three-pronged investment in D.C. public education that funds the vouchers and provides extra allocations of federal dollars to the public school system and public charter schools. Indeed, the three-sector federal approach has brought more than $600 million to D.C. schools, with traditional public schools receiving $239 million, public charter schools $195 million and the voucher program $183 million. The vouchers have allowed thousands of students, predominantly minorities, to attend private schools. Parents of scholarship students have extolled the benefits of school choice and the positive impact of better schooling on their children’s lives. Interest in the program, according to its administrators, has never been higher.[11]
The Institute of Educational Sciences of the U.S. Department of Education produced four random assignment studies of the Opportunity Scholarship Program. These studies included a variety of random assignment evaluations. Random assignment studies represent the “gold standard” of empirical research and employ the same methods used to evaluate the effectiveness of medicine.
In these random assignment studies, graduation rate differences shine decisively in favor of scholarship students. Students who used their vouchers had graduation rates that were 21 percentage points higher than control-group students. Even better, students having previously attended low-performing public schools who were offered a scholarship demonstrated graduation rates 13 percentage points higher than the control group. Students from low-performing public schools who received and used scholarships graduated at a rate 20 percent higher than the control group.
The underwhelming state of graduation rates, especially for disadvantaged students, has been the single largest indicator that America’s schools are failing to give every student an equal chance at success in life. Graduating high school is associated with a number of critical life outcomes, ranging from lifetime earnings to incarceration rates. Researchers Patrick Wolf and Michael McShane calculated the financial benefits of higher graduation rates associated with the DCOSP:
Because a high-school diploma makes an individual less likely to commit crimes, it therefore decreases both the costs incurred by victims of crimes and those borne by the public in administering the justice system. Coupled with the increased tax revenue made on the increased income, this yields an extra benefit for society of over $87,000 per high-school graduate.
Multiplying the number of additional graduates by the value of a high-school diploma yields a total benefit of over $183 million. Over the time of our study, the OSP cost taxpayers $70 million, so dividing the benefits by the cost yields an overall benefit-to-cost ratio of 2.62, or $2.62 for every dollar that was spent.[12]
In sum, DC low-income students who received scholarships have higher graduation rates, higher student achievement, increased parental views of safety, and increased parent satisfaction. Indeed, there was not one single negative finding over the entire course of the evaluation. For a program that spent a fraction of the per pupil amount spent in DC public schools, these results are cause for celebration.
Despite this success, the scale and design of the DC Opportunity Scholarship Program has proven insufficient to halt what looks to be a trend toward a near extinction of DC private schools.
The DC Opportunity Scholarship program offers a maximum of $8,381 per child for students in K-8, and unless it is both reauthorized and redesigned one cannot help but wonder if there will be many private schools for these students to attend in the years ahead. Ironically, the charter school law operates as a de facto universal choice (open to all students in the District regardless of income) and reliably delivers funding of more than $14,000 per student. The funding for the Opportunity Scholarship program, meanwhile, is frequently in political peril and delivers a much smaller level of funding, which is restricted to low-income students.
From an equity standpoint, it is difficult to justify the District’s school finance system. The system routinely provides $29,000 for high-income students attending regular public schools. It provides $14,000 for high-income students attending charter schools but only a maximum of $8,381 for some low-income students who would like to attend a private school system that improves the chances for graduation by approximately 21 percentage points.
The Urban Institute data indicate the lack of an incentive to open a new private school with the anticipation of voucher funding in preference to a charter school in DC under this system of finance. In fact, District private schools have been closing while charter schools proliferate. The funding for charters is large, universally available, and reliable. The funding for DC Opportunity Scholarships, on the other hand, is small, restricted, and uncertain.
Sadly, the current system provides the least amount of support to the schooling system with the best track record of aiding disadvantaged students.
An Education Savings Account for Every DC Child
The current educational performance in the District of Columbia can be described as both much improved and severely underperforming. Despite improvement, DCPS spends a staggering amount of money per pupil and yet ranks near the bottom of American urban districts. District students have lost the most in the current system of education in DC, majorities of whom fail to obtain the knowledge and skills necessary for success in life, followed by taxpayers, who spend more than $29,000 per student.
Serious thought should be given not to just the desirability of such a system, but also whether such an ineffectual system is sustainable. The staffing to enrollment ratio in DCPS stood 31 percent higher than the national average for school districts with more than 15,000 students in 2012.[13] Would that DCPS achievement scores were 31 percent higher than the average for comparable students—or above average at all.
DC has a record of success in promoting greater parental autonomy and achieving better results at a lower cost to build upon. There have been very real and tangible benefits and students whose lives have been positively impacted by charters and Opportunity Scholarships. What has been done in the past, however, will prove most valuable if it leads to still bolder steps in the future.
Education Savings Accounts (ESAs): A Model for the District of Columbia
In 2011, Arizona became the first state to establish education savings accounts (ESAs). With an ESA, parents receive 90 percent of what would have been spent on their child in the public school into a restricted-use savings account, and can then use those funds to pay for private school tuition, online learning, special education services and therapies, textbooks, tuition, and other education-related services, products, and providers. Parents in Arizona can also roll over unused funds from year to year in anticipation of future education-related expenses, and can roll unused funds into a college savings account to pay for higher education expenses. Funding is not considered taxable income, and all expenditures must be reported quarterly to the state by providing receipts to the state department of education. Distributions into the ESA are also made quarterly, and are made after receipts for the previous quarter’s expenditures are provided to the department. Arizona can withhold a subsequent quarter’s distribution if there is any misuse of funds, in order to rectify the unapproved expenditure.

Like Arizona, four additional states now have an ESA option in place. Although each varies to some extent in eligibility and allowable uses, they operate under the same general premise: Parents can use a portion of the funds that would have been spent on their child in their child’s assigned public school to craft an education that matches their child’s unique learning needs. For example, in 2014, Florida became the second state to establish an ESA option, known in that state as Personal Learning Scholarship Accounts (PLSAs). Mississippi, Tennessee, and Nevada all followed suit, creating ESAs in 2015. Tennessee’s option, known as Individual Education Accounts will go into effect in the 2016–2017 school year, and Mississippi’s ESA option is currently a limited pilot program.
Most notable, however, is Nevada’s new ESA option. In establishing its ESA program, Nevada also became the first state to create a near-universal ESA option. Every student currently enrolled in a Nevada public school (453,000 students) is now eligible for an ESA, which will be worth $5,100 for most students, and $5,700 for students from low-income families or with special needs.
Families using an ESA are able to create customizable education plans that work well for their children. Holland Hines, an Arizona mother, uses her ESA to pay for private tutoring for her son E. J., who has special needs. Holland also purchases textbooks and curricular materials for her son, and pays for music therapy, among other educational therapies. Similarly, Marc Ashton used his son’s ESA to pay for a variety of educational options in Arizona. “A blind student in Arizona gets about $21,000 a year [in the public school system],” says Marc, whose son, Max, is legally blind. As Marc explained:
We took our 90 percent of that, paid for Max to get the best education in Arizona, plus all of his Braille, all of his technology, and then there was still money left over to put toward his college education. … So he is going to be able to go on to Loyola Marymount University, because we were able to save money, even while sending him to the best school in Arizona, out of what the state would normally pay for him.
Parents in Arizona are using their ESAs to customize their children’s education. Although many parents of children with special needs use their accounts to pay for educational therapies and specific curricula, parents of students from a variety of backgrounds, including those without special needs, use their accounts to tailor an education that uniquely fits to their children’s needs. About one-third of Arizona families use their accounts to fully customize their child’s educational experience, demonstrating that families use the unique features of ESAs—the customization and ability to roll over unused funds—which makes the accounts distinct from traditional school voucher models.
Transforming education in the District of Columbia into an all-ESA district—establishing a truly universal policy to create education savings accounts for every DC student—would transform the existing school finance system from one that is based on student enrollment counts in boundary-defined regular public schools to one that is student-centered and responsive to the needs of individual families. Although DC families can currently participate in a lottery process to choose a school outside their district-boundary assignment, not all participants receive their choice of schools. Instead of a system with limited choice for families, predicated on a lottery system, all families in the District should have control over their child’s share of education funding, and should be able to take those funds to any school or education option of choice.
Establishing education savings accounts for every DC child would create unparalleled options for District families, empowering those children from low-income families in particular who have had few choices in the past. It would enable families to send their children to any school of choice, but also to purchase additional educational tools—such as textbooks, online courses, and educational therapies—to have the greatest chance of success for their children. Transitioning into an all-ESA district would also put Washington, DC, at the forefront of education reform, serving as a model for other districts and states throughout the country.
Two Paths Forward
Instead of attempting to restructure or “reform” DCPS, policymakers should free District parents to reform education from the bottom up. Toward that end, Congress, which has jurisdiction over Washington, D.C., can take one of two approaches to implementing district-wide education savings accounts. Either would make K-12 funding become child-centered, no longer automatically designated for the government school system. Both options would empower every family to choose from a variety of learning options that fits their children’s unique learning needs and would likely foster a robust supply-side response from providers.
-
Establish an all-ESA District. Congress could reconfigure all education funding in the District of Columbia and establish an all-ESA district. Instead of funding a system of schooling that remunerates regular public schools based on enrollment, funding for K–12 education in DC could go directly into a parent-controlled education savings account. Parents would then be able to voluntarily contract with the schools and service providers of their choice, including regular public schools, charter schools, and private schools.
This approach would transform all schools into schools of choice by making parental control the default position—a profoundly different step than vouchers or charters, which basically create an opt-out for families who want to choose something other than the district option. Such a reform would not entitle any service provider or school to funding, unless a student decides to enroll or purchase a given course or education product or service.
Moreover, this option creates an incentive to economize—on both the consumer and provider side. Providers would compete for families’ dollars, and families would be able to use their accounts to pay for the widest variety of education-related services, products, and providers, and to roll over unused funds from year to year.
Finally, this proposal would be more equitable to the alternative options currently available in Washington, DC. In converting all per pupil funding to education savings accounts, Congress would establish a set per pupil allocation based on the aggregate of existing K–12 education funding. Students could carry this funding to any school of choice—public, private, or charter—and to contract with other education service providers, such as tutors and educational therapists. This would level the playing field among private schools, charters, and regular public schools since government would no longer automatically be subsidizing the regular public school sector.
-
Create a stand-alone ESA program to run parallel with existing options. Congress could also establish a stand-alone ESA option that is universally available to all DC students. This would be an opt-in option, where the default would remain that funding flows to, and students enroll in, their regular public school, but every child would be able to exercise choice using an ESA if desired.
Under an ESA program, any student could choose to use an ESA, with the funding that would have been spent on the child in the public system deposited instead into their account. Funding for the ESA would be a portion of what is spent in DCPS or DC public charter schools. Parents could then use their ESA to pay for tuition at a private school, to take individual public school or public charter school courses, to pay for special education services and therapies, to purchase textbooks and curricula, to pay for online classes, and to otherwise craft a tailor-made educational experience or their child. Parents could roll over unused ESA funds from year to year in anticipation of future education-related expenses, and could also use ESA funds for future college expenses. While this would have a less dramatic effect in transforming the regular public school system than the option above—in which the default setting is parent choice—it would have significant impact in making the system more responsive to student needs.
Toward Reform
Rather than have politicians attempt to restructure or “reform” DCPS, policymakers should free District parents to reform education from the bottom up. A decade and a half of top-down reform of the district has left a system that ranks near the bottom of urban districts. In the process, Congress would provide many of these students with a greatly expanded opportunity to save for future higher education expenses. Given the limitations of government to meaningfully improve a $29,000 per child system, it would be best to reform it through a model that empowers families.
Building on the limited choice options currently available in the nation’s capital, policymakers should establish an equitably funded education savings account for all DC children.[14] Congress should follow the lead of states like Arizona and Nevada, and create an ESA program that is universally available to all District students.
—Matthew Ladner, PhD, is Senior Advisor of Policy and Research at the Foundation for Excellence in Education.

