President Barack Obama and Members of Congress in both parties want to end the budget caps and the sequester cuts that enforce those caps. President Obama called the caps “mindless austerity” when he released his budget in February.
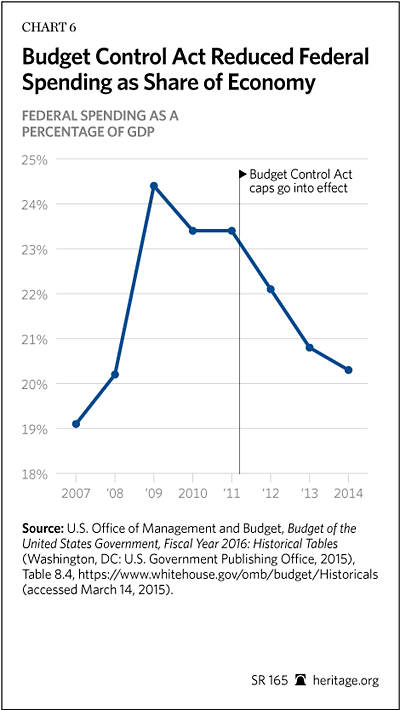
These caps and sequester are a byproduct of the famous 2011 “debt ceiling” negotiations between Obama and House Speaker John Boehner (R–OH). Before those negotiations, the federal government was spending 24.4 percent of gross domestic product (GDP). In 2014, expenditures fell to 20.3 percent.
The Budget Control Act of 2011 (BCA), enacted on August 2, 2011, reestablished limits on discretionary spending through fiscal year (FY) 2021. Despite its flaws, the BCA has been one of the most successful lids on federal spending in modern times.
An increasing number of Republicans—such as Senator John McCain (R–AZ), Senator Kelly Ayotte (R–NH), Representative Robert Wittman (R–VA), Representative Mike Turner (R–OH), and Representative Mac Thornberry (R–TX)—indicate that they want to suspend the caps as well, at least on military spending. Rather than bust the overall caps, fiscal conservatives should insist on funding increases in defense spending with reductions in domestic spending. Anything else would be a monumental tactical blunder because it would surrender to the White House all of the fiscal leverage the Republicans now have on the budget.
The Budget Control Act
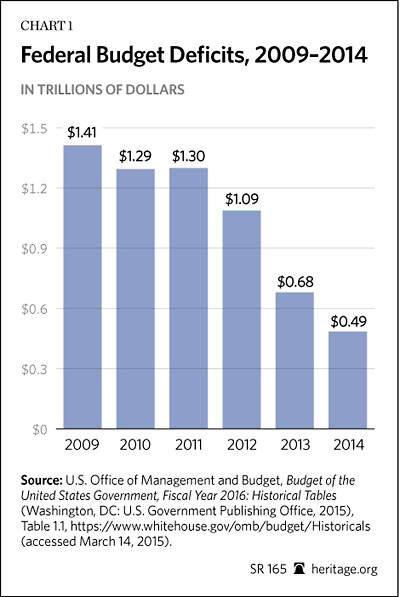
The Budget Control Act is one of the reasons that the budget deficit fell from the towering heights of more than $1.4 trillion of red ink in 2009 to less than $500 billion in 2014.[1] (See Chart 1.)
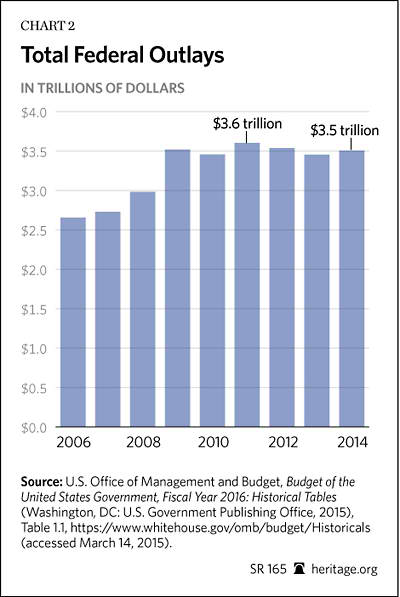
The BCA budget cuts made possible the drop in total federal outlays (in nominal dollars) from $3.603 trillion in 2011 to $3.506 trillion through FY 2014. This is the first three-year stretch of declining federal outlays since Dwight Eisenhower’s first term in office.[2] (See Chart 2.)
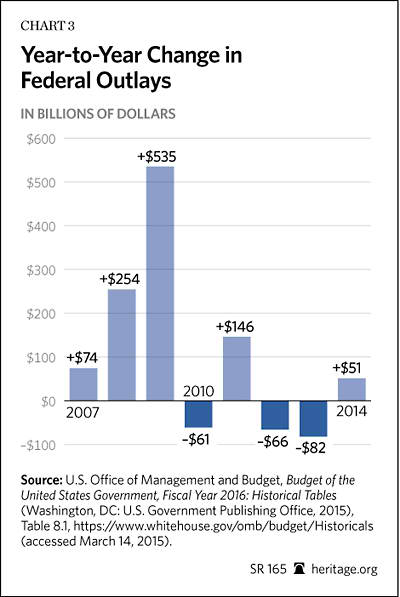
To fully appreciate this turnaround in budget policy, one must consider the breadth of the Washington spending binge beginning in George W. Bush’s last full year in office through Barack Obama’s first two. From 2007 to 2011, federal expenditures sprinted forward by $874 billion in nominal dollars[3]—a near one-third blowout during an era of modest inflation (less than 10 percent cumulative).[4] From 2011 to 2014, spending has fallen by $97 billion.[5] (See Chart 3.)
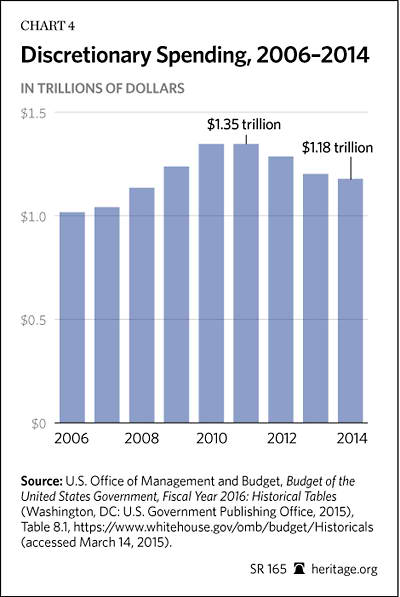
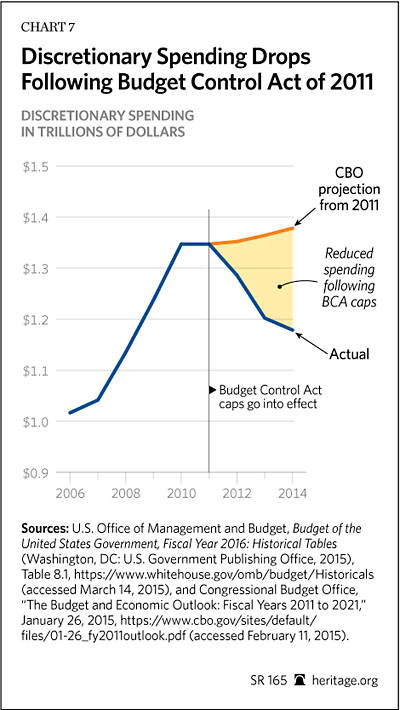
The caps have restrained discretionary spending. After peaking in 2011 at $1.347 trillion, discretionary spending has been sliced and diced to $1.179 trillion in 2014—a 12.5 percent three-year cut in agency spending, not from the baselines but in nominal dollars spent. Adjusting for inflation, these programs have been cut by 16 percent.[6] (See Chart 4.)
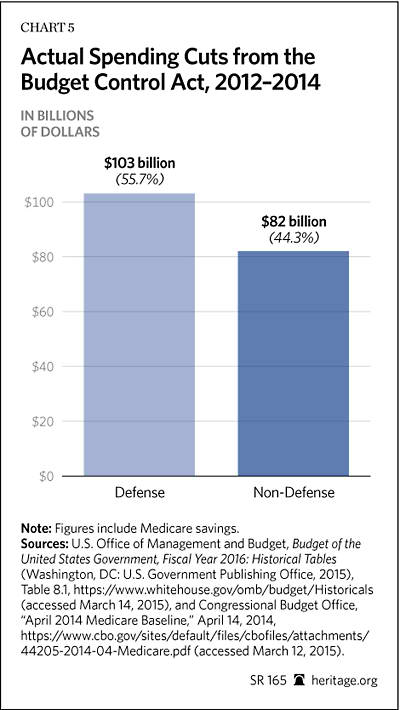
Many conservatives rightly warn that the severity of the military cuts have weakened national security. However, domestic programs (including Medicare) have absorbed more than 44 percent of the cuts in spending from 2012 to 2014.[7] (See Chart 5.) Everything from transit grants and foreign aid to the IRS, the Legal Services Corporation, Public Broadcasting subsidies, Head Start, and bridges to nowhere have felt the blade.
Spending cuts have been positive for the economy. Total government spending as a percentage of GDP has plummeted from 24.4 percent in 2009 to 20.3 percent in 2014.[8] From 2011 to 2014 alone, discretionary spending dropped by 2 percentage points of GDP.[9] The economic growth rate, although still far too low, has crept upward as government spending has fallen. No evidence indicates that spending cuts have restrained growth, despite the predictions of many economists. The 4.1 percentage point reduction in federal spending is the equivalent of $714 billion (based on the GDP in 2014)[10] in resources remaining in the private sector each year rather than being squandered by the federal government. This constitutes one of the largest fiscal retrenchments in modern times.
Actual discretionary spending (in nominal dollars) from 2012 to 2014[11] was $427 billion lower than projected by the Congressional Budget Office (CBO) in January 2011 prior to the caps’ implementation.[12] The BCA caps and sequester made this reduction possible.
The BCA’s Flaws
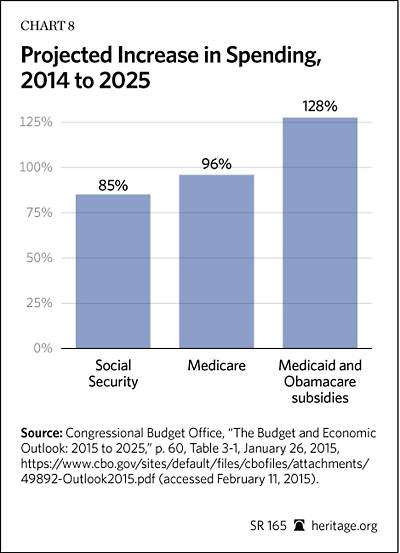
To be sure, the BCA has significant flaws. The biggest defect is that the entitlement spending on Medicare, Medicaid, Social Security, and other welfare programs is allowed to continue to grow on autopilot because they are outside the BCA caps and largely untouched by its sequester cuts. The budgets for the big three programs—Medicare, Medicaid, and Social Security—and the new Obamacare subsidies are expected to nearly double (86 percent growth) from 2014 to 2025.[13] (See Chart 8.)
Spending is rising substantially in 2015, up 8 percent so far in the first four months of FY 2015 compared with FY 2014. Medicaid spending is up nearly 23 percent, an increase the CBO attributes “largely” to certain Obamacare provisions that went into effect in January 2014. This jump does not even include the Obamacare insurance exchange subsidies that are now in place—a $7 billion increase so far this year.[14] Medicaid and the Obamacare subsidies account for $28 billion of the $88 billion in mandatory spending increases this year. The extent to which growth of Obamacare and other entitlements is responsible for this increase is even more pronounced than at first glance. The government has received just $7 billion in net revenue from government-sponsored entities (GSEs) this year—$32 billion less than in 2014 at this point. Leaving GSEs out of the equation, increases in Medicaid and Obamacare subsidies accounted for half of the mandatory spending increase so far this year. Meanwhile, defense spending is down nearly 5 percent.[15]
These fiscal Goliaths are only minimally constrained by the BCA because the White House steadfastly resisted any reductions to their meteoric growth rate outside a 2 percent reduction in total Medicare payments. Yet this 2 percent reduction saved $5 billion in 2013 and $11 billion in 2014.[16] Indeed, the President’s FY 2016 budget request contains virtually no meaningful entitlement reforms. The prospects of any market-based entitlement restructuring under President Obama appear slim at best. The best possibility for needed entitlement reforms is to keep the discretionary caps and sequester—which were recently extended beyond 2020—cemented in place.
Many Republicans complain that the military cuts have been severe—and they have been. While winding down military operations in Iraq and Afghanistan is responsible for some of the reduction in military spending, the base Department of Defense budget has shrunk as well. Compared with 2011, discretionary defense expenditures fell by $103 billion between 2012 and 2014, roughly a 14.7 percent cut. Defense spending as a share of GDP fell from 4.5 percent to 3.5 percent during this same period.[17]
While Congress supplemented the base defense budget for Overseas Contingency Operations (OCO) by $85 billion in 2014 and another $64 billion this year, these OCO supplements do not address the long-term needs of national defense. Regrettably, rather than strategically eliminate waste, much of these savings have been realized by delaying much needed modernization programs.
Both Republican and Democratic appropriators have resisted rooting out the waste and social spending in the defense budget. The Pentagon, for example, rolled out a $7 billion spending spree on renewable energy projects in 2013. In the fall of 2014, the Department of Defense announced a $210 million award for the construction of bio-refineries. Arming U.S. troops and securing the homeland should take precedence over ideologically driven climate change programs, especially in times of fiscal constraint.
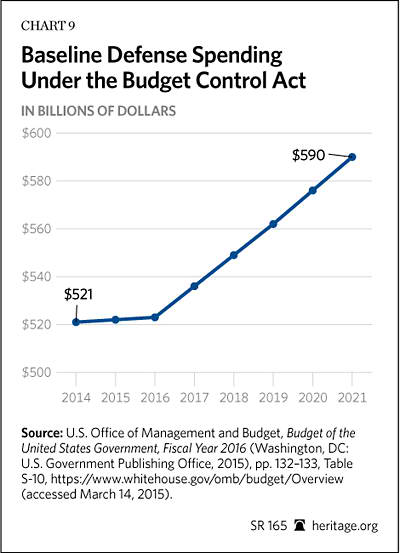
During the remaining six full years subject to the BCA caps (2016–2021), baseline defense spending is permitted to rise $68 billion—a 13 percent increase.[18] (See Chart 9.)
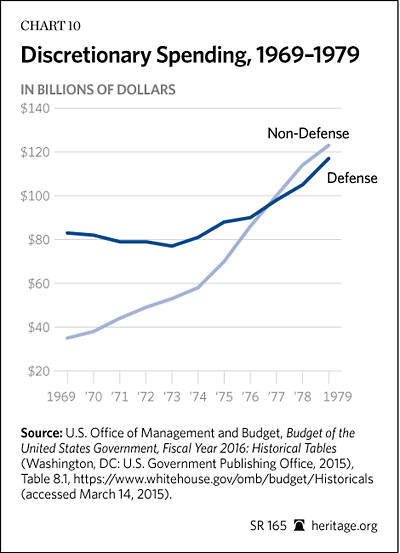
The big fiscal victory for conservatives is that domestic discretionary programs have been slashed at the same time. There has been no replay of the post-Vietnam domestic spending boom that liberals scored in the 1970s. From 1968 to 1978, military spending as a percentage of GDP shrank by nearly half, dropping from 9.1 percent of GDP to just 4.6 percent. Meanwhile, all other spending jumped from just 10.7 percent of GDP to 15.5 percent—a nearly 50 percent increase.[19]
In this light, the BCA has put an electric fence around the left’s grand spending ambitions. Chart 10 shows how the situation in the 1970s played out far differently.
Spending Caps Breaches
Finally, Congress has already partially lifted the original BCA caps more than once. This is unrelated to the tens of billions of dollars in discretionary spending each year for overseas contingencies and emergencies not subject to these caps.
The first breach was partial. The continuing resolution enacted on September 28, 2012, funded the government for the first six months of FY 2013 and lifted the base budget by $11 billion above the BCA cap for defense discretionary spending while reducing the base budget for non-defense discretionary spending by the same amount. Thus, the total amount of discretionary spending under the caps was unchanged.
However, on January 2, 2013, just months later, President Obama signed into law the American Taxpayer Relief Act of 2012 in a partial resolution to the impending fiscal cliff. This affected fiscal policy in two ways. First, it moved the trigger date for the automatic sequester cuts under the BCA forward by two months to March 1, 2013. Second, the sequester cuts were reduced from $109 billion to $85 billion for FY 2013.[20]
The Bipartisan Budget Act of 2013 (BBA), signed into law on February 15, 2014, rolled back the budget caps. The caps for both non-defense and defense discretionary spending were lifted by $22.4 billion each for FY 2014. In addition, the caps for FY 2015 were lifted by about $9 billion each for both non-defense and defense discretionary spending.
Under the BBA, the sequester caps are to be fully restored in FY 2016, but political leaders in both parties are pushing for amelioration or full reversal of these spending caps. More capitulations to the spending forces in Washington will almost certainly render the caps toothless. Without the caps, spending will be much higher in 2016 and going forward.
From Where Did the BCA Come?
The financial crisis of 2008 and 2009 triggered a new era of hyper government activism not seen since at least the 1960s. President Bush responded to the crash of the financial system and the housing market with nearly unprecedented federal expansions. These included tax rebates, spending stimulus programs, and bailouts of the banks, insurance companies, and Fannie Mae and Freddie Mac. Federal spending in 2009 was $675 billion higher compared with spending in 2007, not counting the Obama stimulus plan—an increase of nearly 25 percent in just two years.[21]
President Obama doubled down on that spending trend. One of his first acts in office was the $830 billion stimulus plan,[22] which was followed by auto bailouts, cash for clunkers, and the Obamacare subsidies. The federal debt rose from $10.6 trillion when Obama took the presidential oath to more than $15.2 trillion at the end of 2011. All of this deficit spending was supposed to accelerate the recovery. It did not. The recovery from the third quarter of 2009 through 2012 was the shallowest of the eight recoveries in post–World War II America.
In 2010, the Republicans won a historic midterm election sparked by a Tea Party movement that demanded less spending and debt and an end to bailouts. With Republicans in charge of the House and John Boehner as the Speaker, the Republican leadership began extensive debt and spending negotiations with the White House. After a brief government shutdown, the GOP and the White House agreed to the Budget Control Act.
The BCA’s major feature was the spending caps and the sequester mechanism to enforce those caps. These were actually the brainchild of then–White House Budget Director Jack Lew, the lead budget negotiator for the White House.
In the final days of the 2011 debt-limit showdown between President Obama and Speaker Boehner, Boehner and then–House Majority Leader Eric Cantor (R–VA) shrewdly agreed to the cap-and-sequester mechanism proposed by Jack Lew. With half of the cuts coming from defense and half from domestic discretionary programs, Lew had evidently thought he had set a trap because Republicans would never go along with these tight military spending ceilings. Hence, the caps would force the GOP to agree to raise taxes.
Yet in the winter of 2013, Boehner and Cantor rejected the entitlement-reform-for-tax-hike grand deal that Obama was offering (which would have caused a civil war within the GOP) and instead embraced the binding spending controls with automatic sequester cuts to enforce them. For liberals this turned out to be a nightmare scenario.
The caps reduced discretionary budget authority by $30 billion in FY 2012.[23] Despite the GOP acquiescence at the end of 2012 to the American Taxpayer Relief Act of 2012, the sequester, which began in March 2013, saved another $85 billion in FY 2013.
Even with the partial rollback of the caps, spending has remained on a downward path. In 2014, federal expenditures dropped to 20.3 percent of GDP, a drop of 4.1 percentage points since 2009. The last decline in spending this steep took nine years, from 1991–2000.[24]
Some of these savings are due to the decline in interest rates that have dramatically lowered federal borrowing costs. Net interest on the federal debt from 2012 to 2014 was nearly $313 billion less than CBO estimates from January 2011.[25] Some of the decline is due to the repayment of money to the Treasury from Fannie Mae, Freddie Mac, and the banks that received bailout funds under the Troubled Asset Relief Program (TARP). These are generally scored as “negative outlays” and therefore are counted as spending “cuts.” From 2012 to 2014 the deficit fell by $171 billion from GSEs, primarily Fannie Mae and Freddie Mac,[26] and an additional $12.6 billion from positive changes in the valuation of TARP assets.[27]
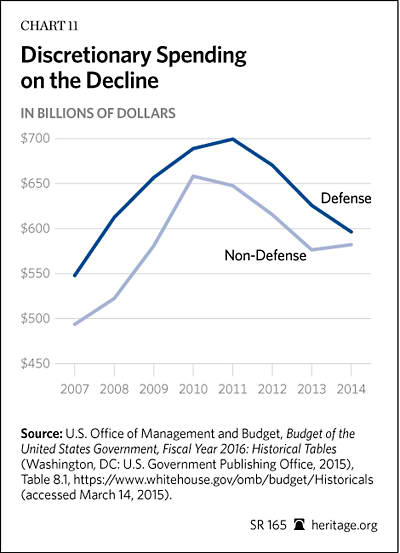
Yet discretionary spending has fallen well below the baseline of where it was headed before the BCA took effect. This is all the more remarkable because these are the programs on which Obama had hoped to spend much more as President. He calls these programs “investments,” but he has been constrained in spending more on them in his second term. This is why he is so obsessed with ending the caps.
Chart 11 shows the cuts in discretionary non-defense programs and defense programs.
Even with the upward adjustments in the caps, Republicans can constrain spending at least through the end of the Obama presidency by sticking with the caps. Discretionary spending is expected to fall to 6.0 percent of GDP by 2017 and 5.6 percent by 2020.[28] These forecasts depend greatly on how much the GDP grows over the next two to five years.
Entitlements Still Growing Rapidly
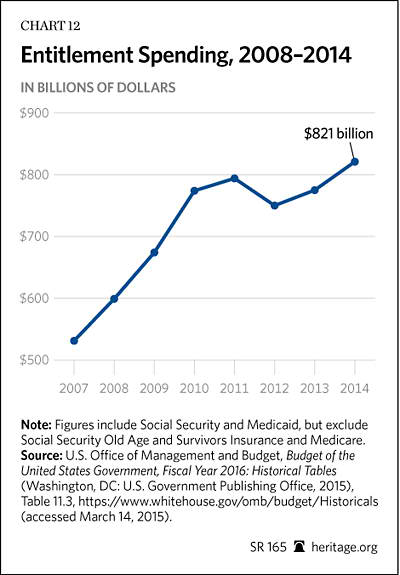
Entitlements are still the big spending problem and will continue to be for the next decade. They are not covered by the sequester. During his six years in office, Mr. Obama has proposed almost no cuts in even the rate of growth of income transfer programs. Chart 12 shows the growth of more than 80 welfare programs since 2007—including food stamps, unemployment insurance, housing aid, Medicaid, and disability payments. Some of these increases were results of the recession, while others were due to Obama policies that expanded eligibility and cancelled work requirements. Since 2008, spending has soared 37.2 percent in these programs. Since 2007, spending has mushroomed nearly 55 percent.[29] (See Chart 12.)
As discussed earlier, growth of 86 percent through 2025 compared with 2014 of Medicare, Medicaid, Social Security, Obamacare subsidies, and the Children’s Health Insurance Program is predicted.[30] President Obama has rejected almost all proposals to trim the growth rates of spending and continues to demand tax increases as part of the solution.
Obamacare costs exploded in early 2015. The CBO reported in early February that Medicaid spending for the first four months of the fiscal year is up a stratospheric 23 percent thanks to massive new enrollments. This Medicaid number does not even include the $7 billion in new Obamacare “exchange subsidies” spending so far this year. Taking this into account, the “Affordable” Care Act is responsible for a nearly 30 percent hike in Medicaid and insurance subsidies so far in FY 2015.[31] As more Americans enroll for the subsidies, the costs imposed on the Treasury will continue to rise. These preliminary numbers give further reason to question President Obama’s promise: “I will not sign a plan that adds one dime to our deficits.”[32]
Spending Cuts and the Economy
Liberals argue that the spending cuts due to the sequester and caps have held back the economy. They believe that government spending is a stimulus to the economy, which was the justification for the $830 billion stimulus plan. That plan assumed a “multiplier effect” from government deficit spending of roughly $1.30 extra economic output from every $1 spent.[33] This is because the spending circulates throughout the economy as the dollars move from one business or worker to another.
That clearly did not pan out in 2009–2011 when almost all of the money was spent. Chart 13 shows that unemployment remained elevated above the anticipated level throughout the period.
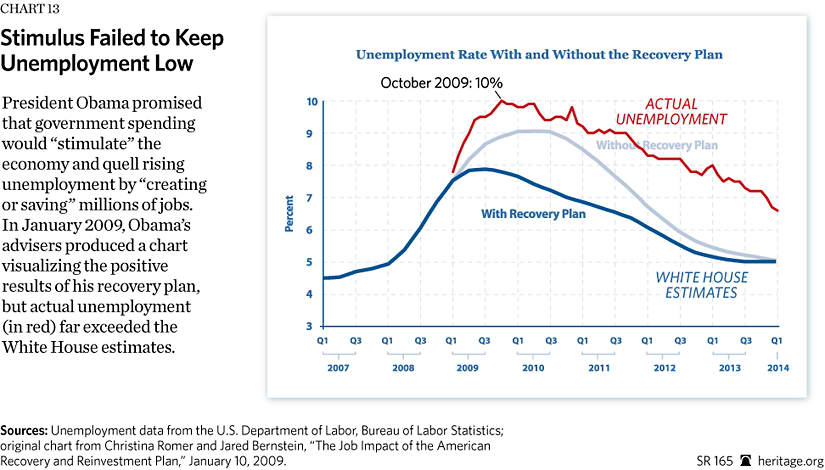
Furthermore, not only did the economy far underperform the target of 3.764 million jobs created from February 2009 to December 2010, but even more embarrassing, the economy created fewer jobs with the stimulus than the Obama economists with their Keynesian models predicted it would without the stimulus. These economists predicted jobs growth without the stimulus would be 512,000 during this period. In reality, the economy lost more than 2.5 million jobs.[35] In sum, the multiplier effect from the Obama stimulus appears to be negative.
Now the same people that advocated stimulus spending in 2009 wants another dose of deficit spending to promote faster growth. President Obama said as much when he released his FY 2016 budget and complained that sequester cuts have caused “underinvestment” in high-priority programs such as infrastructure. Paul Krugman of The New York Times and other leftist economists have savagely attacked the budget cutting of recent years and have predicted a slowdown in growth and even a recession as a result of government downsizing. As Krugman stated in October 2013, the “sharp fall since 2010 in discretionary spending as a share of G.D.P. … has depressed both growth and employment.”[36]
Those predictions have not panned out either. If anything, the more the budget has been cut, the better job growth and economic growth have been. The economy is now growing at close to 3 percent annually and the private economy has grown even faster.
To be sure, this is still a flimsy recovery, thanks in no small part to Obamacare, tax hikes, and regulatory surges. But zero evidence shows that spending cuts have been the economic curse that the Keynesian economists had predicted. Economic growth and government spending have moved in opposite directions of late—as has been the case for most of the past 50 years.
The best explanation for the resumption of growth is the free-market model. Scaling back government has stimulated the American economy. As Milton Friedman taught more than 50 years ago, reductions in federal spending free up the nation’s resources for private-sector growth and are the economic equivalent of a tax cut. The “multiplier effect” from government spending is again proving to be a myth, and the U.S. is experiencing what might be described as an anti-Keynesian growth accelerator.
Many economic studies have found that the multiplier effect of government spending is far less than the Keynesians believe. For example, Harvard economics professor Robert Barro conducted analyses on the multiplier effects of government spending throughout World War I, World War II, the Korean War, and the Vietnam War. He estimated wartime expenditures of 0.8. In other words, every $1 of government spending raised GDP by $0.80. In addition, Barro stated that attempting to “estimate directly the multiplier associated with peacetime government purchases” resulted in “a number insignificantly different from zero.”[37] In other words, even during wartime, private-sector GDP fell by 20 cents for every $1.00 in government military spending. A multiplier of zero in effect means that every $1 of government spending comes at the expense of $1 of private GDP growth.
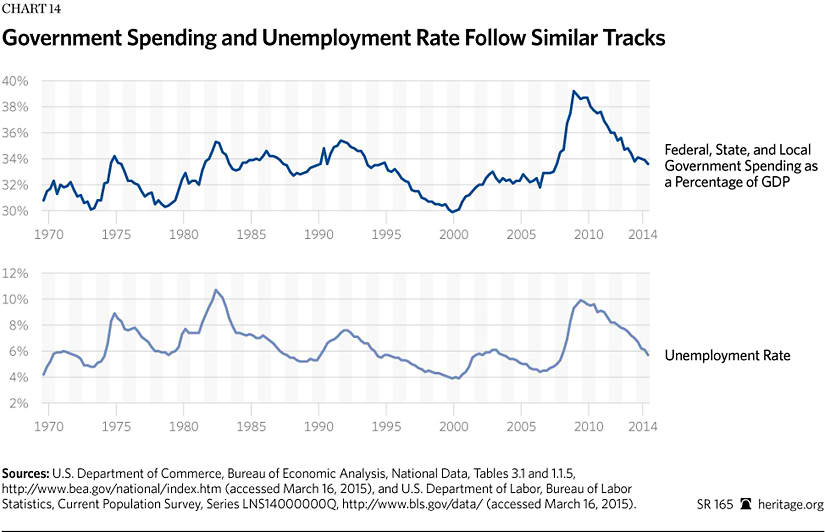
This collapse of the Keynesian stimulus model has been the real tale of the U.S. economy for many decades. For instance, Chart 14 shows that government spending is negatively associated with the unemployment rate.
This is one more reason to reject the Obama budget, which calls for a 7 percent rise in “investment” spending in the federal budget for more “shovel-ready” projects. He would spend some $362 billion above the budget caps over the next six years.

Conclusion
The BCA is far from ideal, but it has produced beneficial results for the U.S. economy and the federal fiscal situation. Under the Budget Control Act, total federal outlays have fallen from $3.603 trillion in 2011 to $3.506 trillion through FY 2014.[38] This is the first three-year stretch of declining federal outlays since Dwight Eisenhower’s first term in office. The BCA slammed the brakes on the reckless government activism of 2008, 2009, and 2010.
The Washington Post recently called for the cessation of the sequester, complaining that across-the-board cuts are the antithesis of “governing” and a substitute for “making choices.” But this misses the point. The BCA is necessary and desirable precisely because Congress and the President will not make tough choices. The default position instead of cutting wasteful expenditures is to borrow more and more—now $18 trillion. Borrowing to push the costs of current consumption onto future generations is the essence of bad and unaccountable government. Government is about choosing, but this government, which has run $1.4 trillion deficits, refuses to choose.
If President Obama engineers another end run around the caps with his proposed $74 billion in new spending this year and $362 billion over five years, the discipline of the BCA will be forever lost, and we will be back to the free-for-all of 2009 and 2010. Defense spending has been cut sharply. But to restore sensible national security policy, appropriators need to eliminate waste from the defense budget and defund the billions that are diverted to nonsecurity programs, such as a multibillion-dollar green-energy programs, that Obama has stuffed into the Pentagon budget. Rather than bust the overall caps, fiscal conservatives should insist that any increases in defense spending be funded with reductions in domestic spending.
If, instead of accepting Obama’s spending binge offer, Republicans can hold to the caps and allow sequester cuts if spending comes in over target, the fiscal picture continues to improve. Under the existing caps, federal discretionary spending will remain benignly flat through the end of 2017. If growth picks up to 3.5 percent, spending could fall below 19 percent of GDP by 2024 compared with the 22.4 percent estimated under the 2016 Obama budget proposal.
Stephen Moore is a Distinguished Visiting Fellow in the Institute for Economic Freedom and Opportunity at The Heritage Foundation. Joel Griffith is a Research Associate in the Institute for Economic Freedom and Opportunity at The Heritage Foundation.


