The Great Recession of 2008–2009 and the European debt crisis of 2010–2012 were the greatest interruption in economic growth since the Second World War. A debate has raged since the recession began between economists who believe that government spending is the problem and those who believe it is the solution. Available data show neither a uniform European “age of austerity,” nor has any government been a consistent model of fiscal responsibility, low taxation, and economic freedom.
To better understand the recent experience of fiscal policy in Europe and beyond, The Heritage Foundation published a Center for Data Analysis Special Report,[1] provided a downloadable data compendium,[2] and sponsored a symposium[3] featuring two scholars at the cutting edge of research on fiscal policy—Alberto Alesina of Harvard University, who co-authored the first chapter of the Special Report, and Daniel Leigh of the International Monetary Fund (IMF).
In Chapter 2 of the Special Report,[4] I examined data on deficits, spending, taxes, and growth to characterize the fiscal-policy stances of 37 European countries. I found that structural deficits were a strong predictor of, first, stimulus and, later, deficit reduction: Countries with sounder fiscal fundamentals had greater policy flexibility at every stage. I documented the wide variety of fiscal policies that were pursued in different countries, contrary to some of the popular generalizations about “European austerity.” And, in Chapter 3, I confirmed that the recent data fit the established empirics of deficit reduction: Tax increases are much more harmful than spending cuts.[5] The differences in the effects of tax increases and spending cuts is large enough that lumping the two together under the label “austerity” conceals more than it reveals about fiscal policy.
The data compendium, which can be downloaded from The Heritage Foundation website, is a compilation of some well-known data from datasets from the Organization for Economic Co-operation and Development (OECD) and the IMF, with less-known data from academic papers, OECD reports, and dusty 2008 stimulus plans. The compendium is easy to use and is designed to allow researchers to answer their own questions about fiscal policy during the crises.
Where possible, the compendium includes two or more measures of the same economic phenomena, as there are often discrepancies between them. Rather than choosing a preferred set of measures, the compendium and the Special Report embrace the complexity in the data and allow readers and researchers to draw their own conclusions.
This Backgrounder serves as a summary of the project to date, profiling the most important findings from a year of research.
Tax Increases or Spending Cuts?
One of the main lessons of the scholarly literature on deficit reduction is that it is a mistake to lump together tax increases and spending cuts.[6] In the Special Report, Alberto Alesina and Veronique de Rugy review the last two decades of academic writing on deficit reduction, which they term “fiscal adjustment”:
[Economists] seem to have recently reached a consensus that spending-based fiscal adjustments are not only more likely to reduce the debt-to-GDP ratio than tax-based adjustment, but also less likely to trigger a recession. In fact, if accompanied by the right type of policies—especially changes in public employees’ pay and public pension reforms—spending-based adjustments can actually contribute to economic growth....
However, it is important to refrain from oversimplifying these results because fiscal adjustment packages are often complex and multiyear affairs. Many successful (i.e., expansionary and debt reducing) fiscal adjustments in this literature are ones in which exports led growth when the rest of the global economy was healthy or even booming. While there has been some recovery in the midst of the recession, we should recognize that achieving export-led growth may be much harder today when many countries are struggling.
While austerity based on spending cuts can be costly, the cost of well-designed adjustments plans will be low.... [T]he alternative for certain countries could be a very messy debt crisis.[7]
Presenting research at The Heritage Foundation in October 2013, Daniel Leigh of the IMF showed that he and his colleagues estimate that tax-based fiscal consolidations lead to three or four times as much decline in consumption and gross domestic product (GDP) as spending-based fiscal consolidations.[8]
The evidence from fiscal policy over the past five years tends to confirm the main finding of the literature: Deficit reductions by cutting spending are much less harmful to growth than tax-based deficit reductions. However, a single episode should never be over-interpreted, and this is no exception.
Because total deficit cuts (as measured by the IMF Fiscal Monitor[9]) were uncorrelated with the composition of deficit cuts (spending versus taxation), it is at least reasonable to look for differential effects of taxes and spending on growth.
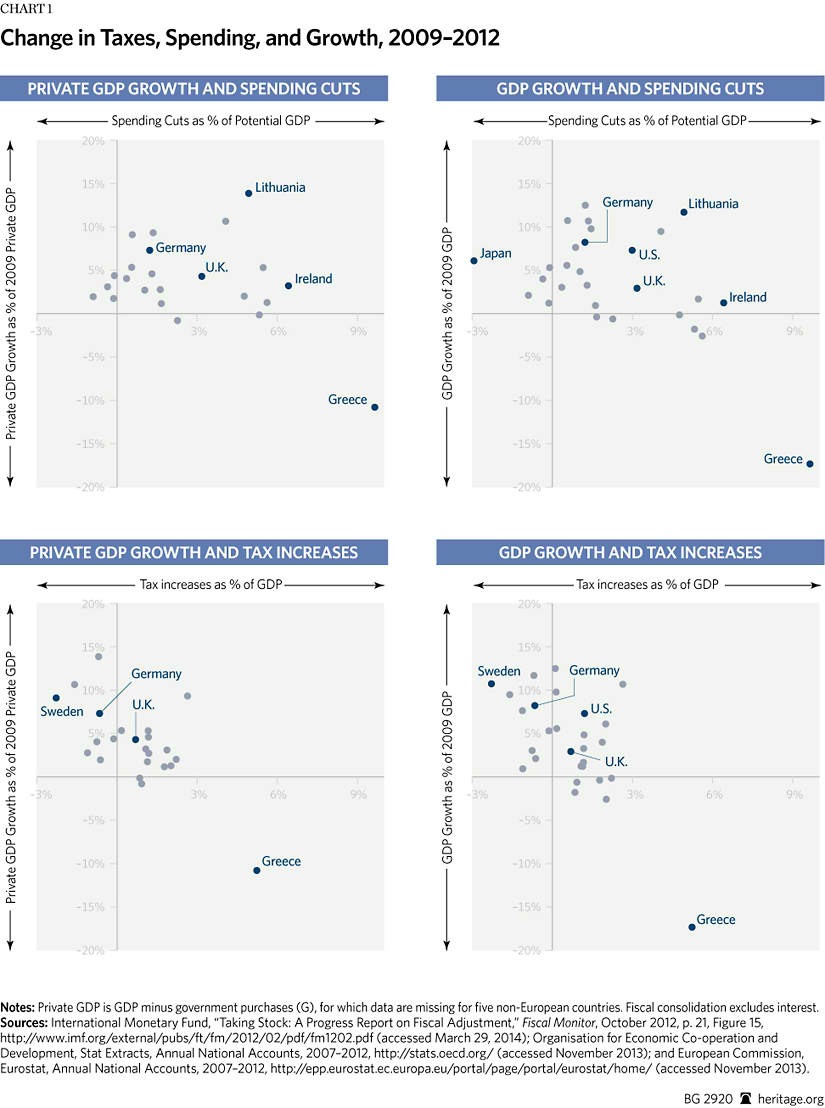
Using the most straightforward regression analysis, I found a tax multiplier of –2.0 and a spending cut multiplier of –0.7. That means that one dollar of tax increases was associated with two dollars less GDP in 2012, and one dollar of spending cuts only decreased GDP by 70 cents. But government spending is directly counted in GDP, so I also ran the same regression using private-sector GDP as the dependent variable. In that case, the coefficient on taxes was the same, but the spending multiplier dropped to zero: There was no correlation between government spending and private-sector GDP.
Chart 1 shows the relationships between taxation and growth, and between spending and growth, from 2009 to 2012, showing total and private-sector GDP.
Using another approach, I took the total amount of fiscal consolidation as given, and analyzed the effect of composition directly. Composition mattered: By 2012, a country that relied on taxes for 80 percent of its deficit reduction had grown 3.1 percentage points less than a country that relied on spending for 80 percent of its deficit reduction. The estimated effect is large, but it is also imprecise.
Preparing for the Storm
Countries that exercised fiscal responsibility and reformed entitlements before the Great Recession had far more policy flexibility during the crisis and were less likely to suffer a severe or prolonged slump.
Fiscal prudence and reform during good times allow flexibility to smooth out part of the shock of recessions with tax cuts or added government purchases. Countries with budgets closer to balance and lower borrowing costs in 2007 enacted systematically larger stimulus plans in 2008 and 2009.[10] Sweden’s reforms in the 1990s are exemplary of the prudence that allows fiscal flexibility in a crisis. By the time the crisis occurred, taxes were lowered, pension reforms had taken pressure off the country’s long-term finances, and the Swedish krona was still independent of the euro.
Portugal, by contrast, had raised income taxes and allowed pensions to grow rapidly.[11] Well before the financial crisis, Portugal’s economy was in a slump. As Olivier Blanchard wrote in 2006, “The Portuguese economy is in serious trouble: Productivity growth is anemic. Growth is very low. The budget deficit is large.... [I]n the absence of policy changes, the adjustment is likely to be long and painful.... Deficit reduction is required.”[12]
But, between 2007 and 2010, Portugal increased non-transfer spending almost twice as much as Sweden and the average tax rate rose in Portugal while it fell significantly in Sweden. Needless to say, Sweden’s growth rate and unemployment have been vastly better than Portugal’s. Instead of catching up to the wealthier parts of Europe, Portugal’s policies have dragged it further behind.
The world’s better-prepared economies experienced a relatively normal recovery from the global recession, although it was slower than usual in many countries, including the United States. But countries that had been fiscally irresponsible prior to the crisis were likely to slip into a second recession (or full-blown depression) as worries grew about their debt trajectories.[13]
Many countries tightened their deficits after the recession-era spending binge in order to bring their finances under control. Most countries drew down their temporary spending increases, many raised taxes, and some cut spending below pre-recession levels. Looking at the 2007–2012 period as a whole, there was a systematic shift toward more spending and more taxes in the large European economies.
Although the composition of each deficit reduction was subject to extensive policy debates, the size of the reduction was almost completely determined by the fiscal situation. Within the eurozone, the 2009 structural deficit is an almost-perfect predictor of subsequent fiscal consolidation (correlation of 0.97). Outside the eurozone, the relationship was still very strong (0.70). The increase in interest rates was highly correlated with both structural deficit and fiscal consolidation. No drastic fiscal consolidation took place that was not preceded by a significant increase in the interest rate.
Another exemplar of pre-crisis reforms was Germany. It is easy to forget that Germany’s economy was weak and grew slowly from the mid-1990s to mid-2000s. But labor market reforms and an increasingly competitive economy slowed the growth of wages, letting productivity catch up and thus making German workers cost-efficient. Despite heavy losses by German banks during the financial crisis, Germany returned to growth in mid-2009 and has upheld the eurozone’s economy through its relatively strong economy and by bailing out other governments and banks.
Some commentators have blamed Germany’s low labor costs for struggles elsewhere in the eurozone.[14] If Germany’s wages were less competitive, the reasoning goes, French and Spanish workers would have an easier time finding work at their uncompetitive wage rates. But this view ignores the rest of the world, and the fact that it is possible for the entire eurozone to be uncompetitive together. (A more nuanced view correctly notes that higher eurozone inflation could help workers outflank the rigid wage rules that make them uncompetitive in the global marketplace. Direct reform of labor markets, however, would be the best course of action.)
The United States had some advantages going into the recession. U.S. labor markets have long been more flexible than those in most of Europe. The strong and steady pace of economic growth over the past 70 years made it easy for Americans and their government to repay past debts. The U.S. has avoided the worst of demographic collapse and does not face an age-dependency problem on the scale of Germany, Italy, or Japan. And U.S. public debt was around 40 percent of GDP.
Many of these advantages have been squandered, however, and the U.S. might have greater difficulty recovering from a future crisis. U.S. labor markets have become more rigid, and the Obama Administration is proposing a minimum wage increase to an unprecedented level.[15] Economic growth has slowed and labor force participation is dropping. The baby boomers are beginning to retire. U.S. debt is now 74 percent of GDP, and the gathering storm of entitlement deficits looms near.[16]
Crises tend to reveal and exacerbate an economy’s underlying weaknesses. U.S. policymakers should identify and address the weaknesses that recent policies have created in the American economy.
Different Countries, Different Policies
Governments responded to the Great Recession and eurozone debt crisis in many different ways. Chapters 2 and 3 of Europe’s Fiscal Crisis Revealed focus on fiscal policy (taxes and spending), and the Special Report’s appendices discuss a wider variety of policy responses to the crisis in several countries.
One stereotype of the crisis is that from 2007 to 2009 government spending rose and taxation fell, and that the reverse occurred from 2010 through 2012.[17] Using my preferred measures of taxation and spending—core government spending and revenue rate—I find that some much-studied countries followed this policy profile, including Greece, the U.S., the U.K., and Spain. But many less-studied countries did not. In fact, only nine of 35 countries followed the archetypal trajectory of expansion followed by contraction. Most countries were the exception, not the rule.
(The measure of core government spending excludes interest payments and transfers such as unemployment insurance. Taxation is measured using the revenue rate, which equals total government revenue divided by GDP, and is expected to fall slightly during recessions in countries with progressive taxation.)
Italy, for example, was already grappling with its high debt and meager growth in 2007. During the stimulus era, Italy’s spending rose only slightly, and its revenue rate rose, instead of falling as one would expect in a recession. From 2009 to 2012, Italy’s spending fell and its revenue rate rose, exiting the crisis with lower spending and higher taxes than in 2007.
In Germany, both spending and the revenue rate rose more than 1 percent of GDP from 2007 to 2009, with relatively little change from 2009 to 2012.
In France, spending rose almost 1 percent of GDP in 2009 and then remained roughly constant through 2012. Taxes fell slightly in 2009, but then rebounded well beyond the 2007 baseline rate by 2012.
In Sweden, taxes dropped and spending rose steadily from 2007 to 2012.
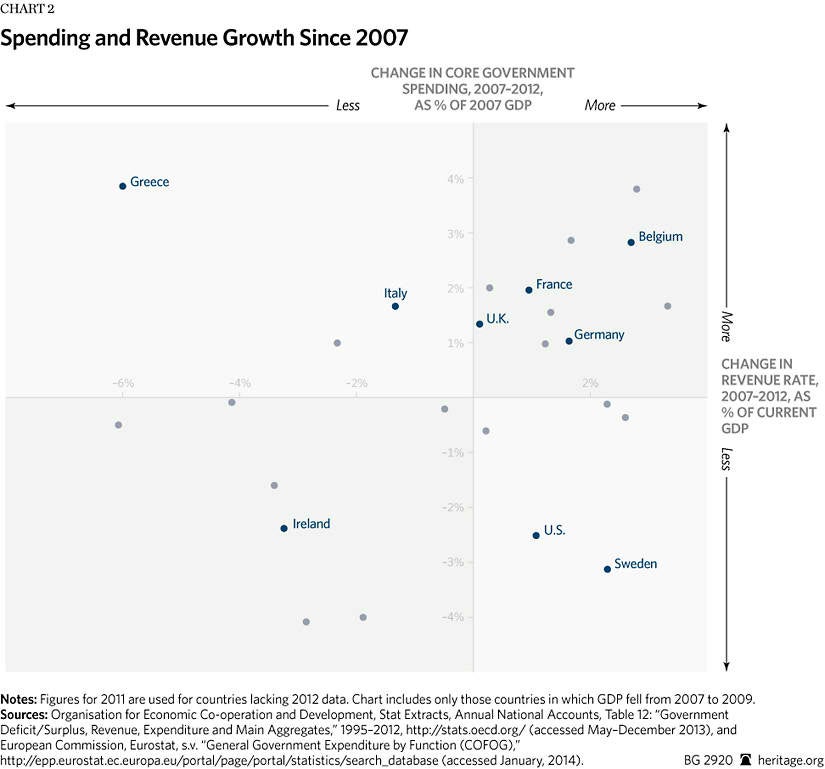
Not only is there a variety of approaches toward the overall stance of fiscal policy, but spending and tax policies diverge. It is not safe to assume that a country that raised taxes also cut spending, nor that a country that increased spending also cut taxes. Many countries simply increased the size of government, raising both spending and revenue rates.[18]
Chart 2 plots each country’s change in revenue rate against its change in core government spending. The conventional narrative—that tax increases go hand in hand with spending cuts—applies to countries in the upper left quadrant, such as Greece and Italy. But far more countries, such as France and Germany, are in the upper right quadrant, having increased both taxes and spending.
Some commentators have used the phrase “age of austerity” to refer to the 2010–2012 period. While it is certainly true that deficits came into focus during those years, especially in the eurozone, measurements of the policy changes undertaken during those years can easily conflate the expiration of temporary stimulus measures with newly enacted budget cuts. In the U.S., for example, a temporary payroll tax cut expired in January 2013, and the $800 billion “stimulus package” had mostly been spent by 2012. If one looked only at changes from 2011 to 2013, one would see those expirations as a spending cut and a tax increase. By examining changes over a longer time frame, one is less likely to misidentify temporary spending increases as permanent spending cuts.
Did core government spending reverse previous increases by declining after 2009? In 15 countries, it did. But 14 countries actually increased spending from 2009 to 2012 and another six (mostly in Eastern Europe) had spending declines in both periods. And 23 of 35 countries had higher core government spending in 2012 than in 2007, most of them by at least 1 percent of 2007 GDP. In 11 countries, including the Nordics, spending was at least 2 percent of 2007 GDP higher in 2012 than in 2007.
While each country’s experience during the crisis years was unique, some helpful generalizations are possible. The most obvious group to profile is the “crisis countries.” While special attention has been paid to the “PIIGS” (Portugal, Ireland, Italy, Greece, and Spain), several non-eurozone countries had similarly severe recessions and drastic policy responses, among them Hungary, Iceland, Latvia, and Romania. In Table 1, I grouped together 13 countries that came under pressure from bond markets at some point during the crisis, generally due to market concerns about their deficits.
Among the crisis countries, revenue rates initially fell, probably due to falling incomes. After 2009, the crisis countries pushed revenue rates 1 percent of GDP higher, and cut spending by an average of 3 percent of GDP. The most successful countries in this group were Bulgaria and Lithuania, both of which cut spending and taxes and avoided a double-dip recession.
The remaining 22 countries can be divided into 10 eurozone and 12 non-eurozone countries, none of which faced high bond spreads during the period. The eurozone countries faced worse recessions on average, and increased their revenue rates by 1.5 percent of GDP despite falling private incomes early in the crisis. These apparent tax increases are not easily explained by the narrative record, since published stimulus plans record intent to cut, not increase, taxes. The non-eurozone countries averaged a 1.6 percent drop in revenue rates. Both groups of countries increased core spending during the early years.
After 2009, the eurozone countries continued to raise revenue rates and spending, both by about half a percent of GDP. The non-eurozone countries had no change in spending on average, and revenue rates bounced back slightly, as expected during an economic recovery. During the full five years, both sets of countries increased government spending, but revenue rates diverged, growing significantly in the eurozone and falling significantly elsewhere.

An alternative way to measure fiscal policy in the post-recession period is 2012 data on mostly completed plans in the IMF’s Fiscal Monitor. The two data sources agree on the more extreme cases but have substantial differences among those that adjusted less. Neither data source, however, shows a high degree of fiscal consolidation in the non-crisis economies.
The Fiscal Monitor data are a rebuttal to those who claim that the U.S. has performed better than Europe due to Europe’s fiscal consolidation. According to the Fiscal Monitor data, the U.S. had the 10th-largest spending cuts of 28 countries, exceeded only by Slovakia and the U.K. among non-crisis countries.
Lessons for America
The U.S. is in need of large-scale entitlement reforms and deficit reduction in order to fund the retirement promises made to the baby boomers. As those reforms and deficit reductions are enacted, the lessons from recent data as well as decades of economic evidence should be taken into account: Tax increases will do much more damage to growth than will spending cuts.
There are a handful of recent scholarly papers (I found four) that estimate both tax and spending multipliers over a multi-year horizon.[19] As presented in Table 2, these papers display a near-consensus that tax multipliers are stronger than spending multipliers.[20] Equally important, tax multipliers generally grow stronger over time, and spending multipliers generally weaken. Consistent with my estimates from data during the recent crisis, tax increases directly and increasingly diminish private-sector activity by more than the value of the tax, but spending cuts have little impact on private GDP, and the impact on total GDP disappears over time as the private sector replaces the lost government spending.

Protecting economic growth is not the only economic purpose of government. There are trade-offs. But growth remains vital to creating individual opportunities, and the private-sector economy is the source of funding for the rest of government’s priorities.
U.S. policymakers should address the coming public-funding crisis with the best economic research in mind: Tax increases will slow growth at more than a dollar-for-dollar rate; spending cuts will likely have little effect on growth. The recent history of stimulus and austerity corroborates the scholarly research and confirms that it is never too early to prepare America’s finances for the next recession.
—Salim Furth, PhD, is Senior Policy Analyst in Macroeconomics in the Center for Data Analysis, of the Institute for Economic Freedom and Opportunity, at The Heritage Foundation.


