Revised and updated October 23, 2012.
Washington’s reckless spending spree of the past several years and unwillingness to confront the mountains of debt coming soon from unreformed federal entitlement programs threaten the economic and social future of the generation currently between the ages of 5 and 30.
The 115 million Americans in this Debt-Paying Generation could experience enormous adverse effects from having to pay down the greatest debt in world history. Indeed, those of you in the Debt-Paying Generation could end your working lives as the least improved generation (in U.S. history) relative to the one that preceded you. You will marry later, have fewer children, poorer health, and lower incomes because you must pay the trillions in debt from excessive spending today and from the tsunami of debt coming from unfunded liabilities in Medicare, Social Security, and Medicaid.
Rob Bluey, a member of the Debt-Paying Generation, sat down with Bill Beach to ask him about the debt crisis and the implications for those who, through no fault of your own, will be on the hook for solving and paying for it. The interview follows.
What kind of a financial mess are we in? How did we get here and what, specifically, has the Obama Administration done to worsen this problem?
Everybody has seen the news from Greece. The Greek financial crisis is largely caused by the government spending way beyond its revenue inflows. However, Greece is not alone: Spain, Italy, Portugal—indeed, many major, fully developed economies—are spending far in excess of revenues year after year.
The United States shares this problem with these better known fiscal basket cases. So let me start by giving you a snapshot of what has just happened in the past few years…
- Massive spending increases between 2004 and 2008, especially over the last six months of George W. Bush’s administration when Congress bailed out Wall Street at a cost of $896 billion
- President Barack Obama and the Democratic leadership in Congress expanded the flood of dollars, first by taking over Detroit, authorizing $100 billion for bailing out auto companies
- We followed this up with two economic stimulus programs worth $1.1 trillion
- Now we’ve passed comprehensive health care reform that has a 10-year cost of $987 billion
All of this spending is creating debt like we have never seen before in U.S. history. If you are a U.S. citizen, if you expect to live and work in this country, this is your problem. Debt has to be repaid, and you will have a portion of this problem. And if you’re part of the Debt-Paying Generation (ages 5 to 30), you’ll find that this will reshape your life.
OK, so President Obama has spent a lot of money and the Democrat-controlled Congress approved it all, but why call this a crisis and rename anyone under 30 the “Debt-Paying Generation”?
Total debt was $10.5 trillion at the beginning of 2012.[1] I’m talking about debt that you and I and people around the world own of U.S. Treasuries. It’s not debt owed by one agency of government to another agency. It’s what we owe ourselves, and it has to be repaid.
This debt will more than double in just the next 10 years. It will go from $11.3 trillion at the end of 2012 to $23 trillion in 2022. As compared to the size of the U.S. economy, sovereign debt will go from 73 percent of the size of gross domestic product (GDP) to 93 percent of GDP.[2]
And that’s only the beginning. Structural debt from entitlements like Social Security, Medicare, and Medicaid overwhelms anything you’re currently reading about on the front page of your local newspaper.
We’re about to hit a major crisis with Baby Boomers retiring. Only about 30 percent of the Boomers are fully prepared for retirement at age 62,[3] and this is part of the moral dimension of the problem I just mentioned. We’re looking at unfunded liabilities for Social Security, Medicare, and Medicaid that will require the U.S. government to borrow trillions and trillions more.
It is important to distinguish between gross debt and publicly held debt. The discussion in this booklet deals with publicly held debt. Gross debt consists of publicly held debt and agency debt, which is considerably higher than publicly held debt. However, publicly held debt is the amount that is most relevant to the health of an economy, so it is the focus of my discussion.
Big numbers can be difficult to really comprehend. How big is a trillion dollars?
Recently I spoke with about 30 Heritage visitors—a wonderful delegation of energetic leaders from Mongolia—and I took them through an exercise to explain how large a trillion is. I told them it has 12 zeros, and used some other examples, but they just weren't getting it.
So I said, “How many in here know LeBron James?” 30 hands went up. LeBron James makes over $45 million a year, one of the highest-paid basketball players out there. I asked, “How many years would he have to work to make just one trillion?” Answer? Nearly 22,000 years to earn one trillion dollars.
Here are some other ways to think about this. The average life is 2.4 billion seconds. An entire lifetime is just a small part of a trillion. A billion seconds ago was some time in 1981. A trillion seconds ago, just think about the magnitude of the difference—29,700 BC.
These are truly large numbers. So when we’re talking about $11.3 trillion in public debt right now going to $23 trillion, these numbers are nearly unimaginable. They’re enormous. We have an economy right now that’s roughly $15.5 trillion. It’s large—indeed, it’s the largest economy in the world. What we’re talking about now just overwhelms the economy.
Now that we understand how much money we’re talking about, can you explain why the debt is such a problem for me?
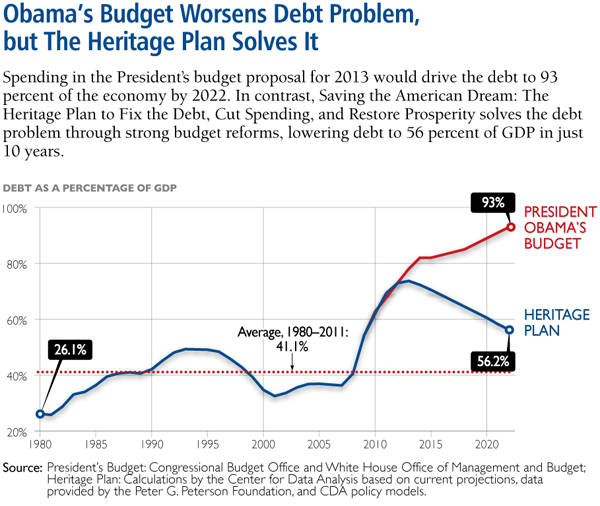
Let’s use the graph below to see debt held by the public as a percent of GDP from 1980 through 2021. The period 2012 through 2022 is projected. It’s interesting how this graph shows the trouble created by George W. Bush’s administration in terms of debt.
Debt reached its pre-2007 maximum roughly in 1995. We’ve basically just won the Cold War, and we’re paying down the debt. The dot-com bubble starts in the late 1990s. Revenues are coming in from that bubble. Congress is not doing anything particularly pernicious: We have divided government, which one reporter says is the only constitution we have left.
George W. Bush takes over in 2001, and debt slowly creeps up until the economy falls apart in 2008. The red line below shows how fast the debt will grow under President Obama’s current budget proposals. He takes that debt up to over 90 percent of GDP. At that level, debt held by the public will be almost as high as the highest it’s ever been in U.S. history.
However, if Congress follows The Heritage Plan for fixing the federal budget, debt as a percent of GDP falls dramatically after 2012. That’s the falling blue line below
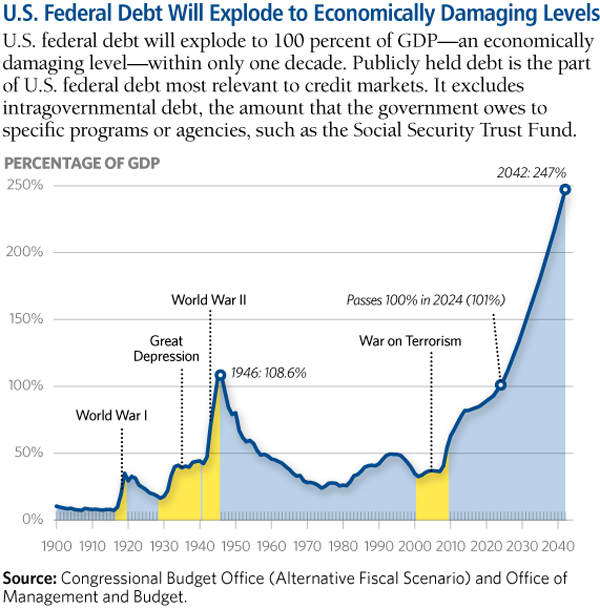
How does our debt today compare to the Great Depression or World War II?
We reached the highest debt percentage when we were fighting Tojo, Hitler, and Mussolini during World War II: 109 percent of GDP, the most debt we had ever had. Now we’re looking at exceeding that in just a few short years and reaching 247 percent in 2042.
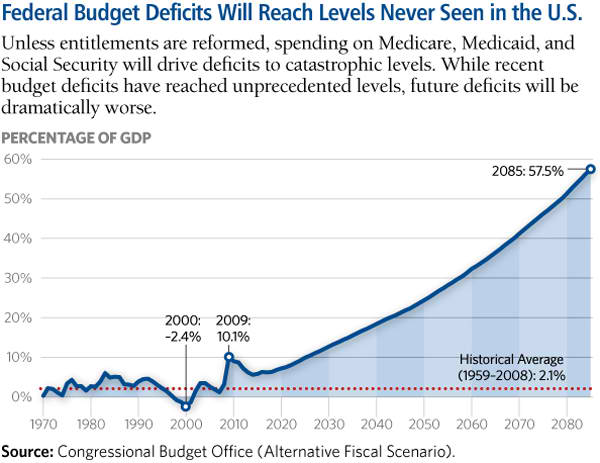
We hear a lot about the budget deficit. Hasn’t this been a “looming crisis” for the past 50 years?
Between 1962 and 2007, the budget deficits went up and down, with the lowest being a 2.4 percent budget surplus—the United States taking in more money than we spend, imagine that!
Most analysts will tell you that we can manage with deficits at roughly 2 to 3 percent of GDP.[4] It’s not a balanced budget, it’s not as good as it can get, but we can work our way through that.
However, look what happens between now and the 2080s. Just look at those annual deficits. Unless we resolve Social Security, Medicare, and Medicaid—the entitlements that are driving our debt—we’ll be up to 57.5 percent of GDP on an annual basis in 2085. The annual defecit will be equal in size to over half of our economic output, and every year of deficit adds to total debt.
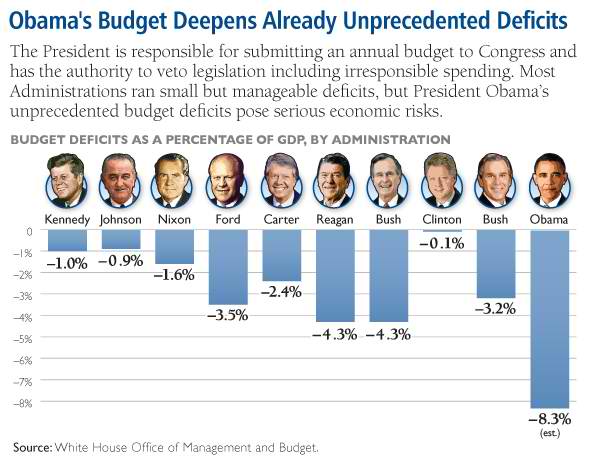
It seems the deficits have plagued almost every President. Who has done the best job?
The chart to the right shows average annual deficits for each President. Let’s review…
- 1% deficits for John F. Kennedy and Lyndon Johnson
- 3.5% deficit under Gerald Ford
- 4.3% deficits during Ronald Reagan and George H. W. Bush’s terms. During this era, the U.S. was basically pounding the Soviets into the ground through our defense buildup and destroying the Berlin Wall. That’s a pretty good payoff.
- 0.1% deficit for Bill Clinton—in the 1990’s, we reaped the economic benefits of winning the Cold War
- 3.2% deficit under George W. Bush, which is high though not as large as the Reagan and first Bush years
- 8.3% estimated average national deficit of a two-term Obama Administration—the biggest of the past 50 years
Under President Obama, we’re not looking at a continuation of deficit business as usual. This is a dramatic change in the magnitude of annual shortfalls at the federal level.
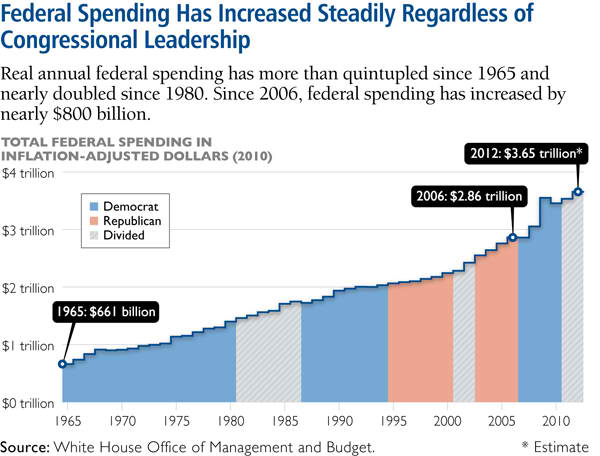
There’s an assumption that Republicans spend less, Democrats spend more, and divided government is generally the best way to keep both parties in check. Is that true?
No, it doesn’t make any difference which party runs the whole government or if it’s a divided government. The chart below shows which party ran the government from 1962 through today and the total amount of spending over that time period. When it’s blue, it means the Democrats have the House and the Senate. When it’s gray, that’s divided government. And when it’s red, Republicans have the House and the Senate. Here’s a test for you: Does the line go up or down? As you can see, it always goes up–no matter who is in control.
Why will the current generation (ages 5 to 30) have to pay the debt?
First, the debt is going to be very large. There are three major debt-rating agencies in the world: Fitch, Standard & Poor’s, and Moody’s Investor Services. On August 5, 2011 Standard and Poors downgraded U.S. sovereign debt from its AAA rating to AA+. Fitch soon followed with their assessment that U.S. debt was likely to be downgraded by Fitch as well within two years.
We believe that each company begins to closely scrutinize the ability of the debtor nation to pay their debt when publicly held debt reaches 90 percent of GDP, and their expectation is that most of the debt will be paid without delay. On May 14, 2010, the International Monetary Fund (IMF) issued a notice to the United States that when they added up the debt of state governments and the federal government, we would exceed 100 percent of GDP in 2015.[5]
So Moody’s is going to be looking differently at public debt as you mature and reach your most productive period of life than they looked at my generation. We had debt-to-GDP ratios of 30 percent to 40 percent, and Moody’s and others did not expect us to pay that debt right away. In short, it was a manageable amount of debt relative to the size of our economy.
Academic research shows that the growth rate of the economy slows significantly when you get to 90 percent of GDP and above.[6] So when we say the Debt-Paying Generation is on the hook, we do so with the authority of Fitch, Standard & Poor’s, and Moody’s, and current research on the relationship between debt and economic performance.
So how are we going to get out of this mess? If you listen to the liberals in Washington, we’re just going to tax the rich even more, and that’s going to solve everything, but I have a feeling you might think otherwise.
There are four ways to pay the debt. You can raise taxes to pay the debt, you can lower spending and use the savings to pay the debt, you can inflate your way out of debt, or we could simply repudiate it.
We had a lot of debt after World War II. How did we reduce that debt? Did we pay it back? Yes, in part, but the biggest contribution to paying the debt was inflation. Indeed, we had massive inflation: 50 percent of the value of the dollars borrowed during the war was inflated away. Inflation undermines your ability to buy the things you need and give yourself a high quality of life. When we had some surpluses in the 1950s, we had a lot more dollars and we could pay that debt at a lot less cost. Raising taxes, of course, is not a good idea if you’re trying to live a prosperous life, because it’ll slow the economy.
Finally, is debt repudiation a good idea? Don’t go down that route, as it nearly destroys your country’s credibility to bondholders. A few countries have tried defaulting—most famously Argentina—and it takes decades to recover from that one policy move. So the only policy action that’s good for you as citizens and taxpayers is for Congress to lower spending. However, the only thing that Congress doesn’t want to do is lower spending. But one of these four has to occur.
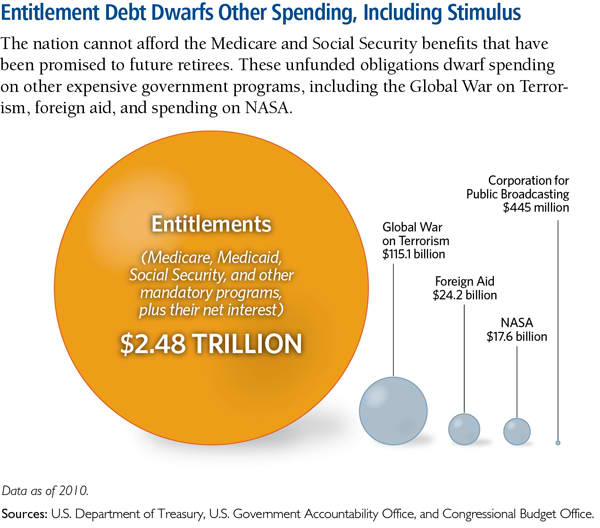
How big is this challenge?
This chart to the right shows the amounts Congress recently authorized for defense spending and the Corporation for Public Broadcasting (the agency responsible for NPR and PBS). Look at the amount of money. We compare these amounts to the unfunded liabilities in mandatory programs like Social Security, Medicaid, and Medicare.
We have no resources to pay for unfunded liabilities in Social Security and Medicare. In other words, we’re going to have to borrow those amounts over the next several decades just to meet current obligations. Just look at mandatory programs; they're like the Jupiter of this whole problem. They're simply enormous.
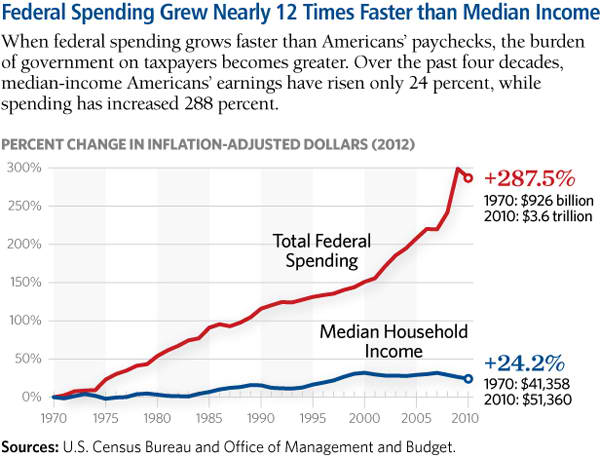
Federal spending is a major focus for Tea Party groups. Do the facts back up their outrage over spending?
The graph below goes directly to your point about spending. Quite apart from these extraordinary allocations during the recession and the upcoming tsunami of outlays for entitlements, ordinary spending by the federal government has been consistently greater than the growth of household income. The blue line is median household income growth from 1970 to 2010. In other words, it shows the income growth for the household that’s in the middle of the income distribution. The red line shows the growth of federal spending. Both series have been adjusted for inflation. Look at the inflection point in 2001. The temperature rose dramatically in the patient as of that point.
So what does this mean to you, members of the Debt-Paying Generation? If we don’t get our arms around the debt problem and seriously address the rate of growth in spending, debt will continue to accumulate, and the Debt-Paying Generation—not the Boomers, not the Depression generation—will be facing these dramatically higher tax rates according to the government’s own accounting office.
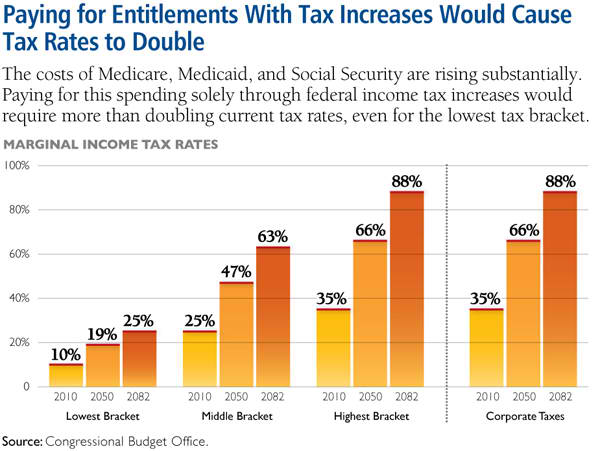
Are higher taxes inevitable?
This last chart shows current tax rates and tax rates we’ll need just to stay even with spending in 2050 and 2082. The middle bar in each case is the tax rate in 2050, and the third bar in each case is the tax rate in 2082. The bottom rate will go from 10 percent to 19 percent by 2050. The middle rate, where most of the Debt-Paying Generation will at least start, will go from 25 percent to 47 percent. And if you’re in the upper-income bracket, you’ll go from 35 percent to 66 percent. But for our children, the middle rate jumps from 47 percent to 63 percent.
So, absent a reversal of policy—that is, absent a fix to Social Security, Medicare, and Medicaid—the rate of economic growth in the future will drop well below what it should be. As the economy drops below its long-run growth rate of 3.25 percent per year (after inflation has been taken out), incomes and economic opportunities also will decline below their potential levels. If the average growth rate across your working lifetime is 2.5 percent, you will end up in U.S. history as the generation that improved the least from the time you started to work to the time you started to retire.
Let me address the Debt-Paying Generation. The accounting numbers are not controversial. The projections are, but the projections are based on conservative trends, so you can’t argue that somebody else’s accounting gets you off this hook. The trends are what they are, and they have been going in this direction for a long time. We’re not looking at a reversal of trend unless we have a reversal of policy.
What does this mean for young people? Is the American Dream still possible given the dire circumstances you’ve explained?
Your incomes will be less because the economy will be slower, in no small part because of increases in taxes on labor and capital. If your incomes grow below potential, that may mean that your health will be poorer than it should be: income growth and health outcomes are highly correlated. As income falls, health outcomes get worse because people have less access to health care services, and there are simply fewer such services around.
It means you’ll marry later. If you marry later, you likely will have fewer children. Having fewer children means you likely will start your household later. If you buy your first house later, think what that does to the construction business, to the appliance business, to all the businesses that are tied to the first home purchase.
Most disturbing of all, you will give your children less than you received from your parents. The intergenerational endowment from the Debt-Paying Generation to the next generation means that they will have less to work with as they start their working lives. That lower starting point takes a long time to reverse—certainly longer than a single generation.
The problem of the national debt poses a very grim prospect. In the 2010 Fiscal Monitor, the International Monetary Fund (IMF) advised the United States to decrease its structural deficit by 12% of GDP between then and 2015.[7] Only one other country, Japan, was advised to cut more of their structural defecit. Even Greece, for example, got a lighter recommendation; the IMP proposed that they reduce theit structural defecit by 9.2% of GDP by 2015. After the IMF's report came out, the United States government continued its spending binge.
Today, in order to meet the IMF’s recommendations, we would need to cut $452.82 billion per year. Recent negotiations over the debt between Republicans and Democrats haven’t come close to targeting this level of spending. There has been a clear and evident failure at the highest levels of government to solve this problem.
It doesn’t matter which party you affiliate with: our fiscal situation is unsustainable as it currently stands. In order to avoid debt reevaluation, the IMF has urged the United States to take action. As of yet, we have not. Our path to fiscal health has been given to us by one of the most prominent fiscal watchdogs in the world. Now, we need to acknowledge and strive to reach this goal.
What are the solutions? Where do we begin to fix the problem?
We could start by repealing Obamacare. Instead, pass a consumer-based, patient-focused health care system that saves money. It’s irresponsible to feed this debt beast with an additional $987 billion. You just can’t do that.
We can’t raise taxes, because that slows the economy and makes our debt problem worse. We have to cut spending. We have to at least make a start on modernizing Social Security, which is the “easiest” of the great entitlements to fix—easy in the financial sense, that is.
Make no mistake, it will take strong political willpower to alter Social Security and to transform Medicare and Medicaid. But we’ve got to tell the bondholders in the world that we’re serious about entitlements, which are the single biggest driver of our structural deficit crisis.
If you’re part of the Debt-Paying Generation, read on for your call to action…
What You Personally Can Do
The Debt-Paying Generation cannot be dependent on the federal government for its income, health care, and housing. Rather, it has to learn the age-old virtues of personal financial prudence (now there’s an old-fashioned, but totally relevant word). Here’s what we suggest:
- Open a Savings Account. If there’s one thing the Debt-Paying Generation must do it is save. That starts with a personal savings account. Even if you’re deep in paying back student loans or starting a family, remember to pay yourself each payday. That means transferring some money (even if only a little) from checking to savings—better yet, make it an automatic withdrawal.
- Make a Monthly Budget and Stick to It. Staying out of debt as much as possible is just as important as building up your personal savings. While debt to pay for education or buying a townhouse often can’t be avoided, don’t add to it by racking up big “mad money” balances on credit cards… that’s what Washington does, and why we are in so much trouble.
- Create a Personalized Financial Plan. The best personal training you’ll ever do is getting your finances in shape. Whether you seek out a savings calculator online or a professional financial planner, make sure these sources have a track record of sound and profitable financial advice. Then, make a plan that works for you.
- Give Information to Your Friends and Family. If this booklet has been helpful, we hope you will get more copies and pass this along. You’ll also find much more accurate, cutting-edge research—and easy ways to share it, like YouTube videos—at heritage.org.
You can take these steps. It’s not my generation that will lead on this, because we don’t have as much in the game. It’s your generation. It’s your future.
What National Leaders Need to Hear from You
Washington isn’t moving on these critical fiscal issues, yet there are concrete actions we can and should take as a nation to create a better future for us all.
OUR LEADERS IN WASHINGTON SHOULD…
- Enact firm limits on spending, which will force Congress to live within its means.
- Reform Social Security by increasing the retirement age to reflect the fact that people are living longer, and focus Social Security benefits on those who need them.
- Fix Medicare by transforming it into a defined contribution pro-gram instead of the way too costly fee for service model with unlimited benefits that is bankrupting us.
- Make it easier for Americans to save for any purpose. Increase per-sonal retirement savings by getting businesses to adopt automatic IRA enrollment for all employees.
- Roll back other areas of spending and set priorities based on the limited federal government the founding fathers envisioned. Em-power state and local governments to address needs in areas like transportation, job training, and economic development, and return other functions to the private sector.
These and other important reforms are all a part of Saving the American Dream: The Heritage Plan to Fix the Debt, Cut Spending, and Restore Prosperity. This comprehensive proposal would balance the budget within 10 years, guarantee assistance to those who need it, and save the American Dream for future generations. Explore this detailed plan with videos, charts, and more at SavingTheDream.org.


