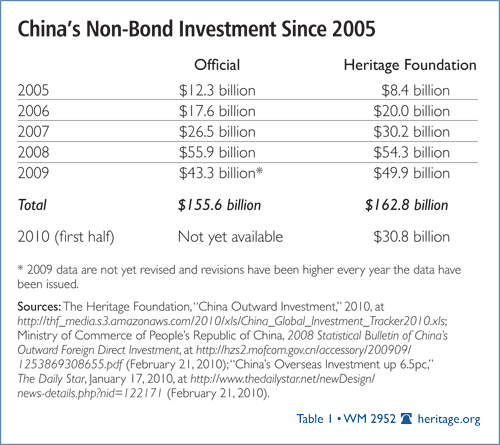
China has at least $2.5 trillion in foreign exchange and must, due to its own balance of payments rules, invest it all overseas. Most unavoidably goes into American bonds, the only market big enough to absorb it.[1] However, since the beginning of 2005, the PRC has invested almost $200 billion in foreign assets outside bonds. Official Chinese data are unhelpful, but The Heritage Foundation’s China Global Investment Tracker sorts non-bond spending by country and sector. The tracker is current through June 30, 2010.
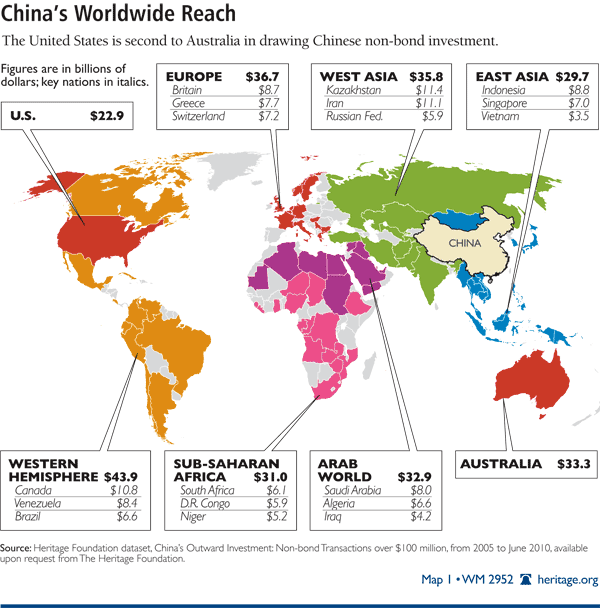
Thus far this year, Chinese investment has been predominantly characterized by a rush to the Western Hemisphere, excluding the U.S. The first half of 2010 saw record activity, with large Chinese investments and engineering contracts surpassing $45 billion worldwide. Just over half went to non-U.S. Western Hemisphere countries. (Chinese non-bond investment in the U.S. was $1.6 billion.)
The challenge for American policy is not the amount of Chinese investment around the world. The PRC has the prerogative to look for partners in the Western Hemisphere or elsewhere. And, given the foreign exchange pile, Chinese investment outside bonds will rise strongly for years to come. Rising Chinese influence stemming from the investment and business contracts should be met in kind by resurgent American economic diplomacy.
More Spending, Fewer Mistakes
The first step in improving American policy concerning Chinese investment is to separate fact from fiction. Official data from the PRC are accurate but not useful. There are no figures for sector investment, and the bulk of Chinese spending is assigned to Hong Kong, but Hong Kong is merely a transit point.
The China Global Investment Tracker[2] solves these problems by monitoring companies. Foreign parties are used as sources of information when possible. Chinese enterprises can be stingy with information but do provide the country of final destination and the nature of the project. As projects have become larger, the tracker has matched revised Chinese data more closely while always being released more quickly and with far more detail.

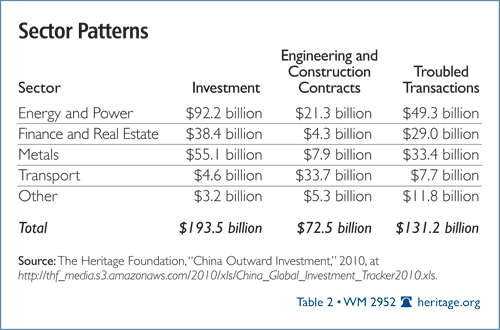
In addition to sector and country breakdowns, the tracker includes separate data on Chinese transactions that have suffered major setbacks. The most famous example is CNOOC’s thwarted bid for Unocal, although there are dozens of others. Since 2005, the total value of such transactions exceeds $130 billion, but there is an important new development: Problems in closing the transactions seem to be lessening. There were far fewer troubled transactions in the first half of 2010 than in previous years. Chinese firms are improving as investors and yet more spending are on the way, including sophisticated transactions that were previously out of reach.
In terms of sectors, there is no surprise in what the PRC seeks: energy leads, with coal now joining oil and gas. Metals are second, topped by iron ore. Finance is a third emphasis, featuring capitalization of U.S. real estate funds that are seeking assets available in the wake of the recent property contraction. Transport sees little in conventional investment but draws a slew of multi-billion-dollar engineering and construction contracts. Two much-discussed areas, agriculture and technology, are as yet comparatively inactive. In both, large transactions have been blocked, discouraging Chinese firms.

The ABC’s Since 2005: Australia, Brazil, Canada
The biggest political topic is the countries in which Chinese firms are most active. An accurate assessment, however, is confounded by widespread credulity regarding Chinese investment. Although global media trumpet supposedly “gigantic” Chinese deals, such reports can be based on disinformation spread by host country governments.
Companies that do not exist are said to be spending billions. The huge figures thrown out are later downsized by factors of 10. Local governments and much of the international media also often treat loans and non-binding future trade contracts, such as for energy, as equivalent in importance and commitment to authentic investment. These claims are often taken at face value in American policy discussion.
The tracker does not include loans, trade, or unverified claims by host governments but only genuine investment outside bonds. Australia is the leading target, with the U.S. a distant second; Kazakhstan, Iran, and Canada each have over $10 billion in Chinese business contracts and investment since 2005. (When including bonds, the U.S. utterly dominates.)
A regional analysis shows clear efforts by Beijing to diversify its financial exposure, its sources of energy and metal ores, and its investment-driven diplomatic efforts. The first half of 2010 also shows a breakthrough in the Western Hemisphere.
Until late 2009, Chinese investment activity in Canada and Latin America was more smoke than fire, but the friendly business environment in Canada, two-sided efforts in Brazil, and mineral wealth have produced a surge in agreements. The final numbers may turn out to be lower than anticipated—recall the dataset of troubled transactions—but there will no changing the increased importance of the Western Hemisphere in China’s “Going Out.”
Elsewhere, a number of deals have failed to materialize in sub-Saharan Africa. Nigeria is perhaps the worst offender on this score, and the recent announcement of $23 billion in new business contains little substance. A number of investments have been brokered by the China-Africa Development Fund, but to date these have almost always been small in size.
East Asia’s surprisingly low figure is due in part to timing—since some Chinese activity in East Asia predates the tracker’s starting point—and in part to relative lack of natural resources. Investment in West Asia is plainly dominated by oil and gas.
In the Arab world, explicit energy deals are few. Instead, large transport and construction contracts are the norm, as the PRC seeks other avenues to friendly relations with energy-rich countries. Other than considerable financial investment in Britain, Europe has not been especially fruitful for Chinese investors. However, the sovereign debt flare-up in Greece and the ensuing appeal to Beijing may portend similar events in Spain, Portugal, and Italy.
Positive American Response
The expansion of Chinese activity in the Western Hemisphere, especially, will provoke much gnashing of teeth. There is an obvious means to counter this challenge: strengthen the American economic and political presence by ratifying the Colombia and Panama free trade agreements and seek other partners. When China is involved, it is well recognized that better economic relations bring the possibility of greater political influence. When it is time for the U.S. to act, the same fact tends to be forgotten.
This principle extends to every corner of the globe. The PRC has hundreds of billions of dollars available for investment and a strong drive to lock up resources; the U.S. has several trillion already invested around the world and a far bigger, more multi-dimensional economy. Concerns about American influence lost to increased Chinese investment and business activity should be addressed by encouraging the expansion of American economic activity, from investment in Ivory Coast to trade with Taiwan.
Derek Scissors, Ph.D., is Research Fellow in Asia Economic Policy in the Asian Studies Center at The Heritage Foundation.


