This week, the U.S. Census Bureau is scheduled to release its annual poverty report. The report will be notable because this year marks the 50th anniversary of the launch of President Lyndon Johnson’s War on Poverty. In his January 1964 State of the Union address, Johnson proclaimed, “This administration today, here and now, declares unconditional war on poverty in America.”[1]
Since that time, U.S. taxpayers have spent over $22 trillion on anti-poverty programs (in constant 2012 dollars). Adjusted for inflation, this spending (which does not include Social Security or Medicare) is three times the cost of all military wars in U.S. history since the American Revolution. Despite this mountain of spending, progress against poverty, at least as measured by the government, has been minimal.
The Welfare–Poverty Paradox
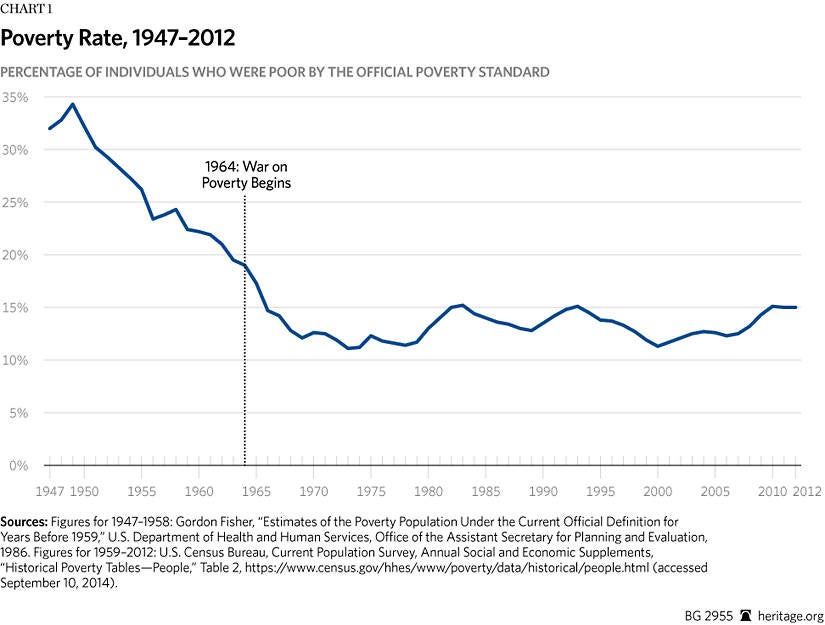
This week, the Census Bureau will most likely report that the poverty rate last year was about 14 percent, essentially the same rate as in 1967, three years after the War on Poverty was announced. As Chart 1 shows, according to the Census, there has been no net progress in reducing poverty since the mid to late 1960s. Since that time, the poverty rate has undulated slowly, falling by two to three percentage points during good economic times and rising by a similar amount when the economy slows. Overall, the trajectory of official poverty for the past 45 years has been flat or slightly upward.
The static nature of poverty is especially surprising because (as Chart 1 also shows) poverty fell dramatically during the period before the War on Poverty began. In 1950, the poverty rate was 32.2 percent. By 1965 (the first year during which any War on Poverty programs began to operate), the rate had been cut nearly in half to 17.3 percent.[2]
The unchanging poverty rate for the past 45 years is perplexing because anti-poverty or welfare spending during that period has simply exploded. As Chart 2 shows, means-tested welfare spending has soared since the start of the War on Poverty. In fiscal year 2013, the federal government ran over 80 means-tested welfare programs that provided cash, food, housing, medical care, and targeted social services to poor and low-income Americans.
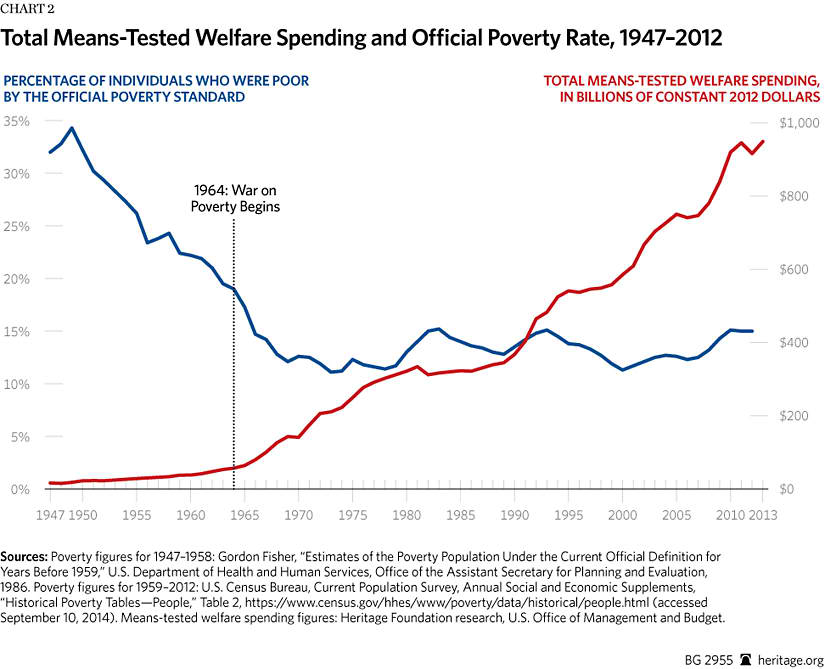
Overall, 100 million individuals—nearly one in three Americans—received benefits from at least one of these programs. Federal and state governments spent $943 billion in 2013 on these programs at an average cost of $9,000 per recipient. (Again, Social Security and Medicare are not included in the totals.)
Today, government spends 16 times more, adjusting for inflation, on means-tested welfare or anti-poverty programs than it did when the War on Poverty started. But as welfare spending soared, the decline in poverty came to a grinding halt. As Chart 2 shows, the more the government spent, the less progress against poverty was made.
How can this paradox be explained? How can government spend $9,000 per recipient and have no apparent impact on poverty? The answer is that it can’t.
The conundrum of massive anti-poverty spending and unchanging poverty rates has a simple explanation. The Census Bureau counts a family as “poor” if its income falls below specific thresholds,[3] but in counting “income,” the Census omits nearly all of government means-tested spending on the poor.[4] In effect, it ignores almost the entire welfare state when it calculates poverty. This neat bureaucratic ploy ensured that welfare programs could grow infinitely while “poverty” remained unchanged.
Living Conditions of the Poor in America[5]
Consumption by Poor Families. Since the Census Bureau dramatically undercounts the actual incomes of the poor, it should be no surprise to find that the U.S. Department of Labor routinely reports that poor families spend $2.40 for every $1.00 of their reported income.[6] If public housing benefits are added to the tally, the ratio of consumption to income rises to $2.60 for every $1.00. In other words, the “income” figures that the Census Bureau uses to calculate poverty dramatically undercount the economic resources available to lower-income households.
Amenities. Because the official Census poverty report undercounts welfare income, it fails to provide meaningful information about the actual living conditions of less affluent Americans. The government’s own data show that the actual living conditions of the more than 45 million people deemed “poor” by the Census Bureau differ greatly from popular conceptions of poverty.[7] Consider these facts taken from various government reports:[8]
- Eighty percent of poor households have air conditioning. By contrast, at the beginning of the War on Poverty, only about 12 percent of the entire U.S. population enjoyed air conditioning.
- Nearly three-quarters have a car or truck; 31 percent have two or more cars or trucks.[9]
- Nearly two-thirds have cable or satellite television.
- Two-thirds have at least one DVD player, and a quarter have two or more.
- Half have a personal computer; one in seven has two or more computers.
- More than half of poor families with children have a video game system such as an Xbox or PlayStation.
- Forty-three percent have Internet access.
- Forty percent have a wide-screen plasma or LCD TV.
- A quarter have a digital video recorder system such as a TIVO.
- Ninety-two percent of poor households have a microwave.
For decades, the living conditions of the poor have steadily improved. Consumer items that were luxuries or significant purchases for the middle class a few decades ago have become commonplace in poor households. In part, this is caused by a normal downward price trend following the introduction of a new product. Initially, new products tend to be expensive and available only to the affluent. Over time, prices fall sharply, and the product becomes widely prevalent throughout the population, including poor households. This is a general sign of desirable economic progress.
Liberals use the declining relative prices of many amenities to argue that even though poor households have air conditioning, computers, cable TV, and wide-screen TVs, they still suffer from substantial material deprivation in basic needs such as food and housing. Here again, the data tell a different story.
Poverty, Nutrition, and Hunger. Despite impressions to the contrary, most of the poor do not experience undernutrition, hunger, or food shortages.[10] Information on these topics is collected by the household food security survey of the U.S. Department of Agriculture. The USDA survey shows that in 2009:
- Ninety-six percent of poor parents stated that their children were never hungry at any time during the year because they could not afford food.
- Some 83 percent of poor families reported that they had enough food to eat.
- Some 82 percent of poor adults reported that they were never hungry at any time in the prior year due to lack of money to buy food.
- As a group, America’s poor are far from being chronically undernourished. The average consumption of protein, vitamins, and minerals is virtually the same for poor and middle-class children and in most cases is well above recommended norms. Poor children actually consume more meat than do higher-income children and have average protein intakes 100 percent above recommended levels.[11]
- Most poor children today are, in fact, supernourished and grow up to be, on average, one inch taller and 10 pounds heavier than the GIs who stormed the beaches of Normandy in World War II.[12]
Housing and Poverty. TV newscasts about poverty in America generally depict the poor as homeless or as residing in dilapidated living conditions. While some families do experience such severe conditions, they are far from typical of the population defined as poor by the Census Bureau. The actual housing conditions of poor families are very different.[13]
- Over the course of a year, only 4 percent of poor persons become temporarily homeless. At a single point in time, one in 70 poor persons is homeless.[14]
- Only 9.5 percent of the poor live in mobile homes or trailers; 49.5 percent live in separate single-family houses or townhouses, and 40 percent live in apartments.
- Forty-two percent of all poor households actually own their own homes. The average home owned by persons classified as poor by the Census Bureau is a three-bedroom house with one-and-a-half baths, a garage, and a porch or patio.
- Only 7 percent of poor households are overcrowded. More than two-thirds have more than two rooms per person.
- The average poor American has more living space than the average individual living in Sweden, France, Germany, or the United Kingdom. (These comparisons are to the average citizens in foreign countries, not to those classified as poor.)[15]
- The vast majority of the homes or apartments of the poor are in good repair and without significant defects.
By his own report, the average poor person had sufficient funds to meet all essential needs and was able to obtain medical care for his family throughout the year whenever needed.
Of course, poor Americans do not live in the lap of luxury. The poor clearly struggle to make ends meet, but they are generally struggling to pay for cable TV, air conditioning, and a car, as well as food for the table. The average poor person is far from affluent, but his lifestyle is equally far from the images of stark deprivation purveyed by advocacy groups and the mainstream media. The challenges go much deeper than a lack of material resources.
Was the War on Poverty a Success?
Do the higher living standards of the poor mean that the War on Poverty has been successful? The answer is no, for two reasons. First, the incomes and living standards of less affluent Americans were rising rapidly well before the War on Poverty began. (See Charts 1 and 2.)
Second, and more important, to assess the War on Poverty, we must understand President Johnson’s actual goal when he launched it. The original goal of the War on Poverty was not to prop up living standards artificially through an ever-expanding welfare state. Instead, Johnson declared that his war would strike “at the causes, not just the consequences of poverty.”[16] He added, “Our aim is not only to relieve the symptom of poverty, but to cure it and, above all, to prevent it.”[17]
In other words, President Johnson was not proposing a massive system of ever-increasing welfare benefits, doled out to an ever-enlarging population of beneficiaries. His proclaimed goal was not a massive new system of government handouts but an increase in self-sufficiency: a new generation capable of supporting themselves out of poverty without government handouts.
LBJ actually planned to reduce, not increase, welfare dependence. He declared, “We want to give the forgotten fifth of our people opportunity not doles.”[18] He claimed that his war would enable the nation to make “important reductions” in future welfare spending: The goal of the War on Poverty, he stated, would be “making taxpayers out of taxeaters.”[19] Because he viewed the War on Poverty as a means to increase self-support, Johnson proclaimed that it would be an “investment” that would “return its cost manifold to the entire economy.”
Measuring Self-Sufficiency
How has the War on Poverty fared with respect to President Johnson’s paramount goal of promoting self-sufficiency? What return have the taxpayers reaped from their $22 trillion “investment”? Paradoxically, the answers to these questions are best provided by the Census Bureau’s official poverty statistics.
As noted, Census poverty figures are misleading as a measure of actual living conditions because they exclude nearly all welfare assistance. They do, however, provide a fairly accurate measure of a family’s wages and earnings. This means that the official Census “poverty” figures are, in fact, a good measure of President Johnson’s original goal of promoting “self-sufficiency”: the ability of a family to sustain itself above the poverty level through its own work and investment without reliance on welfare aid.
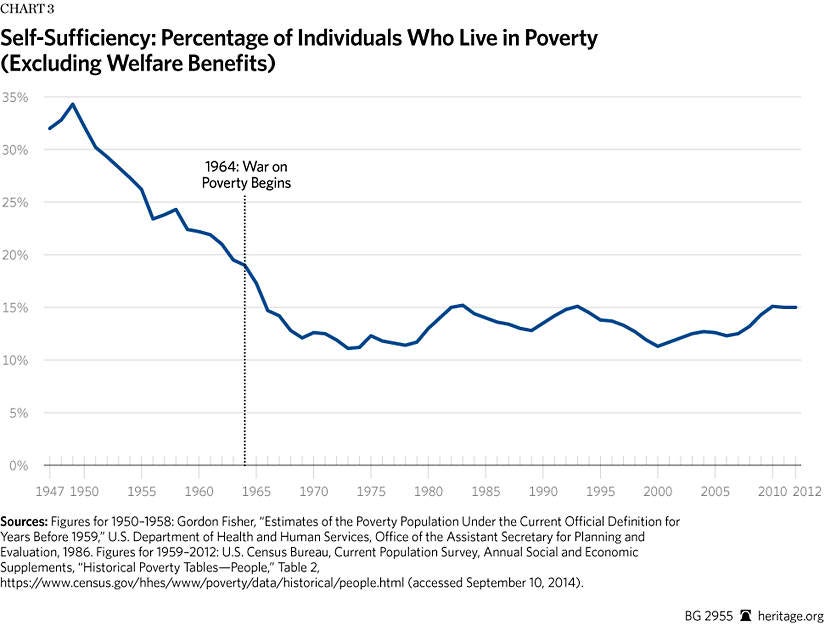
Chart 3 repeats the official Census “poverty” figures from Chart 1 but relabels them more accurately as a “self-sufficiency” index. The story told by the chart is striking.
In the decade and a half before the start of the War on Poverty, low-income Americans experienced dramatic improvements in self-sufficiency. The share of Americans who lacked self-sufficiency was cut nearly in half, falling from 32.2 percent in 1950 to 17.3 percent in 1965.
During the first six years after Johnson announced the War on Poverty (1965 to 1970), self-sufficiency continued to improve steadily. New government programs were initiated. Means-tested welfare spending increased sharply from $57 billion in 1964 to $141 billion (measured in constant 2012 dollars).
Some authors suggest that the continuing decline in official poverty from 1965 to 1970 demonstrates the initial success of the War on Poverty, but over 90 percent of the increased spending during this period was in the form of non-cash benefits that the Census does not count for purposes of measuring poverty.[20] It is therefore impossible for the expansion of means-tested welfare to have directly produced the large decline in official poverty that occurred during this period.
Programs that in theory could have reduced poverty indirectly by raising wages and employment were regarded as largely ineffective and were limited in scope. For example, in the late 1960s, only 300,000 participants per year were enrolled in Job Corps and related training programs.[21]
Thus, it is implausible to suggest that the decline in official poverty between 1965 and 1970 was due substantially to the direct or indirect effects of War on Poverty programs. Rather, official poverty declined and self-sufficiency improved for the same general reason that these improvements occurred before 1965: a steady rise of wages and education levels.
Unfortunately, the situation changed in the early 1970s. The steady improvement in self-sufficiency slowed and then came to a halt. For the next four decades, self-sufficiency has remained stagnant or has slightly worsened.
The big picture is clear: For 20 years, from 1950 to 1970, self-sufficiency (and official poverty) improved dramatically. In the next four decades, there was no progress at all; the self-sufficiency rate remained essentially static. In terms of President Johnson’s main goal of reducing the “causes” rather than the mere “consequences” of poverty, the War on Poverty has failed completely, despite $22 trillion in spending. In fact, a significant portion of the population is now less capable of self-sufficiency than it was when the War on Poverty began.
What Went Wrong?
The lack of progress in self-sufficiency for the past four decades is stunning. Many factors have contributed to this problem. For example, high school graduation rates, after increasing rapidly throughout the 20th century, largely plateaued after 1970.[22] Broad economic factors also played a role, especially the slowdown in wage growth among low-skilled male workers since 1973. On the other hand, employment and wages among women increased, and this should have led to increased self-sufficiency.[23]
Although President Johnson intended the War on Poverty to increase Americans’ capacity for self-support, exactly the opposite has occurred. The vast expansion of the welfare state has dramatically weakened the capacity for self-sufficiency among many Americans by eroding the work ethic and undermining family structure.
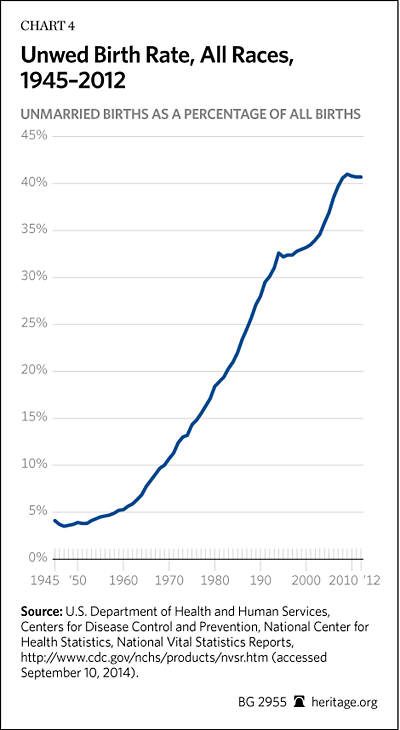
When Johnson launched the War on Poverty, 7 percent of American children were born outside of marriage. Today, the number is over 40 percent. (See Chart 4.) As the welfare state expanded, marriage stagnated and single parenthood soared.
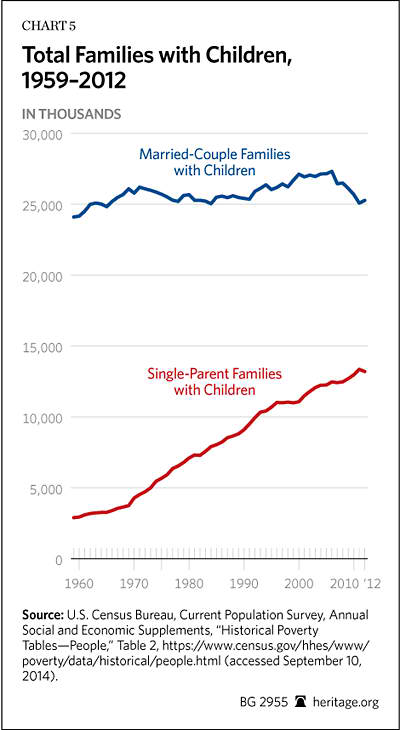
As Chart 5 shows, there has been no significant increase in the number of married-couple families with children (both poor and non-poor) in the U.S. since 1965. By contrast, the number of single-parent families with children has skyrocketed by nearly 10 million, rising from 3.3 million such families in 1965 to 13.2 million in 2012. Since single-parent families are roughly four times more likely than married-couple families to lack self-sufficiency (and to be officially poor), this unravelling of family structure has exerted a powerful downward pull against self-sufficiency and substantially boosted the official child poverty rate.
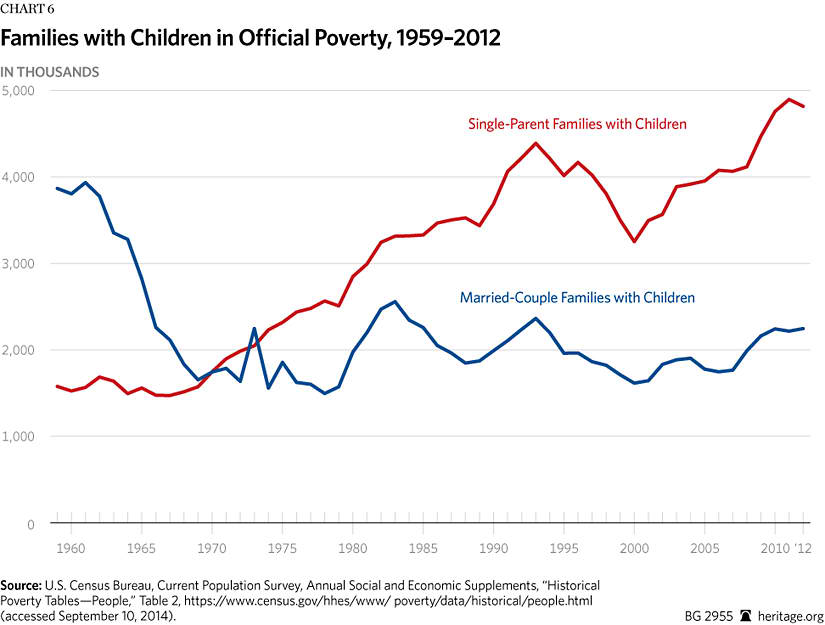
Since the beginning of the War on Poverty, the absolute number of married-couple families with children in official poverty has declined, but as Chart 6 shows, the number of single-parent families in official poverty (or lacking self-sufficiency) has more than tripled, increasing from 1.6 million in 1965 to 4.8 million today. When the War on Poverty began, 36 percent of poor families with children were headed by single parents; today, the figure is 68 percent. [24]
The War on Poverty crippled marriage in low-income communities. As means-tested benefits were expanded, welfare began to serve as a substitute for a husband in the home, eroding marriage among lower-income Americans. In addition, the welfare system actively penalized low-income couples who did marry by eliminating or substantially reducing benefits. As husbands left the home, the need for more welfare to support single mothers increased. The War on Poverty created a destructive feedback loop: Welfare promoted the decline of marriage, which generated the need for more welfare.
Today, unwed childbearing and the resulting growth of single-parent homes is the most important cause of official child poverty.[25] If poor women who give birth outside of marriage were married to the fathers of their children, two-thirds would immediately be lifted out of official poverty and into self-sufficiency.[26]
The welfare state has also reduced self-sufficiency by providing economic rewards to able-bodied adults who do not work or who work comparatively little. The low level of parental work is a major cause of official child poverty and the lack of self-sufficiency. Even in good economic times, the median poor family with children has only 1000 hours of parental work per year. This is the equivalent of one adult working 20 hours per week. If the amount of work performed in poor families with children was increased to the equivalent of one adult working full-time through the year, the poverty rate among these families would drop by two-thirds.[27]
Conclusion
This lack of progress in building self-sufficiency is due in major part to the welfare system itself. Welfare wages war on social capital, breaking down the habits and norms that lead to self-reliance, especially those of marriage and work. It thereby generates a pattern of increasing intergenerational dependence. The welfare state is self-perpetuating: By undermining productive social norms, welfare creates a need for even greater assistance in the future.
As the War on Poverty passes the half-century mark, it is time to rein in the endless growth in welfare spending and return to LBJ’s original goals. As the economy improves, total means-tested spending should be moved gradually toward pre-recession levels. Able-bodied, non-elderly adult recipients in all federal welfare programs should be required to work, prepare for work, or at least look for a job as a condition of receiving benefits.
Finally—and most important—the anti-marriage penalties should be removed from welfare programs, and long-term steps should be taken to rebuild the family in lower-income communities.
—Robert Rector is a Senior Research Fellow and Rachel Sheffield is a Policy Analyst in the Institute for Family, Community, and Opportunity at The Heritage Foundation.