Workers are legally represented by unions in workplace negotiations. In theory, this legal representation is legitimized through a democratic process in which workers vote in favor of union representation. In practice, only 6 percent of those covered by unions under the National Labor Relations Act (NLRA) have ever voted for union representation. In some cases, National Labor Relations Board (NLRB) rules allow unions to organize workplaces without majority support or even an election. Unions do not have to stand for re-election after being formed, and it is difficult for workers to request a decertification election to remove an unwanted union. As a result, most current U.S. union members are represented by unions they had no say in electing. The NLRA election process, while nominally democratic, does not measure the preferences of current American workers.
Unelected Representatives
The preamble to the NLRA declares its goal as “protecting the exercise by workers of full freedom of association, self-organization, and designation of representatives of their own choosing.”[12] On paper, the NLRA fulfills this goal by allowing workers to democratically elect bargaining representatives. If workers vote for union representation, their union then negotiates working conditions on their behalf. Theoretically, the election process makes unions accountable to the workers they represent. In reality, very few union members ever voted for union representation.
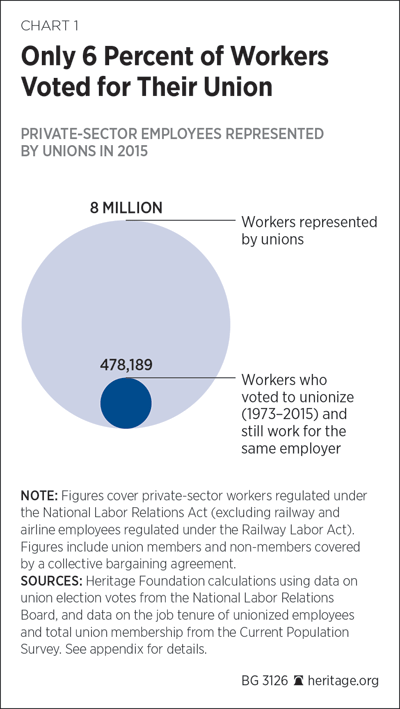
Chart 1 shows the total number of workers who voted for union representation in National Labor Relations Board (NLRB) elections between 1973 and 2015.[3] Unions represent 8 million workers under the NLRA. Only 478,000 of these—6 percent—voted for union representation at some point in their careers and remain employed by the company at which they voted.[4] The remaining 94 percent are represented by a union they either voted against or never voted on.
Four aspects of NLRB election procedures cause unions to primarily represent workers who never voted for their representation:
- Unions can bypass workplace elections entirely by pressuring employers to forgo a secret ballot.
- When employees do vote, unions need not obtain the support from a majority of employees in the workplace.
- Once formed, unions do not stand for re-election. They remain certified indefinitely unless removed in a decertification election.
- The NLRB and unions make calling for such decertification elections difficult.
These polices systematically reduce union accountability to their members.
Card Check
The NLRA allows—but does not require—employers to request a secret ballot election before it requires them to recognize and bargain with a union.[5] The Supreme Court has ruled that an employer may voluntarily recognize a union if a majority of its workers publicly sign membership cards (card check).[6] The right to request an election resides with the employer, not with employees.
Unions find organizing under card check much easier than with secret ballot elections. If a worker decides not to sign the card, organizers can come back again and again to pressure him to change his mind. In some cases, organizers do not even explain that the cards represent a binding commitment to support the union.[7] As a result, once an employer assents to card check, unions almost always become workers’ representatives.
Employers typically prefer secret ballot elections, but unions have become adept at pressuring them into accepting card check. Unions will wage public relations campaigns against corporations designed to hurt their reputation and drive away customers. Unions threaten to continue these attacks until the company agrees to forgo a secret ballot vote.[8] As former UNITE-HERE President Bruce Raynor explained, unions win these campaigns because: “We’re not businessmen, and at the end of the day, they are. If we’re willing to cost them enough, they’ll give in.”[9]
The AFL–CIO claims that 80 percent of its newly organized workers join through card check. Independent estimates put the figure closer to one-third.[10] Either way, large numbers of union members are organized without an election. Many of these workers would not choose representation if they could cast a private ballot.
The United Auto Workers (UAW) demonstrated this recently in a Volkswagen plant in Chattanooga, Tennessee. A majority of workers at the plant publicly signed union membership cards. Volkswagen then requested a secret ballot election. Both the union and the company expected the union to win the vote. However, in the privacy of the voting booth, a majority of the plant’s workers voted not to join the UAW.[11]
Inherited Unions
Once a union is certified, either through card check or an election, it remains certified indefinitely. This stands in stark contrast to political representation. Political representatives in America serve for a fixed term of office. Their election gives them a mandate to represent their constituents, but that mandate lasts only a fixed period of time. To continue in office, political representatives must run for re-election.
Union representation does not operate on this principle. The NLRB presumes that workers continue to support their union absent strong evidence to the contrary.[12] This “presumption of majority support” means that most unions remain certified indefinitely. Unless workers successfully petition for decertification, the union remains in place. New hires at a unionized firm inherit the representatives for which their predecessors voted.
For example, between 1936 and 1941, the UAW organized the Detroit automakers—General Motors, Ford, and Chrysler. The automakers’ current employees were all hired well after 1941, and they never voted for UAW representation themselves. But the “presumption of majority support” means that the UAW never had to win their support in a new election.
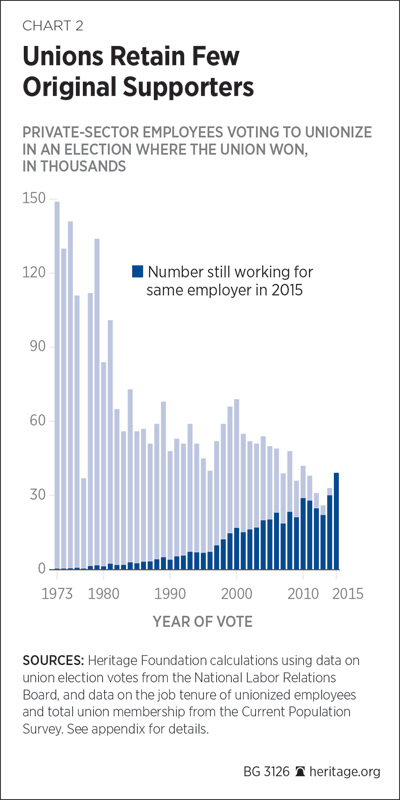
Most U.S. union members inherited representation this way. Chart 2 shows the number of pro-union votes in NLRB organizing elections unions won between 1973 and 2015, and the number of those workers still working at their company. The overwhelming majority of workers who voted for union representation have either retired or switched employers. Their decisions nonetheless bind the employees who replaced them.
Minority Support
When employers request a vote, unions often win without the support of a majority of workers. On paper, the law seems to prohibit this. The NLRA specifies that:
Representatives designated or selected for the purposes of collective bargaining by the majority of the employees in a unit appropriate for such purposes, shall be the exclusive representatives of all the employees in such unit for the purposes of collective bargaining.[13]
However, NLRB regulations require unions only to obtain a majority from those voting in organizing elections—not necessarily a majority of the overall workforce. The NLRB presumes that non-voting workers assent to their voting colleagues’ choices.
For example, on August 19, 2015, workers at the LINQ Hotel and Casino in Las Vegas voted on whether to join the UAW. The UAW got 74 votes, 42 workers voted against it, and 131 did not vote.[14] The UAW won the election despite the fact that fewer than one-third of all employees voted for representation by the UAW.
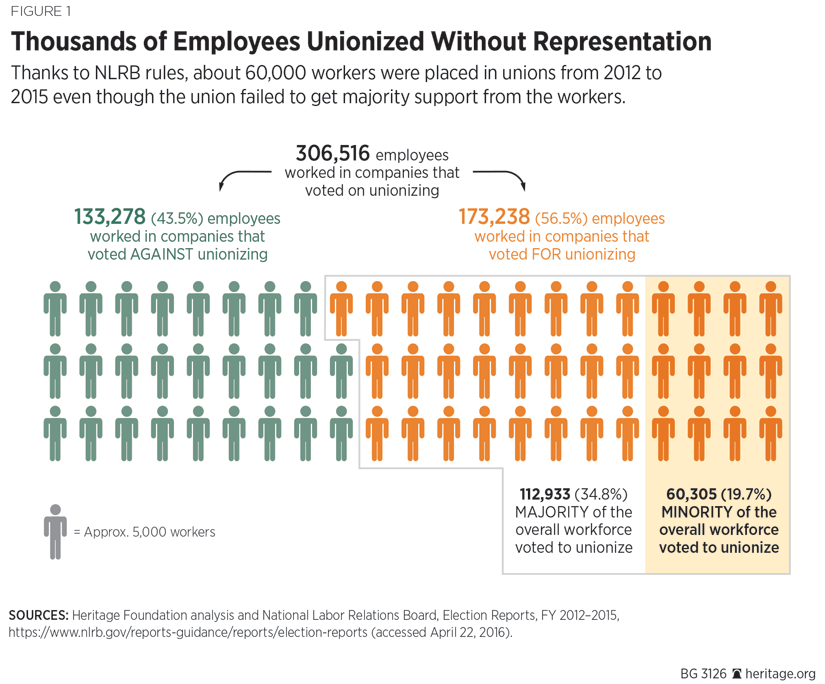
This system causes unions to organize many workplaces with support from only a minority of workers. Figure 1 shows the results of all NLRB certification elections between fiscal year (FY) 2012 and FY 2015. One-third of all employees organized in these elections work in firms where the union lacked majority support. If unions needed majority support in the workplace—not just a majority of voters—they would have organized 60,000 fewer workers between 2012 and 2015. Unions represent many workplaces where most workers did not vote for them. They continue to represent these workers indefinitely.
Difficult to Decertify
Dissatisfied workers can petition for a decertification election to remove their union representative. However, NLRB policies and union opposition make requesting a decertification vote difficult. Workers must collect signatures from 30 percent of the employees in their bargaining unit. Under the NLRB’s “contract bar” doctrine workers cannot collect or submit these signatures during the course of a collective bargaining agreement. This typically leaves workers with just one month every three years to petition for a new election.[15] Furthermore, workers may not collect these signatures while on the clock or in work areas.[16] This limited time window and restrictive policies make gathering enough signatures to trigger an election challenging.
Unions heavily pressure workers not to sign or distribute these petitions; they do not want to lose members and dues. Most unions also expel workers who support decertification. The UAW constitution, for example, calls for the expulsion of any member “affirmatively engaged in efforts to decertify the International Union or any subordinate body thereof.”[17]
Being expelled from the union means that a worker cannot vote in elections for union officers or vote on ratifying a new contract. Signing a decertification petition means that workers lose the little say they have in how their union operates—even though it will still represent them if the decertification attempt fails.
These barriers make decertification votes extremely rare. In FY 2015, fewer than 10,000 private-sector union members voted in a decertification election.[18] That amounts to just 0.1 percent of the 8 million workers unionized under the NLRA. Unions lost three-fifths of these decertification elections.[19] But the remaining 99.9 percent of unionized workers never even had the opportunity to vote.
Limited Representative Accountability
The combination of these policies undermines the NLRA’s goal of allowing workers to designate representatives of their own choosing. Fully 94 percent of union members did not vote for union representation. They are represented by a union that someone else chose, often decades earlier. Workers who want a different union representative—or no union—face considerable difficulty in implementing these preferences. Current NLRB election processes fail to reflect the preferences of American workers.
—James Sherk is Research Fellow in Labor Economics in the Center for Data Analysis, of the Institute for Economic Freedom and Opportunity, at The Heritage Foundation. The author is grateful to CDA intern Max Lies for his invaluable research.
Appendix: Data and Methodology
Charts 1 and 2 show estimates of the number of union-represented workers who voted for a union and remain represented by the union for which they voted. The Heritage Foundation’s Center for Data (CDA) analysis calculated these figures as follows:
- The CDA compiled data from the NLRB on the number of pro-union votes cast in certification elections unions won between FY 1973 and FY 2015.[20] For FY 1973–2009, this information is available in various tables in the NLRB annual reports under the subheading “Valid Votes Cast in Elections Unions Won: Votes for Unions.”[21] The NLRB discontinued its annual report in 2010, but that year it published online the statistical data that would have populated the report.[22] For FY 2011–2015, the CDA directly tabulated the number of votes cast in favor of union representation in elections unions won from the NLRB’s published annual election reports.[23]
- The CDA used data from the Current Population Survey (CPS) 2010 and 2012 job-tenure supplements to calculate the proportion of union-represented employees that have worked at the same job for a given number of years.[24] The CDA restricted this analysis to union-represented workers in industries covered by the NLRA. The CDA used tenure data from the 2012 supplement for tenure up to 39 years. The 2012 supplement top-codes job tenure at 39 years; the earlier supplements do not. For job-tenure estimates exceeding 39 years, the author used the estimates from the 2010 supplement.
- The CDA then multiplied this proportion by the number of pro-union votes cast each year.[25] For example, the 2012 job tenure supplement shows that 43 percent of workers represented by unions have worked at their current employer for at least 10 years. Approximately 50,000 pro-union votes were cast in elections unions won in 2005, 10 years before 2015. So the CDA multiplied 50,000 by 43 percent to obtain a preliminary estimate of the number of pro-union voters in 2005 still employed with the firm where they voted. For 2005, this figure was roughly 21,500 workers. The CDA repeated this process for each year from 1973 through 2015. Negligible numbers of workers who voted for union representation before 1973 remain employed with the firm where they voted.
- The CDA adjusted these preliminary estimates to account for the decline in overall union coverage.[26] The CDA did this by multiplying the preliminary estimates from step three by the ratio of the number of workers that unions represented under the NLRA in 2015 to the number they did in each preceding year. For example, Bureau of Labor Statistics figures show that unions represented approximately 8.46 million workers under the NLRA in 2005, and 8.01 million workers in 2015. So the interim 2005 estimate from step 3 (21,500 workers) was multiplied by 8.01/8.46. This produced a final estimate of 20,300 pro-union voters from 2005 still employed at the same firm in 2015. The CDA repeated this process for every year from 1973 through 2015.
- The CDA estimated the number of workers represented by unions under the National Labor Relations Act in step 4 using CPS data made publicly available at Unionstats.com.[27] The CDA used Unionstats estimates of annual private-sector union coverage, then subtracted from that total union-represented workers employed in the railway and airline industries (who are covered by the Railway Labor Act). Data on private-sector union coverage is readily available from 1977 to 2015 at Unionstats, excepting 1982, when the CPS did not ask union membership questions. The CDA interpolated 1982 union coverage from 1981 and 1983 coverage. Between 1973 and 1976, the CPS asked only about union membership, not union coverage (which includes non-members covered by collective bargaining agreements). Heritage imputed private-sector union coverage those years by multiplying annual private-sector union membership by the average coverage-to-membership ratio during the 1977–1981 period.[28]
Unionstats.com contains data on union coverage by industry from 1983 to 2015. For prior years, the CDA estimated airline and railway union coverage by calculating the ratio of railway and airline union coverage to total private-sector coverage from 1983 to 1985.[29] The CDA then multiplied this ratio by total private-sector-coverage estimates for 1973 to 1982 to obtain annual estimates of union coverage in the airline and railway industries.


