Contributors
Bryan Riley is Jay Van Andel Senior Analyst in Trade Policy in the Center for Trade and Economics, of the Institute for Economic Freedom and Opportunity, at The Heritage Foundation. Ambassador Terry Miller is Director of the Center for Trade and Economics and the Center for Data Analysis, of the Institute for Economic Freedom and Opportunity, and Mark A. Kolokotrones Fellow in Economic Freedom at The Heritage Foundation.
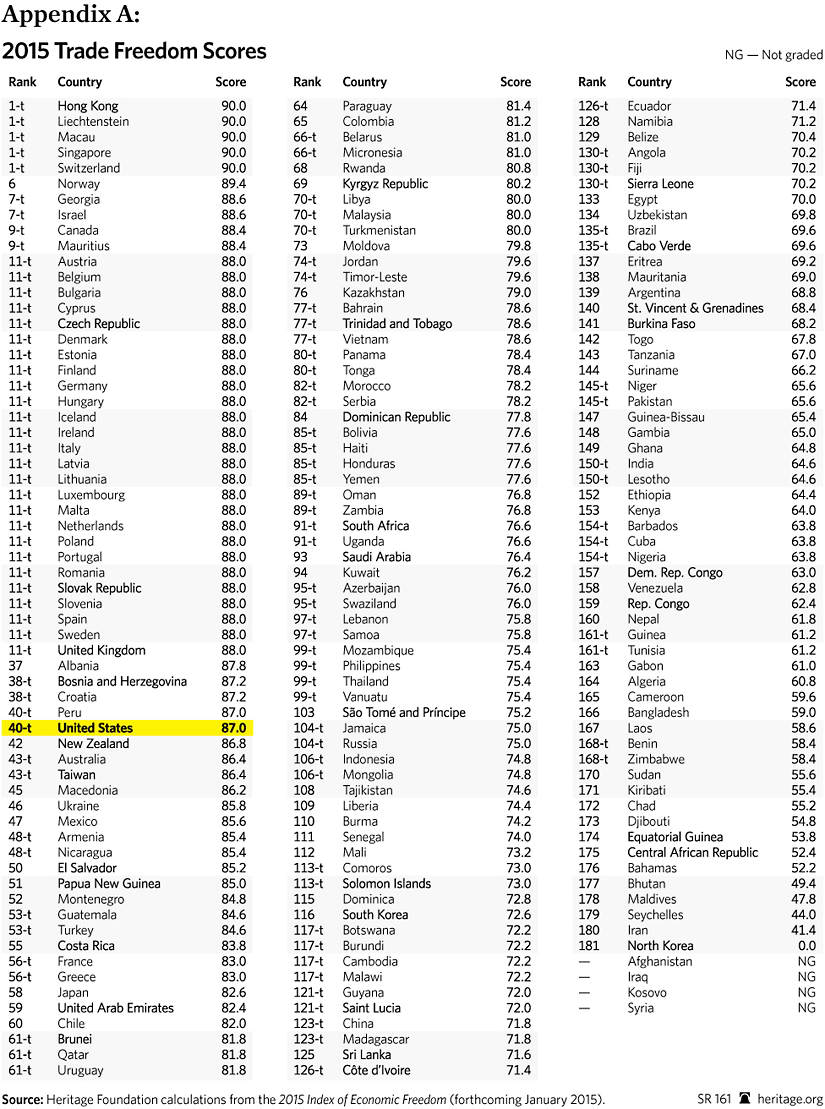
The latest rankings of trade freedom around the world,[1] developed by The Heritage Foundation and The Wall Street Journal in the forthcoming 2015 Index of Economic Freedom,[2] once again demonstrate that citizens of countries that embrace free trade are better off than those in countries that do not. The data continue to show a strong correlation between trade freedom and a variety of positive indicators, including economic prosperity, low poverty rates, and clean environments. Worldwide, the average trade freedom score improved from 74.8 to 75.3 out of a maximum score of 100.
Trade Activity Continues to Rise
The volume of world trade in goods and services plummeted during the global recession, but trade measured in U.S. dollars has rebounded to historically high levels. Since the creation of the World Trade Organization (WTO), global exports have increased by 364 percent, nearly two-and-a-half times more than world gross domestic product (GDP).[3] The WTO predicts that global trade will grow by 4 percent in 2015.[4]
U.S. trade volume has also increased. Total U.S. exports and imports exceeded $5 trillion for the first time in 2013.[5]
Why Trade Freedom Matters
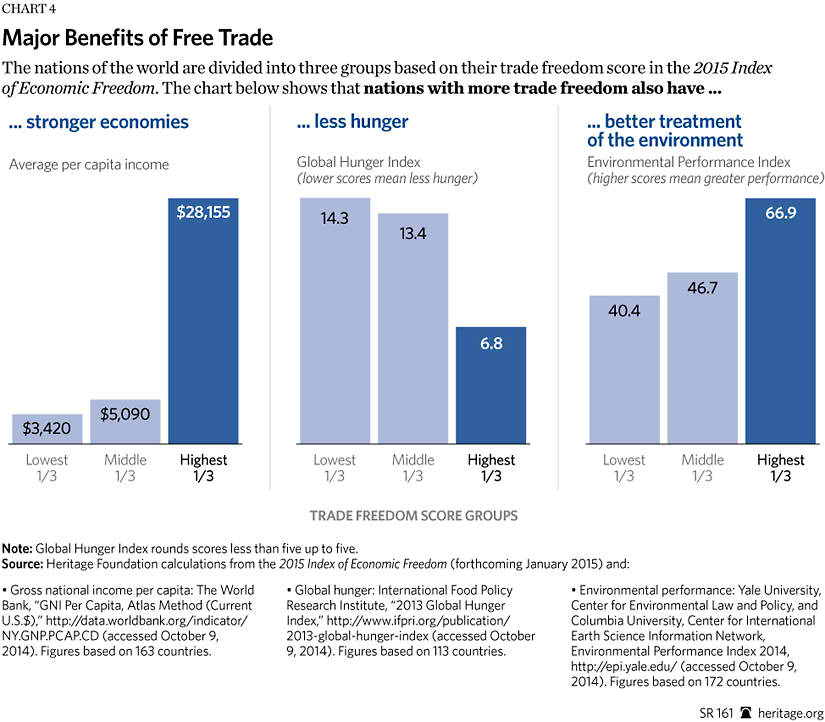
A comparison of economic performance and trade scores in the 2015 Index of Economic Freedom demonstrates the importance of trade freedom to prosperity and well-being. Countries with the most trade freedom have higher per capita incomes, lower incidences of hunger in their populations, and cleaner environments.
Boosting Trade and Economic Freedom
Since World War II, international trade agreements have been a successful tool for reducing barriers to global commerce. In 1947, the average tariff rate in industrial countries was about 40 percent. Today, the average worldwide tariff rate is less than 3 percent.[6] As Heritage Foundation economist Joe Cobb pointed out 20 years ago when Congress was debating the implementing legislation for the Uruguay Round trade pact, these agreements also promote freedom and individual sovereignty:
The most populist and democratic institution ever to evolve in human society is the free market, with strong protections for private property rights, and the freedom of average people to buy whatever they think is best for their families—regardless of the economic nostrums of protectionists.[7]
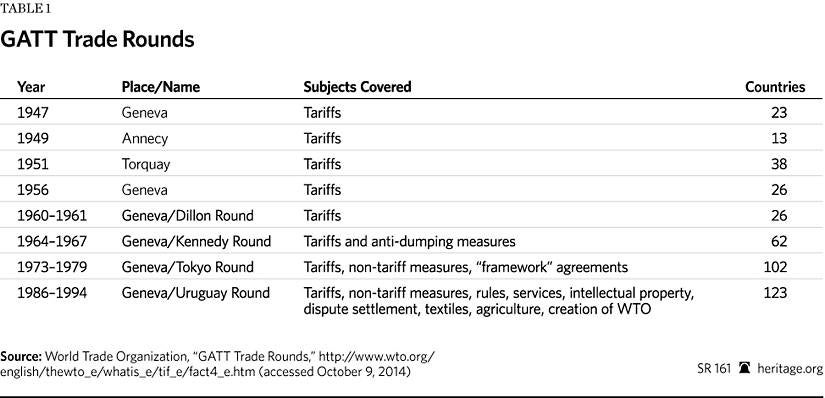
Major reductions in trade barriers took place under the auspices of the General Agreement on Tariffs and Trade (GATT), culminating in the creation of the WTO. However, progress toward multilateral trade liberalization has stalled since then.

From 1947 to 1994, a new round of global trade negotiations was held on average about every six years. The longest gap between agreements was 15 years. It has now been 20 years since the creation of the WTO and conclusion of the Uruguay Round, the last comprehensive global trade agreement.

Although progress toward global trade agreements, including the WTO’s Doha Round, has stalled, use of regional and bilateral free trade agreements to reduce trade barriers has filled the void. Over 200 of these agreements have taken effect since the WTO was created, and dozens more are being negotiated.[8] In addition, many countries have unilaterally reduced trade barriers.
Several ongoing global initiatives promise to lower trade barriers even further. Those initiatives include the Trade Facilitation Agreement, Trade in Services Agreement (TISA), Continental Free Trade Area (CFTA) for Africa, Trans-Pacific Partnership (TPP), and the Transatlantic Trade and Investment Partnership (TTIP).
Trade Facilitation Agreement. In December 2013, WTO members finalized negotiations of the Trade Facilitation Agreement. This agreement encourages measures such as using common customs standards, facilitating electronic payment, publishing trade procedures, customs cooperation, and using a “single window” for trade documents.[9]
As The Heritage Foundation recently noted, cutting red tape at border crossings and improving customs and border procedures would be extremely beneficial.[10] The Peterson Institute for International Economics estimates that trade facilitation could boost global GDP by $960 billion.[11]
Regrettably, India has blocked implementation of the agreement. Whether this trade deal will ever be implemented remains to be seen.[12]
Trade in Services Agreement. In 2013, countries representing a majority of the world’s services market launched the TISA. Trade in services includes international commerce in transportation, travel, communications services, construction, insurance, banking, and computer services. Services exports account for about one-fifth of all global exports. Yet numerous barriers interfere with the free flow of trade in services, including:[13]
- State-owned enterprises that restrict competition from foreign companies,
- Government policies that are biased against services provided by foreign companies,
- Local ownership requirements that prevent foreign service providers from operating without partnering with local businesses,
- Restrictions on the cross-border flow of data used by businesses,
- Restrictive licensing requirements for foreign professionals,
- Data storage requirements that force companies to store their data locally, and
- Restrictions on foreign firms providing shipping and other transportation services.
Service industries account for about 75 percent of the U.S. and European Union (EU) economies.[14]
Continental Free Trade Area for Africa. The African Union represents nearly every country on the continent. In 2012, the African Union Summit approved a plan to create the CFTA for Africa by 2017. According to the Action Plan for Boosting Intra-Africa trade:
Trade is widely accepted as an important engine of economic growth and development. There are many regions and countries of the world that have been able to lift their peoples from poverty to prosperity through trade. Although the African economy is characterized by a relatively high degree of openness, with the ratio of exports and imports to GDP amounting to 55.7% in 2009, trade has not served as a potent instrument for the achievement of rapid and sustainable economic growth and development for many of the countries. As a consequence, Africa remains the most aid-dependent continent of the world, unable to eliminate poverty through trade.[15]

Potential benefits identified by the African Union include improved food security through reductions in agricultural protectionism, increased competitiveness, and reduced reliance on foreign aid.[16] Negotiations are scheduled to begin in 2015.[17]
Trans-Pacific Partnership. The TPP is a set of trade and investment negotiations among the United States, Australia, Brunei, Canada, Chile, Japan, Malaysia, Mexico, New Zealand, Peru, Singapore, and Vietnam.
The TPP is intended to be a “gold standard” agreement that will be open to additional parties, eventually becoming the core of a free trade area for the Asia–Pacific. According to a TPP statement:
A final Trans-Pacific Partnership agreement must reflect our common vision to establish a comprehensive, next-generation model for addressing both new and traditional trade and investment issues, supporting the creation and retention of jobs and promoting economic development in our countries. The deepest and broadest possible liberalization of trade and investment will ensure the greatest benefits for countries’ large and small manufacturers, service providers, farmers, and ranchers, as well as workers, innovators, investors, and consumers.[18]
A high-quality TPP agreement that meets these goals and is open to additional countries would provide a tremendous boost to global trade freedom.
Transatlantic Trade and Investment Partnership. In February 2013, President Barack Obama called for a free trade agreement between the United States and the EU during his State of the Union address. This proposed agreement is now known as the Transatlantic Trade and Investment Partnership. A TTIP agreement that reduces barriers to trade and investment between the United States and the EU, thereby empowering individuals on both continents, would boost trade freedom. To be successful, negotiators need to resist efforts to create new regulatory barriers to trade under the guise of “harmonization.”
Unilateral Liberalization
In addition to these and other trade agreements, all countries have the opportunity to reduce trade barriers on their own and reap the benefits, including increased foreign investment and faster economic growth.
- Economist Richard Baldwin lauded unilateral tariff cuts in developing countries beginning in the 1980s as a “pervasive” and “curiously universal phenomenon.”[19]
- Economist Pierre-Louis Vezina observed: “Moreover, the two decades of unilateral tariff-cutting in emerging economies accompanied the most successful trade-led development model of the past 50 years, i.e., ‘Factory Asia.’”[20]
- A World Bank study concluded that tariffs in developing countries fell by 21 percentage points between 1983 and 2003. Two-thirds of these cuts were unilateral and did not result from trade negotiations.[21]
- Moises Naim, Venezuela’s former Minister of Trade and Industry, wrote in Foreign Policy: “Indeed, one of the surprises of the past 20 or so years is how much governments have lowered obstacles to trade—unilaterally.”[22]
With the growth in value chains (described below), more countries should recognize the benefits of unilateral tariff cuts.
Value Chains and Trade Policy
In the past, many countries embraced a misguided mercantilist view of trade: exports good, imports bad. This theory is especially damaging in today’s global economy, which increasingly relies on global value chains. Today, it is rare for a product traded on the global market to be made entirely in one country. Trade analysts generally understand that the modern global economy has changed how people should think about trade:
- “As production has become more globally integrated, imported components account for a rising share of the value of exports. Many countries may contribute inputs to a good, and the final assembler may capture only a small share of the product’s value.”[23]
- “With the globalization of production, there is a growing awareness that conventional trade statistics may give a misleading perspective of the importance of trade to economic growth and income and that ‘what you see is not what you get’…. This reflects the fact that trade flows are measured gross and that the value of products that cross borders several times for further processing are counted multiple times. Policymakers are increasingly aware of the necessity of complementing existing statistics with new indicators better tuned to the reality of global manufacturing, where products are ‘Made in the World.’”[24]
- “The notion of ‘country of origin’, something carefully recorded by customs authorities, is in particular losing much of its significance, since the total commercial value of a product is attributed to the country in which it last underwent processing, regardless of its relative contribution to the value-added chain. As a result, the study of bilateral trade balances is becoming less relevant.”[25]
- “Protective measures against imports of intermediate products increase the costs of production and reduce a country’s ability to compete in export markets: tariffs and other barriers to imports are effectively a tax on exports. Therefore, policies that restrict access to foreign intermediate goods and services also have a detrimental impact on a country’s position in the regional or global supply chain.”[26]
Examples of how traditional trade statistics can be misleading include:
- When an iPhone is imported to the United States, the entire value is counted as an import from China. But very little of the iPhone’s value comes from China. A 2011 study found that while every U.S. sale of an iPad or iPhone added more than $200 to the U.S.–China trade deficit, only about $10 of that cost represented wages paid to Chinese workers. Although iPads and iPhones are assembled in China, the biggest share of money spent on these products goes to Apple employees and shareholders in the United States—not to China.[27]
- According to a study from the Federal Reserve Bank of San Francisco: “Obviously, if a pair of sneakers made in China costs $70 in the United States, not all of that retail price goes to the Chinese manufacturer. In fact, the bulk of the retail price pays for transportation of the sneakers in the United States, rent for the store where they are sold, profits for shareholders of the U.S. retailer, and the cost of marketing the sneakers. These costs include the salaries, wages, and benefits paid to the U.S. workers and managers who staff these operations.”[28]
- Between 69.5 percent and 75.4 percent of the value of “imported” cotton knit shirts and woven cotton pants goes to Americans, including those who developed, designed, transported, and sold the clothing.[29]
In 2013, a World Economic Forum study concluded that reducing barriers to global supply chains could increase global GDP by up to six times more than eliminating all tariffs.[30] As the Heritage Foundation has observed, “Promoting free trade should not just be about exports. Imports are a vital part of the U.S. economy, creating valuable jobs in some of our most innovative sectors.”[31] This is especially evident when businesses import the intermediate goods they need to make competitive products.
Next Steps for Trade
Governments interested in higher economic growth, less hunger, and better environmental quality should reduce trade barriers. Options for boosting trade freedom include:
- Negotiating comprehensive global deals, such as the Uruguay Round trade agreement;
- Adopting regional and bilateral trade agreements that reduce trade barriers;
- Sector-specific negotiations in areas of general agreement on the benefits of liberalization; and
- Unilateral reductions in trade barriers made out of economic self-interest, including benefits from global value chains. In the United States, for example, half of all imports are intermediate goods used by U.S. manufacturers. Permanently eliminating tariffs on these products would be in the country’s self-interest.
Surveys suggest that people would welcome leadership on these issues. According to a recent Pew Research survey conducted in 44 countries, a median of 81 percent of people believe trade is good.[32] A 2014 survey by the Chicago Council for Public Affairs found strong support for international commerce in the United States. According to that survey, 65 percent of Americans believe “globalization, especially the increasing connections of our economy with others around the world, is mostly good for the United States.”[33]
The 2015 Index of Economic Freedom shows that people who live in countries with low trade barriers are better off than those who live in countries with high trade barriers. Reducing those barriers—whether unilaterally, bilaterally, or multilaterally through regional trade agreements, comprehensive global agreements, or sector-specific negotiations—is a proven recipe for prosperity.
Appendix B: Methodology
The trade freedom scores reported in this paper are based on two variables: trade-weighted average tariff rates and non-tariff barriers (NTBs).
Different imports entering a country can, and often do, face different tariffs. The weighted average tariff uses weights for each tariff based on the share of imports for each good. Weighted average tariffs are a purely quantitative measure and account for the basic calculation of the score using the equation:
Trade Freedomi = (Tariffmax – Tariffi) / (Tariffmax – Tariffmin) x 100 – NTBi
where Trade Freedomi represents the trade freedom in country i, Tariffmax and Tariffmin represent the upper and lower bounds for tariff rates, and Tariffi represents the weighted average tariff rate in country i. The minimum tariff is naturally zero, and the upper bound was set as a score of 50. NTBi, an NTB penalty, is then subtracted from the base score. The penalty of 5, 10, 15, or 20 points is assigned according to the following scale:
- Penalty of 20. NTBs are used extensively across many goods and services or impede a significant amount of international trade.
- Penalty of 15. NTBs are widespread across many goods and services or impede a majority of potential international trade.
- Penalty of 10. NTBs are used to protect certain goods and services or impede some international trade.
- Penalty of 5. NTBs are uncommon, protecting few goods and services, with very limited impact on international trade.
- No penalty. NTBs are not used to limit international trade.
Both qualitative and quantitative data are used to determine the extent of NTBs in a country’s trade policy regime. Restrictive rules that hinder trade vary widely, and their overlapping and shifting nature makes gauging their complexity difficult. The categories of NTBs considered in the trade freedom penalty include:
- Quantity restrictions. These include import quotas, export limitations, voluntary export restraints, import/export embargoes and bans, and countertrade measures.
- Price restrictions. These include antidumping duties, countervailing duties, border tax adjustments, and variable levies and tariff rate quotas.
- Regulatory restrictions. These include licensing; domestic content and mixing requirements; sanitary and phytosanitary standards; safety and industrial standards regulations; packaging, labeling, and trademark regulations; and advertising and media regulations.
- Customs restrictions. These include advance deposit requirements, customs valuation procedures, customs classification procedures, and customs clearance procedures.
- Direct government intervention. These include subsidies and other aids; government industrial policy and regional development measures; government-financed research and other technology policies; national taxes and social insurance; competition policies; immigration policies; state trading, government monopolies, and exclusive franchises; and government procurement policies.
As an example, Brazil received a trade freedom score of 69.6. By itself, Brazil’s weighted average tariff of 7.7 percent would have yielded a score of 84.6, but the existence of NTBs in Brazil reduced its score by 15 points.
Gathering data on tariffs to make a consistent cross-country comparison can be a challenging task. Unlike data on inflation, for instance, some countries do not report their weighted average tariff rate or simple average tariff rate every year. To preserve consistency in grading trade policy, the authors use the World Bank’s most recently reported weighted average tariff rate for a country. If another reliable source reported more updated information on a country’s tariff rate, the authors note this fact and may review the grading if strong evidence indicates that the most recently reported weighted average tariff rate is outdated.
The World Bank produces the most comprehensive and consistent information on weighted average applied tariff rates. When the weighted average applied tariff rate is not available, the authors use the country’s average applied tariff rate. When the country’s average applied tariff rate is not available, the authors use the weighted average or the simple average of most-favored-nation (MFN) tariff rates.[34] In the very few cases in which data on duties and customs revenues are not available, the authors use international trade tax data instead.
In all cases, the authors clarify the type of data used and the different sources for those data in the corresponding write-up for the trade policy factor. When none of this information is available, the authors simply analyze the overall tariff structure and estimate an effective tariff rate.
The trade freedom scores for 2015 are based on data for the period covering the second half of 2013 through the first half of 2014. To the extent possible, the information is current as of June 30, 2014. Any changes in law effective after that date have no positive or negative impact on the 2015 trade freedom scores.
Finally, unless otherwise noted, the authors use the following sources to determine scores for trade policy, in order of priority:
- The World Bank, World Development Indicators 2014.
- The World Trade Organization, Trade Policy Review, 1995–2014.
- Office of the U.S. Trade Representative, 2014 National Trade Estimate Report on Foreign Trade Barriers.
- The World Bank, Doing Business 2013 and Doing Business 2014.
- U.S. Department of Commerce and U.S. Department of State, Country Commercial Guide, 2009–2014.
- Economist Intelligence Unit, Country Commerce, 2014.
- World Economic Forum, The Global Enabling Trade Report 2014.
- Official government publications of each country.


