Abstract: Salaries and benefits—for identical jobs—are 30 percent to 40 percent higher in the federal government than in the private sector. Claims that this dramatic discrepancy in compensation is warranted because of government workers’ high skills are unjustified, as this study shows. Equally unjustified is the fact that federal workers can rarely be fired, no matter how poor their job performance. Congress should align federal salaries and benefits with market rates—a simple, and fair, move that could save taxpayers nearly $47 billion in 2011. Heritage Foundation labor policy analyst James Sherk provides detailed data on why Congress should not overtax all Americans to overpay the privileged workers in the civil service.
Many news organizations have reported that the average federal employee earns more than the average private-sector worker.[1] Is higher federal pay justified given that the federal government employs a more skilled workforce than the private sector? Detailed analysis shows that the size of the wage discrepancies is not warranted:
- The federal pay system gives the average federal employee hourly cash earnings 22 percent above the average private worker’s, controlling for observable skills and characteristics.
- Including non-cash benefits adds to this disparity. The average private-sector employer pays $9,882 per employee in annual benefits, while the federal government pays an average of $32,115 per employee.
- Overall, controlling for other factors, federal employees earn approximately 30 percent to 40 percent more in total compensation (wages and benefits) than comparable private-sector workers.
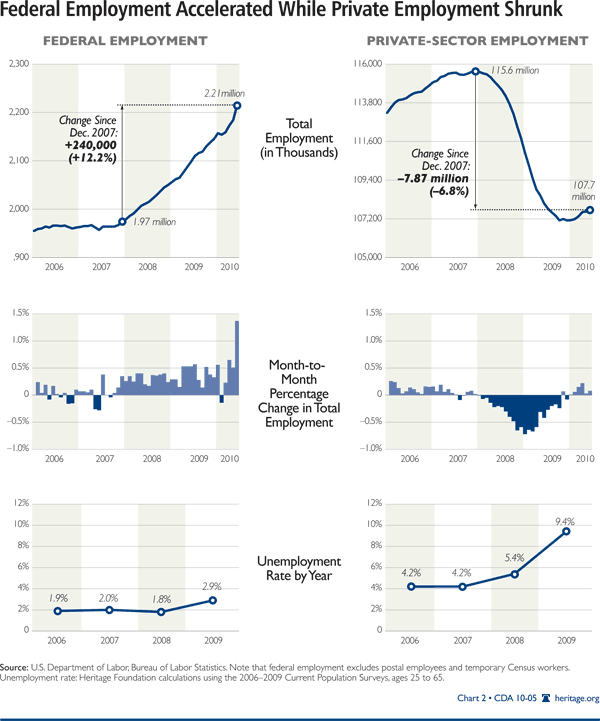
- Federal employees enjoy job security irrespective of the state of the economy. Since the recession began, federal employment has risen by 240,000—12 percent. The unemployment rate for federal employees has only slightly risen from 2.0 percent to 2.9 percent between 2007 and 2009.
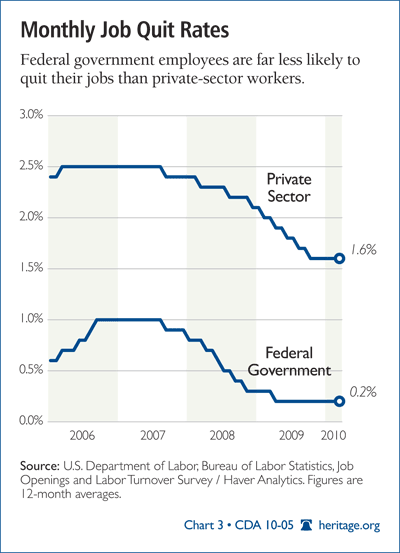
- Federal employees demonstrate with their actions that they receive better compensation in the public sector than in the private sector: They quit their jobs at one-third the rate of the private employees.
- Bringing federal compensation in line with private-sector compensation would save taxpayers approximately $47 billion in 2011.
Of course, these averages mask large differences in pay across occupations and skill levels. Many federal employees in highly skilled occupations receive market wages. However, semi-skilled federal workers earn substantially more than they would in the private sector. Congress should not cut federal pay across the board—this would unfairly penalize the federal workers who earn market wages.
Instead, Congress should implement a pay-for-performance system with pay bands based on market signals of labor demand, expand the contracting of federal work to private companies, reduce the generosity of federal benefits, and end the near-absolute job security for underperforming federal workers. Doing so would not solve the country’s fiscal problems, but would be a solid—and fair—step toward a more responsible fiscal policy. The federal government should not overtax the general public to provide significantly above-average pay and benefits to those who work in the civil service.
Productivity Determines Private-Sector Pay
In the private sector, it is productivity that determines workers’ pay.[2] Businesses that pay wages below the associated level of productivity lose quality employees to competitors paying higher wages. Businesses that pay workers more than their productivity lose customers to competitors with lower prices because of lower costs.[3] Broadly speaking, under normal economic conditions, workers in the private sector earn what their productivity merits.[4] In the public sector, they do not. The government sells few goods or services and rarely does so according to market forces, so the market cannot determine pay levels. How much do employees of the Department of Housing and Urban Development contribute to the economy? In lieu of paying on the basis of productivity, the federal government determines pay through wage formulas set by Congress.
How the Government Sets Pay Rates
In theory, the Office of Personnel Management constructs federal pay scales to reflect market wages for similar private-sector jobs. In practice, government wages frequently bear little resemblance to market pay.
The basic federal pay scale is the General Schedule (GS) which covers roughly 70 percent of federal civilian employees. Separate pay systems cover political appointees, senior executives, and blue collar workers. This paper reports averages for employees across these different pay systems.
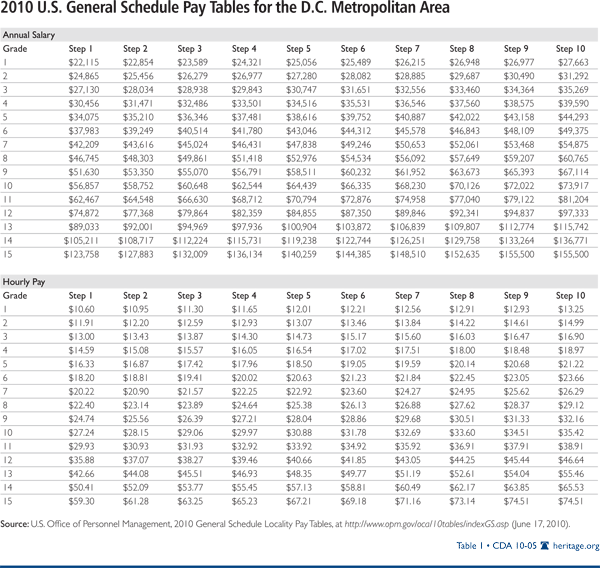
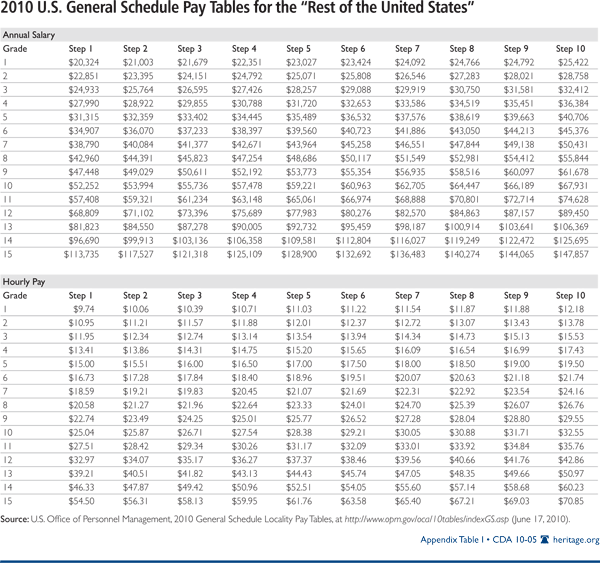
The General Schedule consists of 15 pay grades and 10 steps within those pay grades. GS grades 1 through 7 denote entry-level positions, while grades 8 through 12 mark mid-level positions and grades 13 through 15 are top-level and management positions.[5] The General Schedule also incorporates locality pay adjustments to account for cost-of-living differences across the country and overseas.
Table 1 displays the 2010 General Schedule for the Washington, D.C., metropolitan area, where one in six of all civilian federal employees work.
Federal employees advance through the steps of the General Schedule by seniority, with faster promotions possible for what managers deem good performance—which may or may not relate to workers’ productivity. Except in cases of extreme misconduct, a civil servant will reach the step 10 of his or her grade if he or she remains on the job long enough.[6]
Many federal jobs also involve career ladders that provide for advancement through the grades of the General Schedule. Federal employees begin at the entry level grade for their position and advance, typically annually, through the grades in their career ladder until they reach their full performance level. For example, the Department of Labor had an opening for a staff assistant at a GS-9 level ($51,630 to $67,114 a year).[7] The career track for this position goes from a GS-9 to a GS-11. Consequently, the next year the Department of Labor would promote that staff assistant to the GS-11 grade. That employee would then advance by seniority to step 10 of grade 11, which in the 2010 General Schedule amounts to $81,204 a year.
Significance of a Federal Premium. Very few staff assistants in the private sector earn $81,000 a year with full benefits. But the competition that forces companies to keep costs down does not constrain federal payrolls. Taxes and deficit financing permit the federal government to pay its employees more than they would earn in the private sector. Most Americans find taxing lower-earning private-sector workers to inflate better-paid federal employees’ paychecks offensive. Few support reverse redistribution of wealth. But excessive federal pay has broader importance.
Prices send signals about where individuals should work. Although necessary to keep the government running, most federal jobs contribute little or nothing to economic growth. If the federal government overpays its employees, it will lure more productive workers into less productive tasks. The economy grows faster when workers channel their ambitions into productive activities; landing a job with the government should not be the key to getting ahead. Additionally, the taxes that fund government salaries discourage investment and entrepreneurship. Overpaying government employees means less economic growth and fewer jobs for everyone else.[8]
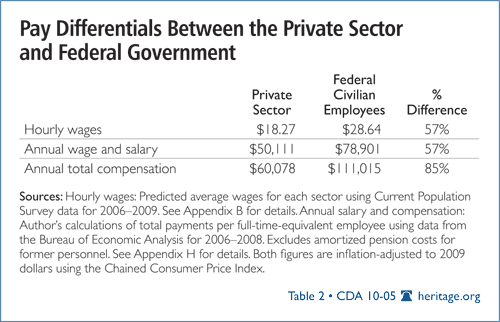
Higher Average Earnings. Table 2 displays various measures of average pay for civilian federal employees and private-sector workers.
The average federal employee earns an annual salary almost 60 percent greater than the average private-sector employee—$79,000 vs. $50,000 a year. Including the value of benefits, such as retirement plans, increases the total compensation gap to 85 percent.
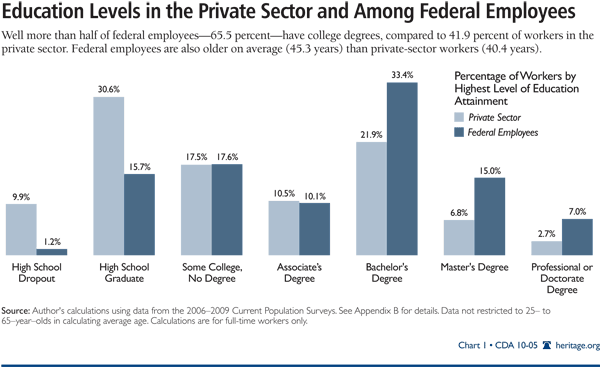
Government Employs Skilled Workforce. The government hires more highly skilled workers, on average, than the private sector. Chart 1 shows the average education level of full-time federal and private-sector workers: 83 percent of federal employees have more than a high school education compared to only 59 percent of private-sector workers. Over one-fifth of federal workers hold more than a bachelor’s degree, more than double the rate in the private sector. The average federal employee is also five years older than the average private-sector worker.
A more skilled workforce naturally earns more than a less skilled one; education and experience increase workers’ productivity. The fact that federal employees earn more on average than private-sector workers does not by itself prove that the government overpays them.
Accounting for Differences in Productivity
Any analysis of pay differences should account for the greater skills of federal employees. Economists have developed statistical techniques to do just that. One of the most frequently used methods, the Oaxaca decomposition, breaks pay differences between groups into a portion explained by differences in observed characteristics (such as education) and an “unexplained” portion for which these differences cannot account. The unexplained difference in pay estimates how much private-sector workers would earn with their measured skills if they worked in the federal government. Appendix A explains the Oaxaca decomposition in greater detail.
Data. To determine how much of a pay premium the federal pay system gives the average federal worker, The Heritage Foundation examined data from the Bureau of Labor Statistics’ Current Population Survey (CPS) for 2006 through 2009.[9] The author of this report used an Oaxaca decomposition to examine the explained and unexplained differences in federal and private-sector pay. He restricted the analysis to full-time employees between the ages of 25 and 65. The analysis controls for differences in age, education, marital status, race, gender, citizenship and nativity, state, year, and size of metropolitan area. The study looks at workers in the federal bureaucracy—federal employees in the field of public administration. This excludes some federal workers, such as postal employees. Appendix B explains the data used and methodology in greater detail. Appendices E and F present results for alternative definitions of federal employees, including postal workers.
Higher Cash Hourly Wages. Looking first at cash earnings (excluding benefits such as health insurance) the average federal employee earns $28.64 an hour compared to $18.27 an hour in the private sector—56.8 percent higher pay. The different skills and characteristics of federal employees only partially explain these higher cash wages.
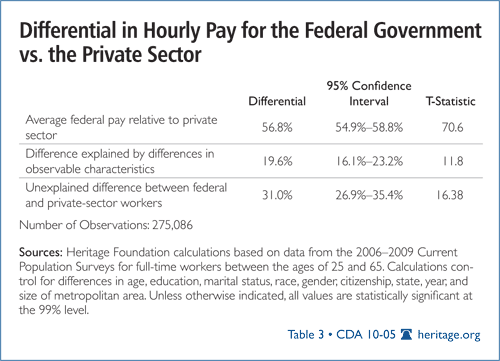
A portion of federal workers’ higher cash pay comes from their higher skills. Private-sector workers with the same characteristics as the average federal employee earn 19.6 percent more than average private-sector hourly pay. However, skill differences explain only a minority of the pay gap. The government pays the average federal employee 31 percent more than what can be accounted for by observable characteristics like education and demographics.[10]
Controlling for Occupation. This analysis ignores occupational wage differentials. Some occupations earn higher wages than others; for example, managers typically make more than administrative staff. If the federal government employs a different occupational mix than the private sector, this may account for federal workers’ otherwise unexplainably higher wages.
Controlling for occupation presents serious challenges, however, because many federal occupations exist only in government. The Internal Revenue Service’s agents, for example, have few private-sector counterparts. This makes it difficult to distinguish between higher pay in occupations that exist in the federal government and the federal government paying more in general. Two approaches to estimating the actual federal wage premium involve controlling for occupational wage differences at an aggregated level or examining only those workers in occupations that exist in both sectors.
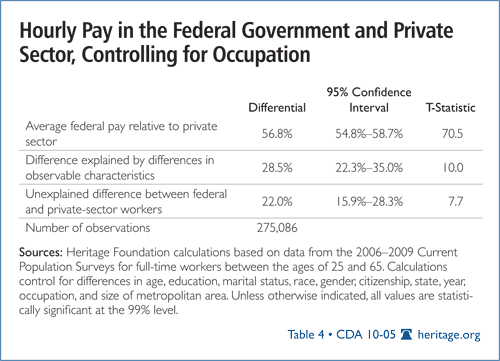
Broad Occupational Controls. The first method involves grouping occupations into broad categories of similar positions. The Bureau of Labor Statistics classifies respondents to the Current Population Survey into occupational categories, such as “Business and financial operations,” “Healthcare practitioner and technical,” and “Office and administrative support” occupations.[11] Table 4 displays the Oaxaca decomposition of the federal–private pay gap using the same methodology as in Table 3, but including controls for these broad occupational categories.
Controlling for occupation raises the amount of the federal–private pay gap that observable characteristics explain to 28.5 percent. That still leaves the federal government paying an unexplained 22 percent average premium—above and beyond what the skills, demographic characteristics, and occupations of federal employees account for.
Occupations Common to Both Sectors
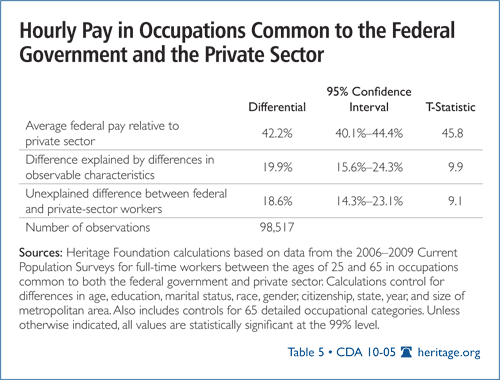
Such broad occupational groupings aggregate hundreds of distinct occupations with different earnings into single categories. Another method is to compare only workers in occupations that exist in both the federal government and the private sector. Many occupations fall into this category: lawyers, receptionists, janitors, and human resource managers, to name a few.[12]
Table 5 shows the wage decomposition for workers in occupations common to both sectors. The government pays these workers a smaller premium than in the overall federal workforce: $29.74 an hour vs. $20.91—a 42.2 percent premium. Observable characteristics, such as education, demographics, and occupation explain about half (19.9 percent) of that difference. That still leaves the federal government paying its average employee 18.6 percent more an hour than otherwise comparable private-sector workers.[13] Looking only at federal employees in occupations that are directly comparable to private-sector workers reduces the federal pay premium only modestly.
Differences by Occupation. The federal government pays its employees an average of approximately one-fifth more than comparable private-sector workers receive. However this premium differs across occupations. Federal employees in some occupations earn less than they would in the private sector and federal employees in other occupations earn much more. Table 6 shows the unexplained hourly pay premium from Table 5 for individual occupations.
In several occupations, federal employees do not receive higher cash pay than private-sector workers. In three occupations the difference is actually negative, although not statistically significant. In other occupations, however, federal workers get paid 40 percent or more above what comparable private-sector workers earn.
Table 6 suggests that the federal workers not getting paid above market rates generally work in highly skilled occupations: engineers, physical sciences, lawyers, and economists. Workers in these occupations earn high wages in the private sector and the government does not pay more than necessary to attract them. Some federal employees would earn more if they left the government. John Roberts, for example, makes $223,500 a year as Chief Justice of the United States. He would almost certainly earn more in private practice.
The federal employees with the largest wage premiums tend to work in more moderately skilled occupations: bookkeeping clerks, security guards, social workers, and receptionists. There are, of course, exceptions to this trend. However, the federal government generally pays employees in semi-skilled occupations very generously. This causes much of the average federal pay premium.
Generous Federal Benefits
On average, federal employees receive higher cash earnings than the private-sector workers whose taxes fund their salaries; observable characteristics account for only a portion of this gap. An employee of the federal government earns an average of 22 percent an hour more than a comparable private-sector worker.
However, hourly wages represent only part of federal employees’ total compensation. The federal government also provides its employees with generous benefits. These benefits include:[14]
- Federal Employees Health Benefits Plan (FEHBP). Federal civilian employees may enroll in the FEHBP. The FEHBP allows federal workers to choose from a menu of health care plans, with the government contributing to the cost of the premiums. No age, health, or pre-existing condition restrictions exist in the FEHBP nor does the government impose waiting periods before benefits start. The FEHBP does not cap lifetime medical expenditures. The federal government contributes a maximum of 72 percent of the weighted average cost of the premiums across all of the available plans.
- Federal Employees Retirement System. Federal employees are automatically covered under the Federal Employee Retirement System (FERS), which includes both a defined-benefit and a defined-contribution pension plan.[15] Employees in the defined-benefit pension with 30 years of experience may retire at the age of 56 with a full pension. Employees with less tenure may retire with full benefits at 60 or at 62.[16] They receive annual benefits of 1 percent of their average pay in their three highest earning years multiplied by their number of years of service.[17] Any federal employee willing to accept reduced pension benefits may retire at age 56.[18] Unlike Social Security, federal employees may collect their pensions while working in a non-federal job. This allows federal employees to retire in their late 50s and take a job in the private sector while collecting pension benefits from the government.
Tax dollars—not employee contributions— cover the overwhelming majority of these costs for federal employees’ retirements. Federal employees may also enroll in a defined-contribution Thrift Savings Plan (TSP) that functions similarly to a 401(k). Employees in the TSP receive matching contributions from the government of up to 5 percent of their pay. Federal employees in FERS also receive Social Security benefits. - Paid Leave. Full-time federal employees with less than three years of experience receive 13 days of paid leave a year. Those with three to 15 years of service earn 20 days of paid leave annually, while those with 15 or more years of service earn 26 days of paid leave. These leave benefits have a cash value: workers on the General Schedule can cash out up to 30 days of paid leave. Full-time federal employees also earn 13 paid sick days a year and receive all federal holidays off—an additional 10 days of paid time off a year. The paid sick leave days carry over without limit each year and unused sick leave counts as time served for calculating pension benefits.
- Student Loan Repayment. Many federal agencies also repay student loans. These payments are capped at a maximum of $10,000 a year or $60,000 total and cover federally insured student loans. To receive loan repayments an employee must commit to working in the agency that repaid the loans for at least three years.
- Federal Employees’ Group Life Insurance. The federal government offers group term life insurance without a medical examination to its full-time and part-time employees. The federal government pays one-third of the cost of the premiums for basic life insurance, with federal employees covering the remaining two-thirds.
- Employee Welfare Benefits. The federal government provides many other benefits to its employees. Many federal buildings offer on-site child care. Federal agencies also offer child care subsidies to lower-income federal employees, health care flexible spending accounts, and parking and commuter subsidies. Federal employees may also enroll in federal life insurance, dental, vision, and long-term care insurance plans. The Office of Personnel Management oversees the administration of these plans, but federal employees pay the full cost of the premiums.
These are more generous benefits than the average private-sector employer offers. Consider paid leave. A private-sector worker with 10 years experience at a firm earns an average of 23 days of paid time off a year.[19] A federal employee with that experience receives 33 days of paid leave a year (20 days of leave and 13 sick days). Those numbers exclude federal holidays; few private-sector employers give paid vacations for Columbus Day, Veteran’s Day, or Martin Luther King Jr.’s birthday.
Measuring Individual Benefits
Bureau of Economic Analysis data show that the average private-sector worker earns $9,882 a year in non-cash compensation while the average federal civilian employee receives $32,115 a year, over three times as much.[20] These figures include health and life insurance, retirement benefits, and employer contributions for mandatory government benefits, such as Social Security. They exclude some benefits, such as the value of paid leave and student loan repayments.
Determining exactly how generous federal benefits are for individual workers is challenging. The Bureau of Economic Analysis uses administrative records to measure the total spent on compensation and total government employment. It does not measure compensation for individual employees. Surveys do not answer this question clearly because most employees do not know how much their benefits cost their employers.
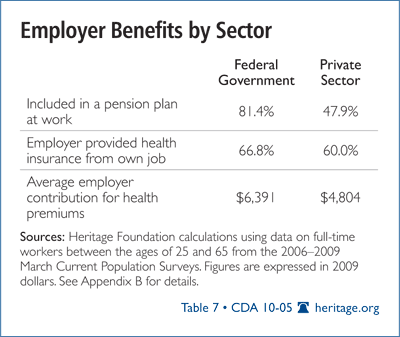
However, surveys can answer some questions about employer-provided benefits. The annual March supplement to the Current Population Survey asks workers whether they have an employer-sponsored pension plan and whether they receive health insurance from their employer. The Bureau of Labor Statistics also estimates the employer contributions toward health costs that these workers receive. Table 7 shows pension and health benefit receipts for federal and private-sector workers.
The federal government offers far more generous benefits than does the typical private-sector employer. While less than half (47.9 percent) of private-sector workers participate in an employer-sponsored pension plan, over four-fifths (81.4 percent) of federal workers do. Federal employees are 7 percentage points more likely to receive health insurance coverage through their employer.[21] They also receive an estimated $1,600 more in employer contributions toward health costs than do private-sector workers.
The Heritage Foundation compiled data from the 2006 to 2009 March supplements to the CPS to determine how much of this difference in benefits are explained by observable differences. The analysis controls for age, education, marital status, race, gender, citizenship, state, year, and metropolitan status. Appendix D explains the data and methodology in greater detail.
Greater Health Benefits. The top panel of Table 8 reports the Oaxaca decomposition for estimated employer contributions to health benefits. The federal government contributes 33.0 percent more toward health care costs than private-sector employers. Observable characteristics explain only 9.1 percent of these greater benefits. Federal employees receive 22.0 percent more in employer payments toward their health care than their observable characteristics explain.
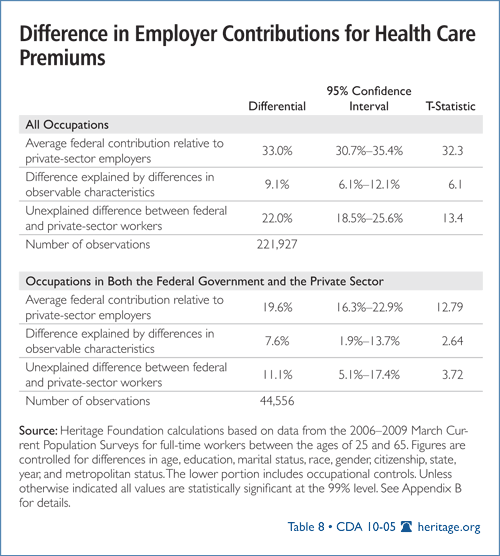
This analysis does not account for occupational differences. The lower panel in Table 8 analyzes employer health benefits for federal employees in occupations with private-sector counterparts. In directly comparable occupations, federal employees receive 11.1 percent more in employer contributions than their observable characteristics can explain. The federal government provides more generous health benefits than the private sector.
More Generous Pension Coverage. The federal government also covers far more of its employees with pension plans than private employers. The CPS asks workers about whether their employers offer pension plans and, if so, whether they participate in them. Table 9 shows the Oaxaca decomposition of pension participation for federal and private-sector workers. The top panel shows the results without occupational controls; the bottom panel shows the results for workers in occupations that exist in both the federal government and the private sector.
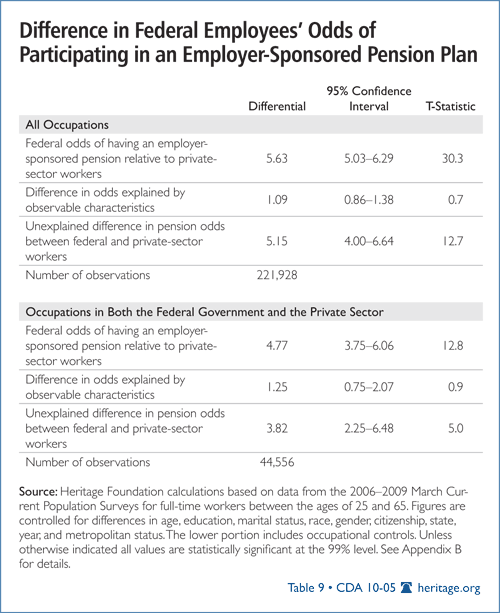
The results report the difference in odds of receiving pensions after retirement for federal and private-sector workers. The overall federal workforce has roughly five times greater odds of receiving a pension than private-sector workers, after controlling for other observable characteristics. Restricting the analysis to federal workers in occupations that also exist in the private sector still shows federal workers have almost quadruple the odds of receiving a pension than anything besides working for the federal government explains.
To interpret these figures, consider a private-sector worker who has a 50 percent likelihood of receiving a pension, given his observable characteristics. This represents even 1-to-1 odds of receiving a pension. A federal employee in this occupation with these same characteristics would have nearly 4-to-1 odds of having a pension—nearly an 80 percent chance.22 Federal workers receive far more generous pension benefits than private-sector workers.
All working Americans should have access to a retirement savings plan, not only federal employees. Congress should encourage all private employers to offer retirement savings plans, such as the automatic IRA or a 401(k) to their employees.[22]
Differences in Total Compensation. BEA figures for civilian government employees indicate that the average federal employee receives 85 percent more in total compensation than the average private-sector worker.[23] However, measuring exactly how much of this overall compensation gap is explained by federal employees’ greater skills and productivity poses serious challenges.
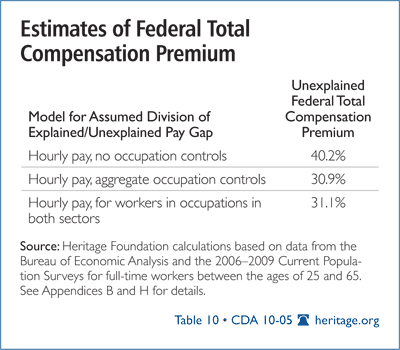
Because the March CPS does not provide information on the value of benefits beyond health care contributions, it is not possible to directly answer what portion of that premium is comparable to private-sector wages, and what portion represents taxpayer generosity. However, it is possible to approximate the portion of the compensation gap unexplained by workers’ characteristics by assuming that it follows the same breakdown as cash earnings.
This is a strong assumption. Total benefits generally rise with income, but not one-to-one.[24] Making this assumption will underestimate the federal compensation premium. Observable characteristics explain a smaller proportion of the difference in benefits between the sectors than they did hourly pay. Consequently, the following estimates are lower bounds on the unexplained federal compensation premium.
The three rows of Table 10 show the results of applying the ratio of unexplained to explained pay differences from the hourly pay models to the aggregate compensation premium. Appendix H explains this methodology in detail.
These estimates are necessarily rough approximations combining data from different data sources. Nonetheless, they give insight into the magnitude of total compensation that federal employees earn: 30 percent to 40 percent greater compensation above and beyond their observable skills. These figures are imprecise approximations of the federal compensation premium. They show that federal employees earn substantially greater total compensation than private-sector workers, even after accounting for their different skills.
Government Jobs: Almost Impossible to Lose
Federal civil servants receive another perk that few private-sector workers enjoy: near-absolute job security. In the private sector, businesses cut hiring and increase layoffs when sales drop. Since the recession began in December 2007, private-sector employers have shed 8 million net jobs. Tens of millions of private-sector employees go to work each day knowing they could lose their job at any point.
Federal employees do not. Civil service rules make it prohibitively difficult to fire federal employees for bad performance once they pass their probationary period—one year on the job. Most federal employees who perform poorly never get fired. They keep their jobs unless their supervisor works through an arduous process of exhaustively documenting their performance and working through a complex appeal process.
The federal government provides its employees with an additional perk: employees who leave government service get preferential treatment if they want to come back. Former federal employees with career status (three or more years on the job) do not have to go through public merit competitions for re-hire. Though the government does not guarantee them a new position, it moves them to the front of the line. Few private-sector workers leave their jobs with similar assurances of re-employment.
Federal employees also do not have to worry about their jobs being eliminated due to economic downturns. The federal government has added 240,000 workers since the recession began—a 12 percent increase.[25] In the private sector, the adult unemployment rate jumped from 4.2 percent to 9.4 percent between 2007 and 2009. For federal employees, unemployment barely budged from 2.0 percent to 2.9 percent.[26] Deficit spending and taxes have kept federal payrolls growing even as the economy has experienced its worst slump since the Great Depression. Federal employees have been insulated from the recession.
Even this figure overstates federal unemployment rates because many federal employees voluntarily retire once they qualify for pension benefits.[27] This allows them to earn a double income: They retire on their pension and look for a second job in the private sector. Unemployed federal retirees enjoy much more comfortable jobless spells than unemployed private-sector workers.
The new health care legislation will worsen the imbalance between private and federal payrolls even more. The government will need to hire tens, possibly hundreds, of thousands of employees merely to implement the new health care regulations. Even as the taxes and regulations in the health care bill cost jobs in the private sector, they will swell the federal government’s payrolls.
Federal Employees Rarely Quit. Federal employees know they get a better deal through their employment. The proof is that they rarely quit. Approximately 2.5 percent of private-sector workers voluntarily left their jobs each month in 2006 and 2007. During that same period, between 0.6 percent and 1 percent of federal employees voluntarily left their jobs, roughly a third the private-sector rate.[28] Since the recession began, that disparity has only grown. If federal employees earned market compensation they would leave their jobs at rates more similar to private-sector workers.
Reduce the Deficit by Cutting the Federal Payroll
Federal employees earn between 30 percent and 40 percent more than equivalently skilled private-sector workers. This represents costly forced sacrifices by lower-earning American taxpayers. The federal government will spend an estimated $180 billion on wages and salaries for civilian federal employees in fiscal year 2011, and another $64 billion on benefits—a total compensation of $244 billion.[29] There is a part of this inflated pay that Congress cannot touch. Congress has contractually obligated the taxpayers to fully fund the generous pensions of the civil service retirement system. Although giving such generous pensions to federal employees was a mistake, Congress should not retroactively void those contracts.
However, most federal compensation is not a contractual obligation and Congress can reduce it in those positions which are overcompensated. If Congress reduced this federal pay to market rates this would save taxpayers about $47 billion a year[30]— more than eliminating the entire Department of Commerce, Department of the Interior, or Department of Energy. It would be enough to fully offset the cost of patching the alternative minimum tax in 2012.
Some Members of Congress have proposed raising taxes to reduce the deficit. Congress should reject these proposals. Higher taxes reduce the incentive to invest and create new businesses— which will cost jobs. Congress should instead reduce government spending. Aligning federal pay with market rates would reduce government spending relatively painlessly.
Not All Federal Employees are Overpaid. The fact that the General Schedule and other federal pay scales over-compensate federal employees on average does not mean that all federal employees are overpaid. Many high-performing federal workers actually earn below-market wages. The pay scale and seniority-based system the government uses divorces federal pay from individual performance. The average federal premium is small relative to the dispersion of federal pay from market rates.[31] As a result, Congress should not uniformly reduce the pay of all federal employees.
What Congress Should Do
Instead of a uniform pay cut, Congress should take several steps to equitably align federal pay with market rates. Congress should:
- Abolish the General Schedule and implement performance-based pay. Congress should replace the General Schedule with pay-for-performance systems tied to market compensation. The Office of Personnel Management should set broad pay bands for each occupation and region of the country with managerial discretion to award raises for good performance, subject to budget limitations. OPM should adjust these pay bands up or down based on qualified applicant-to-position ratios and quit rates. This would align federal pay with market rates while allowing high-performing federal workers to earn what their skills merit.
- Hire More Private Contractors. Many jobs performed by federal employees are not inherently governmental tasks and can be performed by private-sector workers. However, federal regulations deter government agencies from hiring private contractors for this work. Congress should eliminate these regulations and instead require the federal bureaucracy to compete on cost and quality with private-sector workers to perform non-inherently governmental tasks. This would expose federal employees to the same market competition that private-sector workers face each day. This competitive pressure would force federal agencies to reduce compensation to market rates in order to keep work in-house. To the extent that more work was contracted out, it would also create more jobs for private-sector workers.
- Reduce Federal Benefits. Congress should reduce the generosity of its benefits to market rates. Paid leave should be reduced to comparable levels at private corporations. Congress should re-examine the utility of the existing defined-benefit plans and consider moving federal workers to a fully portable and funded 401(k)-style system instead.
- End Dismissal Restrictions. Federal workers who have passed their probationary period can only be fired with great difficulty. As a result, some federal workers slack off knowing they will not lose their jobs. Congress should allow government managers the same discretion to remove poor performers as that of private managers.
Conclusion
The federal government pays its employees substantially more than they would earn in the private sector. The current federal pay system:
- Pays hourly wages 22 percent above that of comparable private-sector workers;
- Provides more generous health care and pension plans;
- Provides total compensation on the order of 30 percent to 40 percent above similarly skilled private-sector workers; and
- Offers near-total job security and insulates federal employees from recessions.
Congress should not overtax all Americans to overpay the privileged workers in the federal civil service. Aligning federal compensation with market rates would save taxpayers between $40 billion and $50 billion a year. Congress should immediately act to bring equity to federal pay. Congress should abolish the General Schedule and implement performance-based pay, require federal agencies to compete with the private sector, and bring the benefits to market levels.
—James Sherk is a Senior Policy Analyst in Labor Economics in the Center for Data Analysis at The Heritage Foundation.
Appendix A
Oaxaca Decomposition
Economists use multiple regression analysis to study relationships between variables of interest. Regressions allow researchers to isolate the correlation between two variables while holding other variables constant—for example, how hourly pay correlates with working in the federal government or private sector, independent of the effects of age and education. One method of analyzing the data is to regress hourly pay on a variable indicating in which sector an employee works and on a series of control variables (such as education and age).
However, this approach assumes that the control variables have the same effect on hourly wages in both sectors. This may not be true. For example, earnings may increase more with age in the federal government than in the private sector because the General Schedule guarantees seniority-based raises. Assuming that age has the same effect in both sectors would understate the effect of age on the earnings of federal employees and overstate its effect on the earnings of private-sector workers.
An alternative approach to studying differences between two groups is an Oaxaca decomposition, which allows the effects of control variables to vary between two groups of workers. An Oaxaca decomposition regresses the outcome variable (i.e., hourly wages) on the control variables (age, education, etc.) separately for both groups (federal and private-sector workers). This yields different estimates on the returns to the control variables for each group.
It is then mathematically straightforward to decompose the difference in overall outcomes into a portion that is explained by differences in control variables between sectors and an unexplained portion that stems from the differences in returns to those variables in each sector.
For a detailed mathematical explanation of the Oaxaca decomposition, see Ben Jann, “A Stata Implementation of the Blinder–Oaxaca Decomposition,” ETH Zurich Sociology Working Papers No. 5, May 2008 (forthcoming in The Stata Journal), at http://www.statoek.wiso.uni-goettingen.de/veranstaltungen/statistical%20consulting/jann_oaxaca%202008.pdf (June 25, 2010).
An Oaxaca decomposition (or any other econometric analysis) can only account for differences in observable skills. Economic surveys do not measure all skills. For example, researchers cannot measure self-discipline, ambition, or creativity. If federal employees have more drive and determination than private-sector workers, an Oaxaca decomposition would report this as part of the unexplained difference in wages. In such a case it would appear as though federal employees enjoyed a greater pay premium than they actually do. Interpreting the unexplained portion of the Oaxaca decomposition as a pay premium assumes that federal workers do not have unobserved differences that make them superior to private-sector workers.
This problem is mitigated by the fact that many observed characteristics proxy for otherwise unobserved skills. For example, on average, married men earn higher wages than single men. On the surface it would appear that getting married causes men to become more productive. However, studies controlling for IQ or examining identical twins find married and single men earn roughly the same amount.[32] The average married man earns higher wages primarily because women selectively marry higher-performing men with higher earnings. Including demographic characteristics (such as marital status) proxies for such unmeasured attributes.
Appendix B
Data and Methodology
This paper analyzes data from the Current Population Survey (CPS), a monthly survey of approximately 60,000 households conducted by the Census Bureau and the Bureau of Labor Statistics (BLS). The BLS uses the CPS to estimate the unemployment rate and other labor market statistics. The sections of the paper examining differences in hourly wages (Tables 2 through 6 and Appendix Tables E.1 and F.1) used data from the monthly CPS from January 2006 through December 2009.
Every March, the CPS also includes supplementary questions about total income and benefits received in the previous calendar year. The sections of the paper examining health and pension benefits used data from the March supplement to the CPS for 2006 through 2009. This data was obtained from the Integrated Public Use Microdata Series (IPUMS) maintained by Miriam King, Steven Ruggles, Trent Alexander, Donna Leicach, and Matthew Sobek, Integrated Public Use Microdata Series, Current Population Survey: Version 2.0 (Minneapolis, Minn.: Minnesota Population Center, 2009), at http://cps.ipums.org (June 29, 2010). IPUMS allows researchers to download selected variables from larger databases and standardizes much of the data across years.
This paper examines full-time workers (35 hours or more per week) between the ages of 25 and 65. The dependent variable in the hourly pay analysis was the log of hourly pay and the independent variables were: age, age squared, and dummy variables for year, sex, marital status, an interaction term for married men, highest level of education completed (high school graduate or less, some college but no degree, associate’s degree, bachelor’s degree, master’s degree, and Ph.D. or a professional degree), race (white, black, Asian, American Indian, and Hispanic), citizenship/nativity, size of metropolitan statistical area, and state of residence. The analysis was restricted to observations in the outgoing rotation groups (months four and eight in the CPS sample).
The author of this CDA report constructed the hourly earnings variable by dividing weekly wage and salary income by the usual number of hours worked per week. He adjusted these hourly wages for inflation using the Chained Consumer Price Index (expressed in 2009 dollars) and trimmed them to remove outlying observations. Observations with reported earnings less than $5 an hour or more than $60 an hour were removed from the analysis. Due to the concerns about earnings imputation biasing results raised by Hirsch and Schumacher, the author dropped observations with imputed weekly earnings from the analysis. See Appendix G for further details on the effect this has on the analysis.[33]
The dependent variables in the analysis using the IPUMS data for the March CPS were employer contributions for health insurance and a dummy variable indicating whether a worker was included in an employer-sponsored pension. The analysis used the same control variables as in the hourly wage analysis, with the exception of metropolitan statistical area size, which was not available in the IPUMS data. Dummy variables for metropolitan status were used in place of city size.
The data was analyzed with an Oaxaca decomposition to reveal the explained and unexplained differences in the dependent variables between federal workers and private-sector workers. Standard linear regression was used for the hourly wage and employer health care contribution analysis while pension differentials were studied with a logit model. Heteroscedasticity robust standard errors were used throughout. The private-sector coefficients were taken for the unbiased coefficients in the Oaxaca decomposition because they are determined by market forces.
The Oaxaca decomposition evaluated differences between workers in the private sector and the federal government. The intent of this CDA report is to examine the differences in earnings between the federal bureaucracy and private-sector workers. The closest approximation of this concept in the CPS is workers who work for the federal government in public administration—the administration, oversight, and management of public programs. This corresponds to the North American Industrial Classification System (NAICS) code 92.[34] Public administration is a more restrictive concept than the Bureau of Economic Analysis definition of “federal general government, civilian” employees. The analysis of CPS data in the body of this paper uses this public administration definition for federal employees. This does, however, exclude many federal workers. Doctors and nurses in Veterans Affairs hospitals, for instance, do not work in public administration. It also excludes employees of the U.S. Postal Service. Appendices E and F report results using more expansive definitions of federal employees and postal employees.
Appendix C
Occupations
Table C1 shows the aggregated occupational categories used to control for occupation in Table 4.
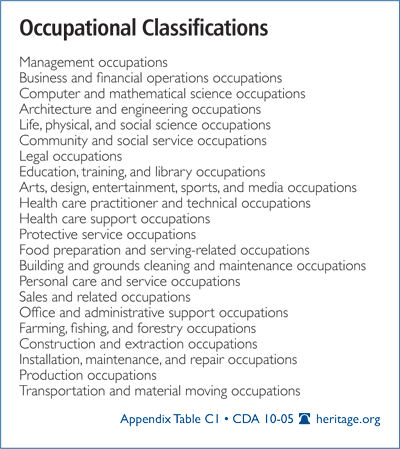
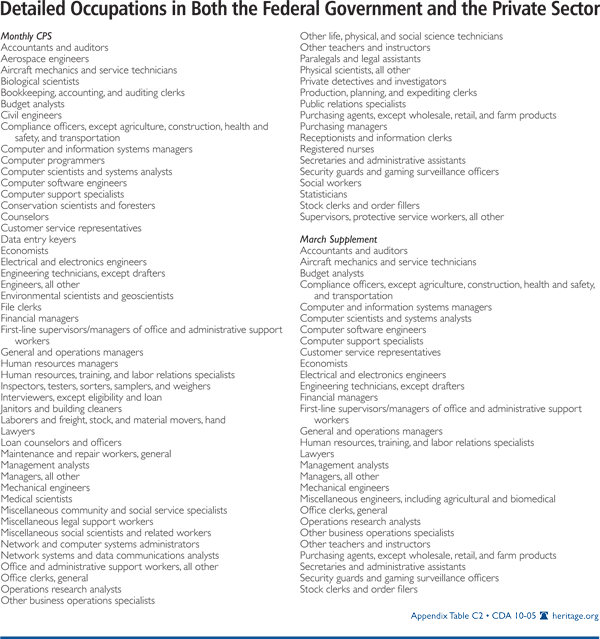
Table C2 shows the detailed occupations in the monthly CPS data and the March supplement to the CPS for which there are at least 30 observations in both the private sector and the federal government. These were the occupations deemed common to both sectors used in Tables 5, 6, 8, and 9.
Appendix D
Detailed Oaxaca Decomposition Results
The full regression results were not displayed in the main body of the paper in the interest of conserving space. Table D1 shows the coefficients from the first stage regression of observable characteristics on the natural log of hourly wages for federal employees and private-sector workers. The results are for the model including controls for aggregate occupation displayed in Table 4 in the main text. The coefficient results are expressed in log-points, not as percentages.
Table D2 shows the detailed Oaxaca decomposition of the contribution of observable characteristics toward the explained and unexplained wage gap between federal government and private-sector employees. The contributions have been transformed into percent changes. The coefficient for each characteristic under the “explained difference” shows the percent contribution that differences in that characteristic make toward the overall explained pay gap. The coefficient for characteristics in the “unexplained difference” column show the percent contribution that different returns to that characteristic between the sectors make toward the overall unexplained pay gap.
For example, the coefficient on high school education or less is 1.048 in the explained column. This means that the proportionally smaller numbers of workers with at most a high school degree whom the federal government employs raise the average wages of federal employees by 4.8 percent. The total explained pay gap of 28.5 percent is the product of all the coefficients in the explained column.
In the unexplained column the coefficient on high school educated workers is 1.040. This means that the higher wages that the federal government pays high school graduates raise the average wages of federal employees by 4.0 percent relative to the private sector. This difference in average wages comes from the federal government paying high school graduates more, and cannot be explained by the federal government employing proportionally fewer high school graduates. The total unexplained difference in wages is the product of the coefficients in the unexplained column.
Note that the age variables contribute far more than any other variable to the unexplained federal wage premium. This suggests that the guaranteed job security and advancement up the General Schedule for federal employees contributes significantly to the federal pay premium.
Appendix E
All Federal Employees Except Postal Workers
This paper aims to explore differences in pay between workers in the federal bureaucracy and those in the private sector. The results on hourly wages, employer contributions for health premiums, and pension participation presented in the body of the text cover workers employed by the federal government in the field of public administration. However, not all federal employees work in public administration. The U.S. Postal Service operates as a business that makes either profits or losses and is not considered public administration. Other positions in the federal government, such as doctors and nurses in veterans hospitals, similarly have little to do with public administration and are thus excluded from the estimated pay premium for federal bureaucrats.
Table E1 presents the results of the models used in Tables 3 through 5 on the broader universe of all workers employed by the federal government (except postal employees). Appendix F shows the results for postal employees.
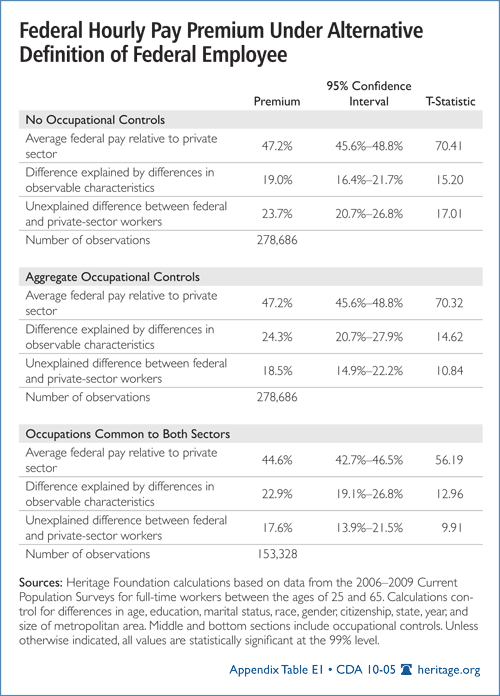
Table E2 shows the results for employer contributions for health care and for pension participation.
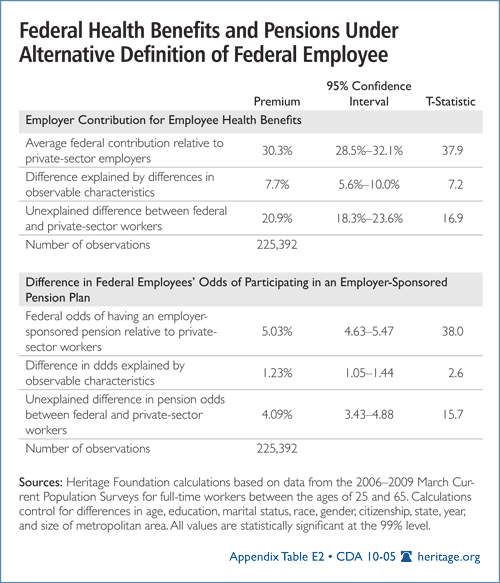
Using this broader universe of federal employees shows a somewhat smaller but still substantial hourly pay premium for federal workers. Under both definitions federal employees have similar enhanced health care contributions and odds of receiving an employer pension.
Appendix F
The U.S. Postal Service
Unlike the rest of the federal government, the postal service offers a service that it sells on the market, albeit with a federal monopoly on delivering first class mail. Postal employees also perform very different work than that of civil service employees. Table F1 presents the separate results on hourly wages for postal employees. Table F2 shows the results for health care and pension benefits.
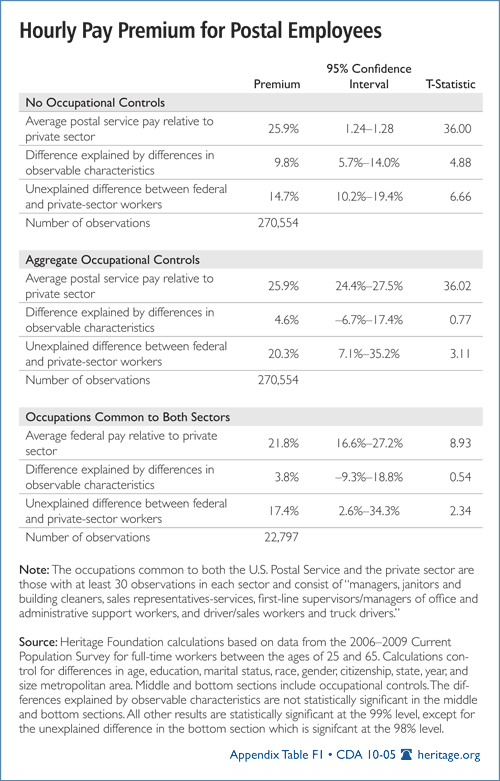
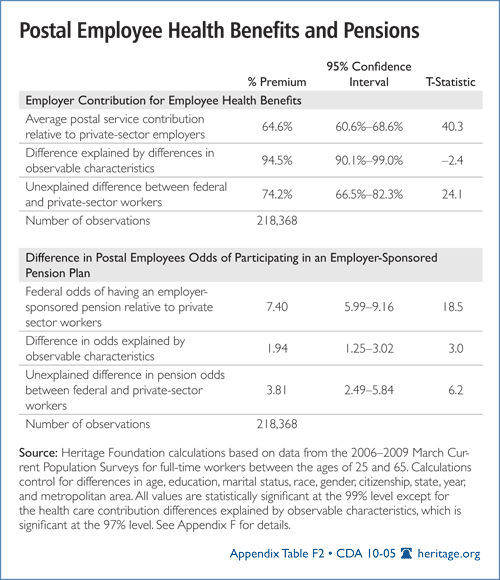
Postal employees earn more than their observable attributes suggest they should. Controlling for various measures of occupation, and looking only at the narrow slice of occupations that exist in both the postal service and private sector, postal employees earn 15 percent to 20 percent more per hour than comparable workers in the private sector. Postal employees receive substantially more employer contributions to their health care plans relative to the private sector (74 percent) than federal employees in public administration (22 percent), and have about the same increased odds of enjoying an employer provided pension.
Appendix G
Imputed Earnings
Some individuals decline to answer questions the government asks in the Current Population Survey. Earnings are a particularly sensitive topic: Roughly 30 percent of those surveyed by the CPS refuse to report how much they earn each week. Rather than dropping these individuals from the survey altogether, the statisticians who produce the CPS keep them in the sample. They deal with the missing questions by “imputing” values to them—assigning to that household earnings of demographically similar households. In many cases using all the observations in the CPS—including those with imputed earnings—provides more accurate results. However, the CPS ignores a number of variables when determining demographically similar households for the purposes of imputing weekly earnings. In particular, it does not account for either labor union status or whether the government or private sector employs that individual. In effect, approximately 30 percent of the earnings observations that are labeled as union members or federal employees in the data actually have the earnings of non-union or private-sector workers.
Averaging the earnings of 70 percent of workers who work for the federal government and earn above-market wages with the 30 percent that do not, naturally lowers the average estimated wage premium. Recent research suggests that this imparts a substantial downward bias in estimates of both union wage premiums and in the public-sector wage premium.[35] To avoid this bias, this report drops observations with imputed weekly earnings. Including observations with allocated weekly earnings would lower the estimated federal wage premium by roughly 30 percent.
Appendix H
Total Compensation Premium
The estimates of federal benefit payments and total compensation come from analysis of data provided by the Bureau of Economic Analysis (BEA), National Income and Product Accounts, Tables 6.2D, 6.3D, and 6.5D. The BEA estimates total wage and salary disbursements, total compensation, and the number of full-time equivalent employees by industry. Non-cash compensation includes employer contributions for health insurance, life insurance, retirement benefits, and social insurance payments (i.e., the employer share of Social Security taxes). It excludes some benefits, such as the value of paid leave and student loan repayments.
The average private-sector wage, benefit, and total compensation estimates come from dividing these aggregate figures for the private sector by the number of full-time equivalent employees in the private sector. Two factors complicate similar estimates for federal employees.
First, the BEA does not distinguish between federal public administration workers and other federal employees. The most detailed BEA federal classification is “general government, civilian employees,” which excludes workers in government-sponsored enterprises (i.e., the postal service) but covers all other civilian federal workers. Consequently, it is not possible to estimate the compensation of workers in just the federal bureaucracy. It can only be calculated for civilian federal employees outside government enterprises like the postal service; thus BEA figures include workers in both the federal bureaucracy and other federal employees, such as doctors and nurses at veterans hospitals.
Second, the BEA compensation figures include payments to now-retired personnel. The federal government shifted from the Civil Service Retirement System (CSRS) to the Federal Employees Retirement System (FERS) in the 1980s. The CSRS was a pay-as-you-go system with large unfunded-benefit obligations.[36] The federal government makes sizeable payments each year to amortize the cost of promised but unfunded benefits for now-retired personnel, and the BEA includes these payments in its total compensation estimates. Since these payments provide no benefit to current federal employees, including them in the estimates of compensation per worker would be misleading.
The BEA does not report directly the portion of federal compensation that comes from these payments to former personnel. The author estimated these payments using a methodology that BEA staff indicated closely approximated their figures. The author used data on payments to former personnel from the Office of Personnel Management. These figures covered all federal civilian employees, both those in general government and those in government-sponsored enterprises. These total payments were multiplied by the ratio of wage disbursements for general federal employees to disbursements for all federal civilian employees from the BEA National Income and Product Accounting (NIPA) accounts. This yielded the estimated benefits payments going to former employees in the general federal civilian sector. These payments totaled approximately $15 billion in 2008.
The total compensation figures in Table 2 are calculated by subtracting these estimated payments from the NIPA estimates of total compensation for general federal civilian workers. The remaining compensation was then divided by the number of full-time equivalent workers in that sector. These figures were adjusted for inflation using the Chained Consumer Price Index and averaged across 2006, 2007, and 2008. The figures show compensation for the average federal employee 85 percent above that of the average private-sector worker.
The author then estimated the share of this federal compensation premium explained by observable characteristics and the portion remaining unexplained by factors other than working for the federal government. He did so by assuming that total compensation follows the same proportionate decomposition into explained and unexplained premiums that cash earnings do. This is a strong assumption that is almost certainly not true—however, as Tables 8, 9, and E.2 demonstrate, observable characteristics account for a smaller portion of the federal advantage in benefits than they do cash earnings. As a result, this assumption will understate the actual federal advantage and provides a lower-bound estimate on the average federal premium.
Because the most detailed BEA classification is “civilian employees in the general federal government,” this is the most detailed level for which it is possible to estimate the total compensation premium. It is not possible to examine only the workers in the federal bureaucracy (public administration). The estimates reported in Table 10 were consequently calculated using the decompositions for federal employees using the models reported in Appendix E, Table E.1. Federal employees in the annual income regressions were again defined as all civilian federal workers outside the postal service and not the narrower category of workers in public administration.
Applying the explained/unexplained decomposition proceeded as follows: The overall federal compensation premium is 84.8 percent, or 0.614 log points. The ratio of the unexplained to the total federal premium (in log points) from the Oaxaca decompositions was applied to this figure to yield the total unexplained compensation difference. To illustrate these calculations consider the estimate in Table E.1 using broad occupational controls. The total difference in wages between federal employees and private-sector workers from this model is 0.3866 log points.[37] Of that difference, 0.2171 log points were explained by observable characteristics and 0.1695 remained unexplained. So, observable characteristics do not explain 43.8 percent of the log-point difference in hourly pay. Multiplying the overall compensation premium of 0.614 log points by 43.8 percent yields an unexplained compensation premium of 0.2691 log points—30.9 percent.
To calculate the taxpayer savings from reducing federal pay to market rates, the author used the lowest estimate from Table 10 of a 30.9 percent federal compensation premium. He estimated federal compensation costs for FY 2011 if civilian federal compensation was reduced by this amount.[38] The author then added to this adjusted compensation figure the cost of amortized promised future benefits for employees currently in the Civil Service Retirement System—$10.5 billion in FY 2011. The government is contractually obligated to pay these benefits, so they should not be considered potential savings. This calculation yielded adjusted federal compensation costs of $197 billion in FY 2011, representing taxpayer savings of $47 billion.
These figures include the cost of compensation for employees in the executive, legislative, and judicial branches and excludes the postal service. The author used budget figures from the Office of Management and Budget (OMB) for the payroll costs of the federal workforce because the BEA data ends in 2008. Note: The OMB accounts for federal compensation slightly differently than does the Bureau of Economic Analysis. For details on differences between the NIPA accounting and budgetary accounting, see Office of Management and Budget, Analytical Perspectives: Budget of the U.S. Government, Fiscal Year 2011, Chapter 28, National Income and Product Accounts, at http://www.whitehouse.gov/omb/budget/fy2011/assets/spec.pdf (June 25, 2010).
Because of the uncertainty in estimating the overall federal compensation premium and because of the differences between OMB accounting and the NIPA figures used to calculate overcompensation, the estimated taxpayer savings should not be treated as a precise estimate. It is unlikely that the taxpayers would save exactly $47 billion if Congress reduced federal pay to market rates. The taxpayer savings could easily range from $40 billion to $60 billion. The $47 billion figure shows the approximate magnitude of the savings to taxpayers and does not represent a precise accounting measure.
Appendix I
2010 General Schedule for Workers in the “Rest of the United States”
