Abstract: Renewable energy—harnessing the power of the wind and the sun—sounds wonderful until confronted with the facts. While wind and sun are indeed free, turning their energy into consumer-accessible electricity is not. Nor is it easy. Wind power must be used at the moment the wind is blowing— which it generally does not do during blazing-hot summer days, the peak of electricity use. Both solar and wind power require costly installations and transmission mechanisms. Instead of saving money for Americans, renewable energy sources are much more likely to spike their utility bills. Nevertheless, Congress is considering a mandate for a nationwide renewable electricity standard (RES). Heritage Foundation energy policy experts explain why an imposed national RES would be bad for families, bad for business, and bad for the economy.
Congress is once again considering major energy legislation, focused largely on promotion of energy sources that produce few or no greenhouse gases. This current concentration on promoting so-called renewable energy sources assumes that congressional action now will lead to such significant growth in renewable energy sources that the use of carbon-based energy will subside, thus reducing the expansion of atmospheric carbon dioxide and other global warming gases.
Congress’s effort to expand renewable energy sources starts from a relatively meager production base. Nearly half of America’s electricity is generated from coal, with natural gas and nuclear energy adding about 20 percent each.[1] Most of the rest is provided by renewable sources, primarily hydroelectric energy at 6 percent. Non-hydro renewables like wind and solar energy and biomass total only 3 percent.
For many years, federal energy and environmental policy has nudged production of some electricity sources over others, either through “sticks,” such as costly air quality regulations targeting coal, or through “carrots” like tax credits and subsidies for wind. Proposed global warming legislation would alter the electricity mix to an unprecedented degree by putting a price on emissions of greenhouse gases, chiefly carbon dioxide from fossil fuel combustion. Coal is the most carbon-intensive energy source, and any stringent cap-and-trade provisions would significantly curtail its use in favor of other sources in the decades ahead. Such legislative measures, however, are very costly,[2] and the prospects for passage in 2010 are uncertain.
Congress is also considering achieving similar but less ambitious goals via a renewable electricity standard (RES). Twenty-nine states have versions of an RES, but Washington is considering a nationwide standard. Under this mandate, a growing percentage of electricity would have to be produced by approved renewable energy sources. Much of the RES would be met with increased energy generation from wind turbines.
It stands to reason that an RES would raise electricity prices. After all, if electricity created by wind and other renewables were cost competitive, consumers would use more of it without a federal law to force consumption. Recent experience with the mandate for renewable fuels like corn ethanol also suggests significant cost increases as well as technical shortcomings.[3]
While proponents argue that wind is free, harnessing it into useful electricity certainly is not. However, the question of how much an RES will affect electric bills does not have a straightforward answer.
Perhaps easiest to calculate is the direct cost of purchasing, installing, and operating the increasing number of wind turbines needed to meet the RES. A bit murkier are questions about the costs of the necessary additional transmission lines to deliver the electricity from where it is generated— the most desirable sites for wind are often remote mountain ridges or sparsely populated plains—to the cities where it is needed.[4] The economics of an RES is further complicated by the legal and administrative objections to establishing appropriate sites for wind farms and transmission lines, which already are quite common and would only grow with an RES.[5]
It is particularly difficult to take into account the substantial costs created by the intermittent and unreliable nature of wind. Simply put, the wind does not always blow, and it is difficult to predict and impossible to control. Given the need for electricity 24 hours a day seven days a week and the reality that times of peak demand—hot summer days—are precisely when the wind is usually still, a mandate for increased wind-generated energy is also a mandate for increased non-wind backup systems for balancing wind fluctuations.[6] In effect, increased wind power cannot simply be added to the existing grid without transforming the grid in ways that introduce both significant costs and operational inefficiencies.
These shortcomings will not be overcome through increases in scale. Connecting a large number of widely dispersed wind farms to the grid will not smooth the overall supply enough to make balancing unnecessary. Though variability can be reduced, a recent analysis states, “These results do not indicate that wind power can provide substantial baseload power simply through interconnecting wind plants.”[7]
There are federal studies of the costs of an RES that conclude that it would add no more than a few percent to electric rates,[8] but these studies do not take the full cost of wind and other renewables into account. This Center for Data Analysis (CDA) Report provides such a comprehensive economic analysis.
CDA analysis projects that an RES as outlined below would:
- Raise electricity prices by 36 percent for households and 60 percent for industry;
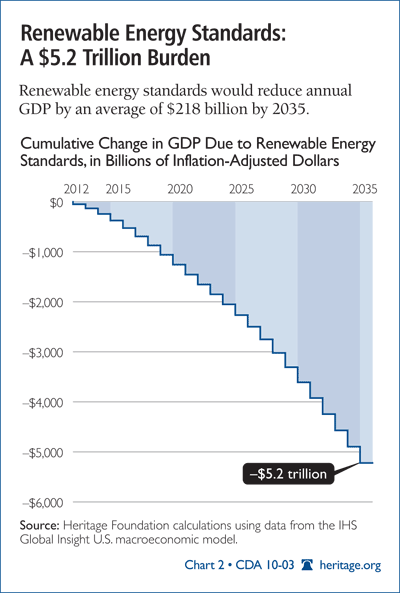
- Cut national income (GDP) by $5.2 trillion between 2012 and 2035;
- Cut national income by $2,400 per year for a family of four;
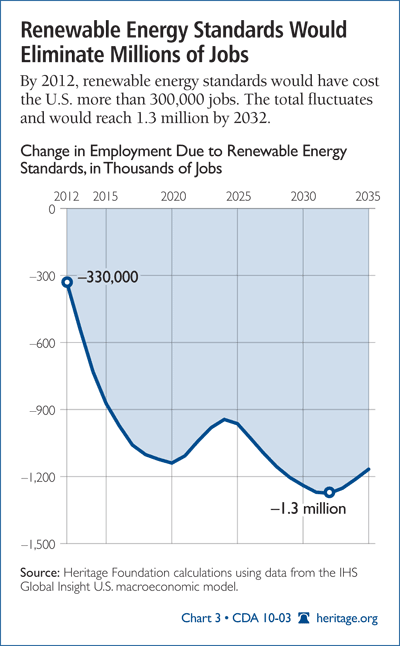
- Reduce employment by more than 1,000,000 jobs; and
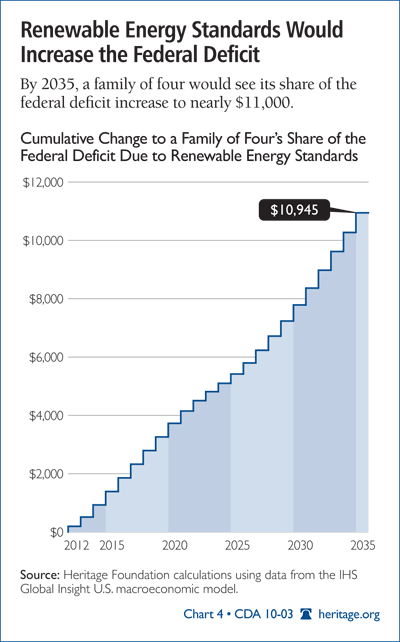
- Add more than $10,000 to a family of four’s share of the national debt by 2035.

Comparing the Costs of Wind and Coal
The flow of wind is erratic and uncertain, which means that so is the power generated from wind. This unreliable nature is especially problematic when wind is used to generate utility-scale electricity for the power grid.
Keeping line quality, primarily voltage and frequency, within the necessarily close tolerances requires constant monitoring of demand and the constant monitoring and adjustment of supply.[9] Even under the best of circumstances, these adjustments require a certain fraction of power to be delivered from generators that can be ramped up and down rapidly. For the most part, this easily ramped electricity comes from natural-gas fired turbines that are relatively expensive to operate compared to a baseload source such as coal, nuclear, or natural-gas combined-cycle power plants.
Though coal, nuclear, and gas combined-cycle power plants are much more sluggish in response to changing demand, their dependability is very high. Indeed, their output can be matched to sizeable, expected changes in demand when given sufficient lead time. Wind energy plants do not have this ability by themselves, so direct comparisons of wind costs per kilowatt hour to coal or gas costs are misleading.
Further, location choices for fossil and nuclear-fueled power plants have much greater latitude than those for wind turbines, which, like hydropower plants, must be located where the natural resource is best suited—not necessarily close to where the power is used. This feature adds additional transmission costs to wind energy.
With nuclear power not considered to be renewable, the least-cost renewable source for electricity is onshore wind. In an early-release version of its “Annual Energy Outlook 2010,” the Energy Information Administration (EIA) lists the levelized costs of various sources of electricity projected for 2016 (in 2008 dollars).[10]
The EIA levelized costs per megawatt hour are $78.10 for conventional coal power,[11] $149.30 for onshore wind power, $191.10 for offshore wind power, $396.10 for photo-voltaic solar power, $256.60 for thermal solar power, and $139.50 for power generated by natural-gas conventional turbines.
Even though the $149.30 for the cheapest renewable power is already well above the cost of conventional power sources, it does not include any adjustment for reliability or additional transmission costs.
Wind cannot be turned on and off to match changes in demand. There are no feasible energy storage options for most wind farms. So, unlike power from conventional sources, wind power must be used when the wind is actually blowing.
Geography puts wind at another disadvantage. To keep the cost of wind power as low as possible, it is necessary to locate the wind farms in areas with the strongest and steadiest winds. As is the case with solar power, many of the best areas for wind power are located far from the major population centers. This requires construction of new, high-capacity transmission lines. A review of transmission costs suggests a median cost of $15 per megawatt hour.[12]
The dependability problem is more complicated. Power-grid management requires constant and instantaneous balancing of supply and demand. Sophisticated analysis and long experience guide grid operators as they schedule the various sources of generation. Nevertheless, there will still be unanticipated changes in both supply and demand; further, there can be variations in demand that cannot easily be matched by the most efficient conventional sources (coal, nuclear power, and integrated combined-cycle gas) even if they are anticipated. The most common energy source for balancing these very short-run changes is natural gas turbines, which are less efficient than coal, nuclear power, or natural gas combined cycle.
Wind, like solar energy, is not a dispatchable power source; that is, it cannot be turned on at will. As a result, increasing dependence on wind adds variability and uncertainty to the power grid that must be offset by quick-ramping power sources like natural gas turbines to maintain a relatively constant flow of electricity.
This increased reliance on natural gas turbines comes from two sides of the balancing equation. When there is an unanticipated decline in wind generation, or when the decline is anticipated but is for too short a period to balance with coal, natural gas turbines fill the gap. On the other hand, when wind generation is low compared to capacity, there is need for power sources that can be quickly ramped down. In this case, there would be additional need for natural gas generation so that unanticipated increases in wind power can be accommodated by rapidly cutting power from the natural gas turbines.
Gas turbines are not a renewable energy source, so swapping a megawatt hour of wind power for a megawatt hour of coal power also requires swapping power from natural gas turbines for additional coal. Since coal power is cheaper than power generated by natural gas turbines, the difference must be added to the cost differential between wind and coal.
There is little research directly addressing the question of how much additional gas-turbine power will be needed. The theoretical limits are zero (all fluctuations are perfectly anticipated and balanced with the cheapest coal power) and the inverse of the capacity factor, which would imply three megawatt hours of additional gas-turbine power for every megawatt hour of wind power.[13] In theory, this could add as much as $179 per megawatt hour to the cost of wind power.
A study done for the National Renewable Energy Laboratory indicates that the spinning reserves must be increased about 0.2 megawatt capacity for each megawatt of wind power.[14] “Spinning reserves” describes the power plants that must be warmed up and synchronized with the grid so that they can be brought online more quickly. They use fuel, but not as much as when they are called upon to supply power to the grid.
This measure is somewhat different from the necessary increase in actual gas-turbine electricity production, but it is very much related to the uncertainty and variability problem. Though 0.2 megawatt per hour may be a significant underestimate for the amount of additional gas-turbine power, it is the factor employed for this analysis. That is, for every megawatt hour of wind that is substituted for coal power, an additional 0.2 megawatt hour of gas-turbine power must be substituted for coal as well. Using this ratio adds $12 per megawatt hour instead of the theoretical maximum of $179 per megawatt hour to the cost of wind power.
After making these adjustments for transmission costs and additional gas-turbine generation, the cost of an additional megawatt of onshore wind power is $177 per hour. This is 126 percent above the cost of a megawatt of coal power per hour.
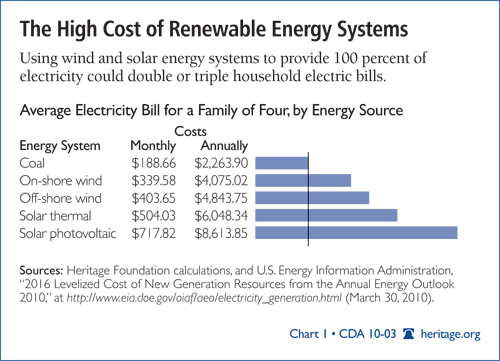
Put another way, the electric bill for a typical family of four would be $189 per month if it was powered entirely by coal, but it would rise to $340 per month if it was supplied entirely by onshore wind power.[15]
Since onshore wind is the least expensive of the renewable electricity sources (ruling out conventional hydro and nuclear power), any plan that uses the more expensive renewable sources—such as offshore wind ($218 per megawatt hour); thermal solar power ($284 per megawatt hour); or photovoltaic solar power ($423 per megawatt hour)— would have even greater costs. As the mandated renewable-fraction of electric power rises, so does the average cost of electricity.
Chart 1 shows the hypothetical family-of-four electric bill for different sources of electric power. Though former Vice President Al Gore has suggested moving the country entirely to renewable electricity generation in 10 years, few if any legislative proposals seek complete dependence on renewables. Nevertheless, Chart 1 illustrates the large cost differences between the cheaper conventional energy sources and various renewable energy sources.
With a standard that requires only a fraction of electricity to be generated by renewable sources, the adverse impact on electric bills will be diluted as the higher cost of renewable electricity is averaged with the lower-cost conventional power. However, as the relative amount of wind power grows, the impact on electricity prices grows as well.
A Renewable Standard
Renewable energy standards typically stipulate a timeline of minimum levels of electricity that must be met by approved renewable sources. Usually, these minimum levels are expressed as a fraction of total electricity generation for each year.
For the purposes of this study, the RES starts at 3 percent for 2012 and rises by 1.5 percent per year. This profile mandates a minimum of 15 percent renewable electricity by 2020, a minimum of 22.5 percent by 2025, and a minimum of 37.5 percent by 2035, which is the end year for this analysis.
CDA analysts assume that the higher costs of the renewable power are averaged in with the lower costs of conventionally generated power so that within each of the sectors (industrial, commercial, and residential), all customers pay the same price per kilowatt hour. Further, for the purposes of this analysis, prices do not vary from one part of the country to another. In reality, an RES will have differential impacts from one market to another. In general, smoothing adverse impacts in economic analysis reduces overall costs. So although the analysis may blur the pattern of economic distress, it is unlikely to have overestimated it.
Economic Responses
When the cost of any commodity rises, actors in the economy respond in uncounted ways to offset the impact. Though specific responses cannot be predicted, general patterns and magnitudes can be estimated from past responses to price changes.
Electricity prices have risen and fallen over the decades, and businesses and households have adjusted. The adjustments can be as routine as parents reminding their children to turn off the lights or as entrepreneurial as an engineer setting up a firm to develop new technology. When electricity prices rise, heat-pump salespeople are more likely to emphasize the advantages of their more efficient (and more expensive) models; producers of electronic controls will see a greater market for programmable thermostats; people will turn down the thermostat and be more inclined to buy Energy Star-rated appliances.[16] These impacts and more are reflected in the complex system of equations that have been estimated for the macroeconomic model and are reflected in the coefficients of the smaller energy model employed to estimate initial electricity price effects.[17]
Even when averaging the cost of the mandated renewable electricity with the cheaper conventionally sourced electricity, the price rises are noticeable. For residential consumers, the price increases start small (because the renewable mandate starts at only 3 percent), but by 2035, the price rises 36 percent above the baseline price. Forced to pay higher prices, households cut electricity use by 19 percent. Even after these consumption cutbacks, a family of four will see its annual electric bill rise by over $300.
Because the cost of generation is a bigger fraction of the industrial electricity price than of the residential electricity prices, the RES causes a bigger percentage increase in industrial electricity prices than in residential electricity prices. The price increase is 5 percent in 2012 and rises to 60 percent in 2035. The higher prices force cutbacks in consumption that reach 23 percent below baseline in 2035. The net impact in 2035 is that industrial users will pay out 21 percent more dollars for 23 percent less electricity than if there were no RES.
Electric power is one of the most critical inputs to a modern economy. Thus, it is no surprise that forcing the cost of electricity to rise dampens economic activity. The cost increase for electricity can be viewed as a particularly damaging energy tax, because a renewable mandate, unlike the case of a normal tax, provides no revenue to at least partially offset the higher cost. By way of comparison, the highway use tax on gasoline raises the price of gasoline, but it also generates revenues for building and maintaining roads and bridges.[18] On the other hand, a renewable energy standard raises costs in the form of less efficient production, which provides no economic benefit.
As an analogy, suppose a farmer is able to produce 10,000 bushels of wheat per year with the aid of irrigation from a nearby river. If a regulation prohibiting irrigation cuts production to 9,000 bushels, then, to the farmer, this is the same as a 10 percent tax. However, with an actual tax, the government would have 1,000 bushels to distribute, while with the prohibition on irrigation, those bushels simply disappear—providing benefits to no one.
The Macroeconomic Impacts
Analysis of cap-and-trade bills that impose economy-wide reductions in CO2 emissions shows overall losses to the economy of $5 trillion to nearly $10 trillion between 2012 and 2035.[19] Though renewable energy standards apply only to the power sector (electricity generation), they provide less flexibility in meeting the goals than does cap-and-trade and can lead to losses of the same order of magnitude as the more comprehensive cap-and-trade regulations.

The broadest measure of a country’s economic activity is gross domestic product (GDP). As the mandated level of renewable energy rises over time, so does the cost of electricity and so do the losses imposed on the economy. Compared to the no-RES baseline, GDP drops by $50 billion in 2012. The annual losses increase to $197 billion by 2020, $300 billion in 2030, and more than $325 billion in 2035. Summing up the impacts for 2012 to 2035 yields a total loss of $5.2 trillion. All of these impacts are adjusted for inflation to 2010 dollars. On a family-of-four basis, this lost income averages over $2,400 per year.
When the economy is shocked by the higher electricity prices, employment declines. In the first year (2012), employment drops 330,000 jobs below the baseline level. The battle between market adjustments and ever-rising electricity prices leads to periods of growing job losses interspersed with periods of relative stability. However, by 2017, employment falls 1,000,000 jobs below the baseline and at times is more than 1.2 million jobs below the baseline. On average, there will be 1,000,000 fewer people working with the RES in effect than if there were no RES.

Falling incomes and rising unemployment squeeze government finances from two sides: Tax revenues fall, and expenditures on such things as unemployment insurance rise. These two responses cause federal deficits to grow even faster than they are already projected to grow. The RES will add over $10,000 to a family of four’s share of the national debt by 2035.

Conclusion
Mandating that an ever-increasing fraction of electrical power must be generated from renewable sources will raise the cost of electricity, force inconvenient and painful cuts in electricity use, and damage the economy. Households will see their electricity prices rise 36 percent by 2035, while industrial users will see their electricity prices rise 60 percent even after adjusting for inflation.
Since virtually every product and service depends on electricity to some extent, these price increases have pervasive impacts. Compared to projected levels without the RES, economic activity falls by $5.2 trillion, which is an inflation-adjusted average annual loss of $218 billion, or more than $2,400 per family of four each year.
Declining economic activity is bad for employment. Implementing the RES cuts jobs. Compared to baseline projections (that is, without the RES), employment averages 1,000,000 jobs below the baseline projection.
Though the source of wind and solar energy is free, power delivered from these sources is very expensive. For now at least, onshore wind is the cheapest renewable energy source that can be scaled in significant fashion. But scaling up wind power simply lays bare the costly nature of harnessing wind and magnifies the economic losses. A renewable electricity standard is not a path to the new economy, but an example of the stale old thinking that will hobble the already damaged economy with job-killing cost increases.
—David W. Kreutzer, Ph.D., is Research Fellow in Energy Economics and Climate Change in the Center for Data Analysis; Karen A. Campbell, Ph.D., is Policy Analyst in Macroeconomics in the Center for Data Analysis; William W. Beach is Director of the Center for Data Analysis; Ben Lieberman is Senior Policy Analyst in Energy and the Environment in the Thomas A. Roe Institute for Economic Policy Studies; and Nicolas D. Loris is a Research Assistant in the Roe Institute at The Heritage Foundation.
Appendix
Methodology
As described in the section “Comparing the Costs of Wind and Coal,” CDA analysts calculated the increase in the cost of wind power per megawatt hour. This cost is then translated to that for 1 percent of base-year power production. This 1 percent cost is multiplied by the RES percent for each year, and an average price increase is calculated from that. The price increases are then passed on to the macroeconomic model.
Macroeconomic Simulation Overview
Heritage analysts used the IHS Global Insight long-term macroeconomic model of the U.S. economy to estimate the effects of the Clean Energy Jobs and American Power Act (S. 1733) on the overall economy.[20] The simulation was implemented by changing variables in the macroeconomic model according to the changes predicted by a microeconomic model of the energy sector maintained by the CDA (see above). In order to estimate the policy impact, two main pieces needed to be simulated: price effects and energy efficiency effects.
The energy model estimated the change in energy production prices and retail energy prices that would result from changing the production mix from renewable energy and traditional energy sources. These prices were matched with their corresponding variables in the macroeconomic model to estimate the effect that these price changes would have on the economy overall.
The energy model projects changes in fuel efficiency and changes in total highway fuel consumption. Corresponding macro-model variables were changed. The effect of these changes helps to mitigate some of the total increased consumer expenditure on fuel.
The macroeconomic model does not have specific variables corresponding to alternative renewable fuel sources as does the CDA energy model. The macroeconomic simulation takes into account the increase in domestic alternative fuel source supply by adjusting the variable amount of residual energy demand that affects the amount of imported energy.


